This research was performed with Dennis Van Dyk, OMAFRA Vegetable Crop Specialist.
In 2018, MS Gregson introduced a line of electrostatic sprayers (the Ecostatik) in Canada. While electrostatic technology has been used in agriculture since the 1980’s, this is the first time ground rigs have been so readily available to Ontario (possibly Canadian) growers.
The 3-point hitch Ecostatik can be configured for vertical booms or for banded/broadcast applications. The largest version has a 150 gallon tank, 10 gallon rinse tank and 72 nozzles on 7.5″ centres on a 60 foot boom. That model requires a 75 HP tractor, but 100 HP is preferred. The manufacturer claims the Ecostatik uses 50% less spray mix, gives superior underleaf coverage, and loses less spray to the soil compared to conventional methods.

Objective
In the summer of 2018 we evaluated and compared the electrostatic sprayer to conventional application methods at the University of Guelph’s Holland Marsh Research Station. Our goal was to assess spray coverage and physical drift in a vegetable crop.
Treatments
- Treatment 1: Conventional Hollow Cone (HC) at 53.5 gpa (500 L/ha).
- Treatment 2: Conventional Air Induction (AI) flat fan tip at 50 gpa (468 L/ha).
- Treatment 3: Ecostatik at 11.8 gpa (110 L/ha): electric charge on.
- Treatment 4: Ecostatik at 11.8 gpa (110 L/ha): electric charge off.
Sprayer set-ups
Conventional Sprayer:
- 11.5 ft (3.5 m) boom with 20” (50 cm) nozzle spacing set 18” (45 cm) from nozzle to top of crop.
- Treatment 1: D3-DC25 HC @ 140 psi and 3 km/h. SC-1 SpotOn calibration vessel (SC-1) gave an average flow of 1.36 L/min (0.36 gpm). Very Fine spray quality.
- Treatment 2: AI11003 AI @ 80 psi and 4 km/h. At 50 psi, SC-1 gave an average flow of 1.21 L/min (0.32 gpm). Very Coarse spray quality.
Ecostatik Sprayer:
- 15 ft (~4.5 m) boom with 7.5” (19 cm) nozzle spacing set 18” (45 cm) from nozzle to top of crop.
- With tractor set to 2,100 rpms, avg. air speed was measured using a Kestrel wind meter. The turbulent nature of the air precluded testing with a Pitot meter. At 5″ from the nozzle: 71.5 mph (32 m/s). At 10″: 37.5 mph (16.6 m/s). At 18″ (target distance): 21 mph (9.4 m/s).
- The MaxCharge nozzles contained TeeJet CP4916-16 flow regulator orifice plates. At 25 psi they should have emitted 0.020 gpm. However, the SC-1 indicated a consistent 0.034 gpm from multiple nozzles. We postulate that the air assist created a low pressure environment that increased flow. Extremely Fine spray quality.
- Treatment 3: Electric charge of -16 µA (tested using a voltmeter set to 200 µA) and speed of 3.7 km/h.
- Treatment 4: Electric charge off and speed of 3.7 km/h.


Experimental Design
Fluorimetry
We used the fluorescent dye Rhodamine WT as a coverage indicator. This allowed us to take tissue samples to evaluate deposition, rather than rely on analogs like water sensitive paper. Further, the dye is detectable in parts per billion concentrations, making it sensitive enough for detection in drift studies.
- The conventional sprayer received 40 gallons (151.5L) of water dosed with 303.5 mL dye (i.e. 2 mL / L).
- The electrostatic sprayer 20 gallons (75.75 L) of water dosed with 151.5 mL dye (i.e. 2 mL / L).
- A sample of the tank mix was collected from the nozzle prior to each application. It was later used to calibrate the fluorimeter for samples taken during that application.
- Tissue samples were removed and dried to establish their dry weight.

Spray Coverage
We chose to spray carrot on 20″ (50 cm) spacing on August 30, when the crop canopy was densest and represented the most challenging target. Our targets were leaflets located about mid canopy depth, and 1″ lengths of stem just above the crown. A diagram illustrating the experimental design appears later in the article.


- 12 m blocks were randomly flagged for each treatment. There were 3 blocks per treatment. 4 treatments * 3 replications = 12 blocks.
- Temperature, windspeed, humidity and time were recorded prior to each application.
- Three plants were randomly sampled from each block. These sub samples were averaged to get a single data point. 3 replicated blocks x 4 treatments x 6 subsamples = 72 tissue samples (36 leaflets and 36 stems).
- Samples were collected 60 seconds after spraying ended, placed in sample tubes pre-filled with 40 mL of water and immediately placed in the dark.
Drift
We also performed an analysis of physical drift for each treatment.
- 4″ lengths of pipecleaner mounted vertically ~12″ above the crop canopy as drift collectors.
- They were placed in a straight line from the middle of the boom at 1 m, 2 m, 4 m, 8 m and 16 m downwind.
- Samples were collected 60 seconds after spraying ended, placed in sample tubes pre-filled with 40 mL of water and immediately placed in the dark.

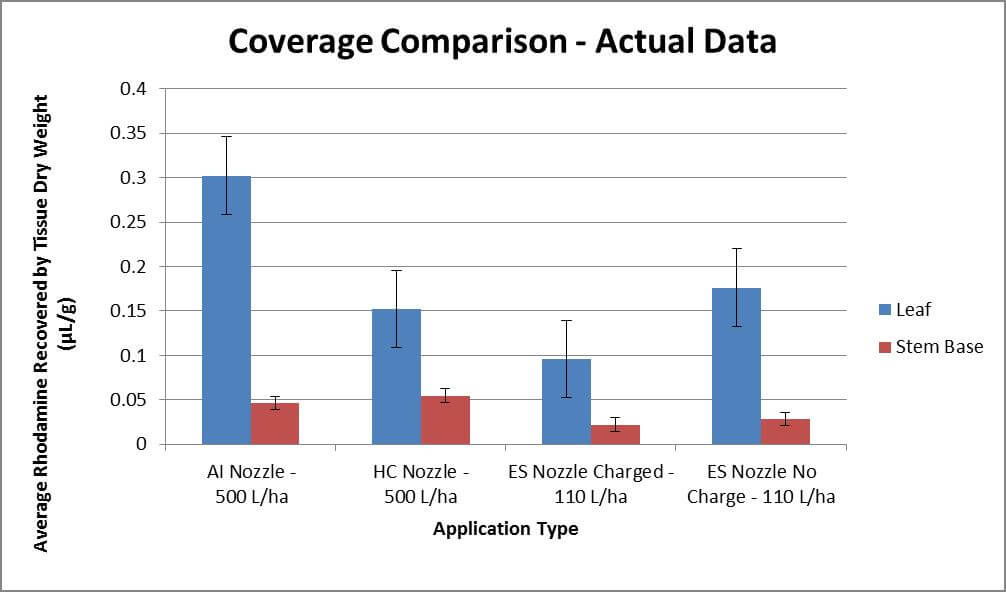
The following graph shows the coverage observed in µL rhodamine per dry weight of tissue sampled. Bars represent standard error. Each treatment represents three passes (n=3) where each pass included three sub-samples averaged to offset the high variability inherit to spraying. While statistical analysis did not prove significant, there were strong trends. The AI nozzle deposited more dye on the leaves, while the HC and both electrostatic applications were par. Stem coverage achieved in conventional applications was approximately double that of the electrostatic. However, note that the electrostatic system only applied 1/5 of the volume sprayed conventionally.

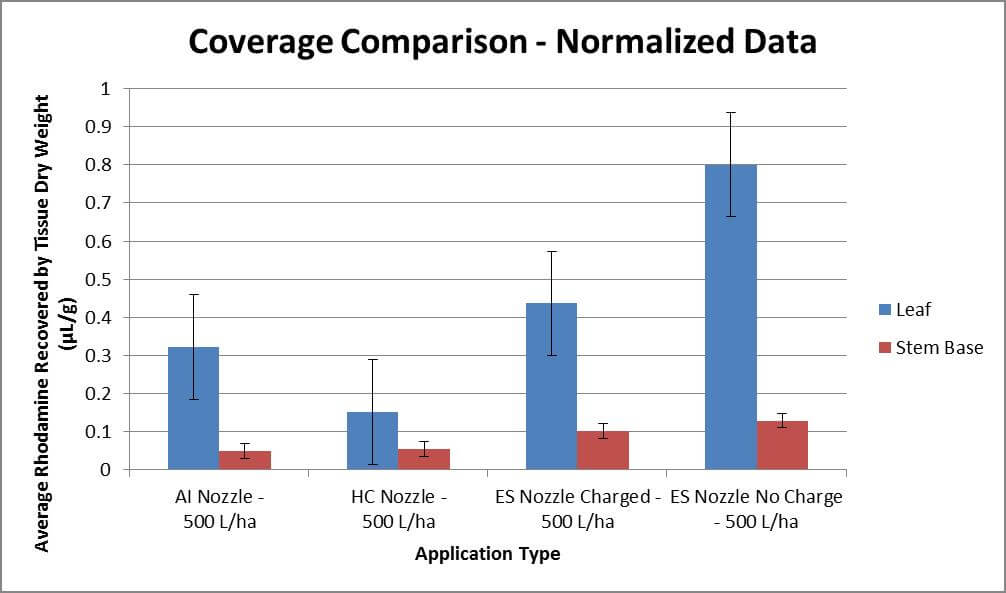
When the data is normalized to depict a 500 L/ha application for all treatments, a different story emerges (see below). Now foliar coverage is 25-100% better for electrostatic applications than conventional. Stem coverage is twice that of conventional. Unexpectedly, the uncharged electrostatic treatment outperformed the charged treatment on the leaves. This might be the result of variability in the application, or the result of coronal discharge which can occur when pointy leaves repel charged droplets. This suspicion might be supported by the similar coverage achieved on the stems in both Treatment 3 and 4. You can read more about the Corona Discharge Effect in this article.

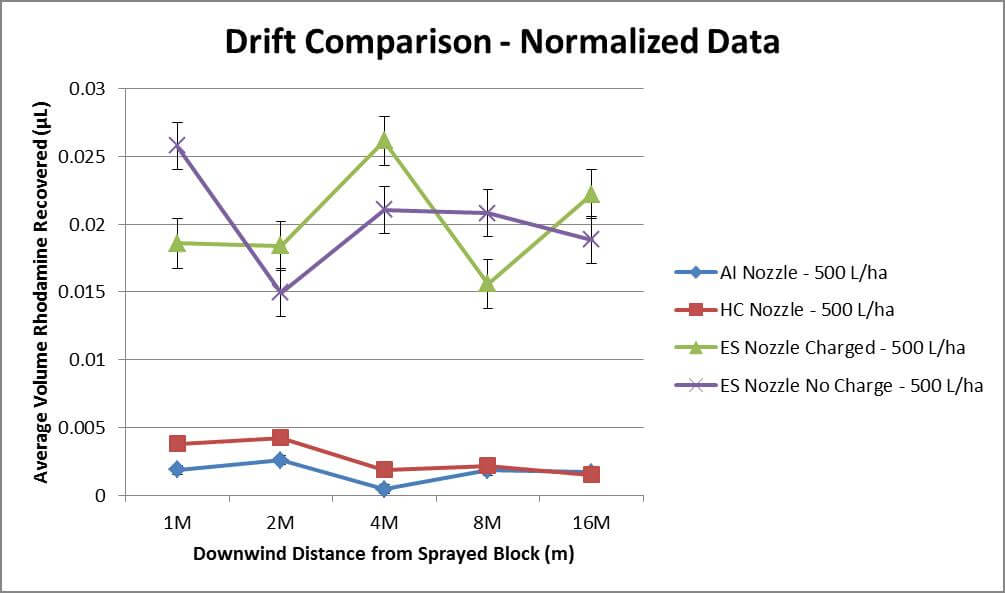
Regarding drift, we will focus on the normalized data (where all treatments are adjusted to 500 L/ha). An analysis of variance indicated with 95% confidence that the electrostatic treatments drifted significantly more than conventional (approximately 5x more rhodamine detected). Particle drift follows an inverse square rule, where levels decline with distance, but the decline is only minor in all treatments. This may be a function of weather conditions, coupled with the limited distance investigated.
Winds averaged 6.5 km/h gusting up to 10 km/h at boom height. Temperatures were between 15-17°C and relative humidity at ~70%. These conditions are conducive to drift as droplets are less likely to evaporate and in the case of Very Fine droplets, travel great distances. Many drift studies extend to 300 m from the point of application, whereas we were unable to monitor beyond 16 m. The downward trend would likely have been observed were we able to sample further downwind.

Observations
Our data supports the manufacturer’s claim that the electrostatic sprayer has the potential to match the coverage from a conventional application while using 50% less water and pesticide. It is unclear whether the electrostatic charge plays a role in this coverage, or if it is the result of the Very Fine spray quality and air assist (which have been demonstrated to improve canopy penetration). Further, it is unclear whether the charge may actually have been detrimental in the carrot crop. Claims of improved coverage uniformity were not explored in this study, but observations of water-sensitive paper in soybean (see image below) did indicate consistent under-leaf coverage, even at 50% application volume.

The five-fold increase in drift potential is a significant barrier for this technology. The spray cloud is comprised of like-charged particles that expand in three dimensions, which improves coverage uniformity and penetration into the canopy, but also causes droplets to expand up and out of the canopy. Air assist is used to propel them downward, but the turbulent 9.4 m/s windspeed seemed excessive, even for a dense carrot crop.
It is possible that focussing and reducing that airspeed may also reduce drift without compromising coverage. Presently, the air shear design of the Ecostatik’s MaxCharge nozzles prevent the operator from reducing the air speed without compromising spray quality. And, even if air speed could be reduced, the spray quality must remain Very Fine to achieve an optimal mass-to-charge ratio, and will therefore always carry an inherently high drift potential.
Thanks to Kevin Van der Kooi for spraying, and Laura Riches, Tamika Bishop, Terisa Set, Christine Dervaric, Claire Penstone and Aki Shimizu for sample collection. Special thanks to Cora Loucks for assistance with statistical analysis and Martin Brunelle of MS Gregson for providing the Ecostatik for evaluation.