Why aren’t there more air-assist boom sprayers in Canada? I can understand why field croppers might hesitate to pay for the feature because it’s only been in recent years that fungicide applications have become a regular part of their annual spray program. But, high-value horticultural muck crops like onion and carrot, or field vegetables like tomato and peppers have been a great fit for many years.
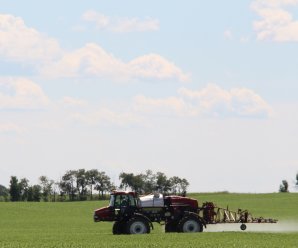
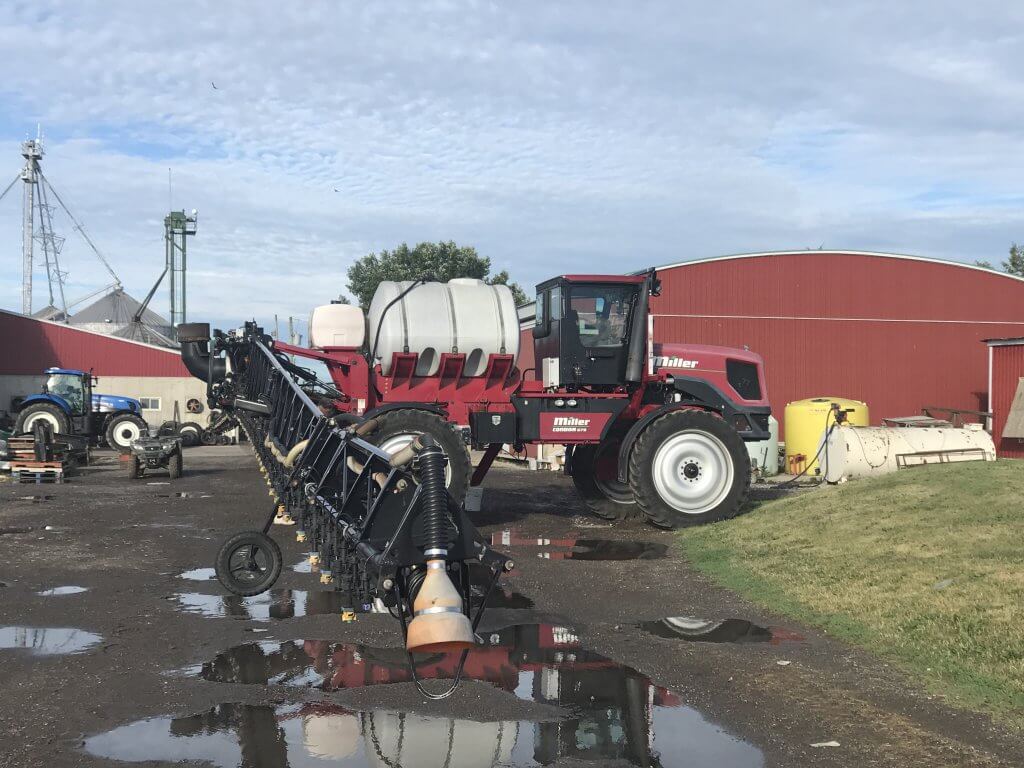
One operation near Dresden, Ontario was thinking the same way when they bought a used 2010 Miller Condor with a Spray-Air boom from Indiana. In the past, they employed a trailed Hardi sprayer applying 40 gpa using Turbo TeeJets alternating front-to-back in their field tomato and onion crops. They felt they could achieve better coverage with the air assist feature.
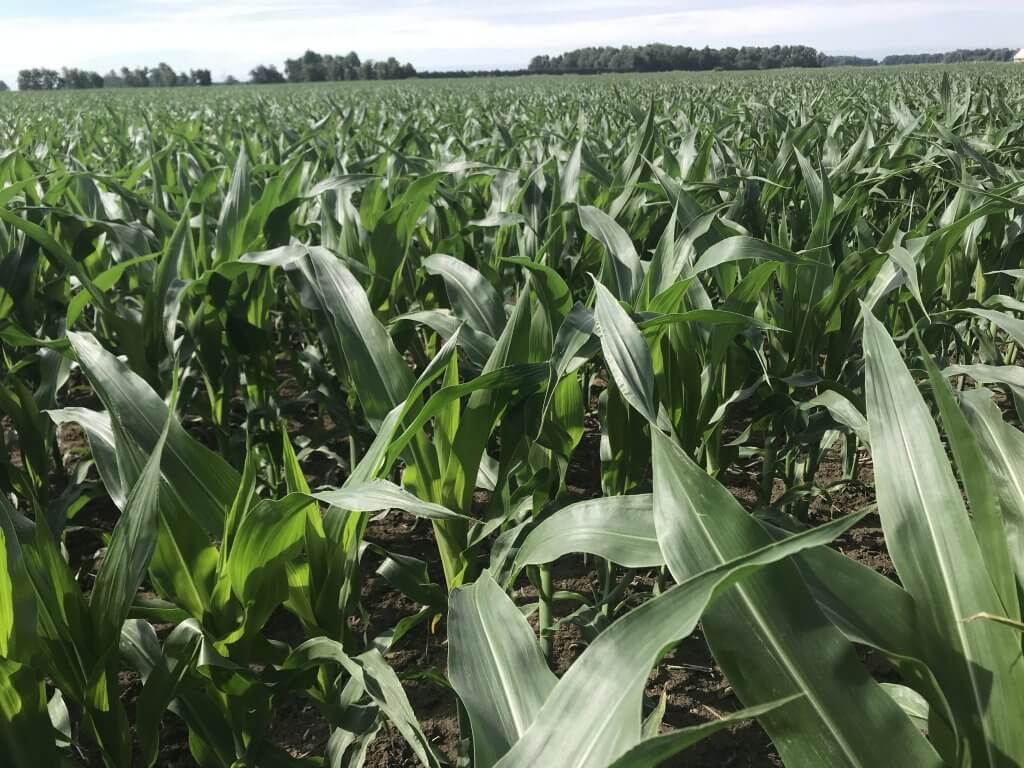
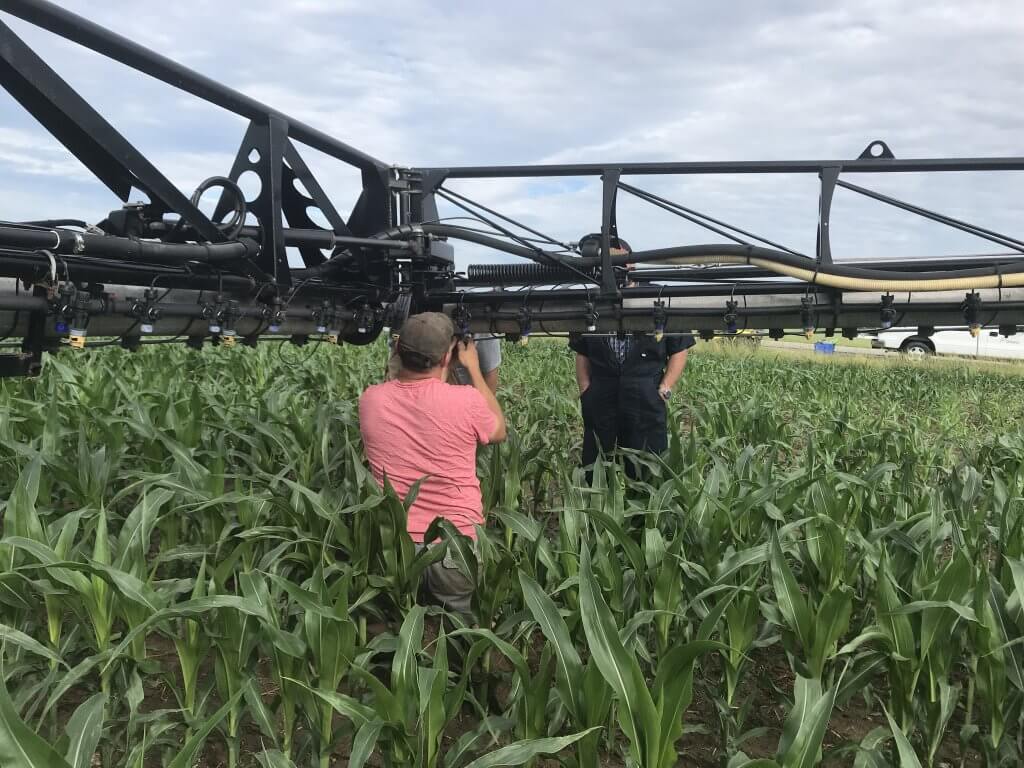
On June 19 the onion and tomato canopies were still too sparse to be a good testing ground (and the ground was very wet). So, we decided to run coverage trials in a stand of 3 foot high corn on 30 inch centres.
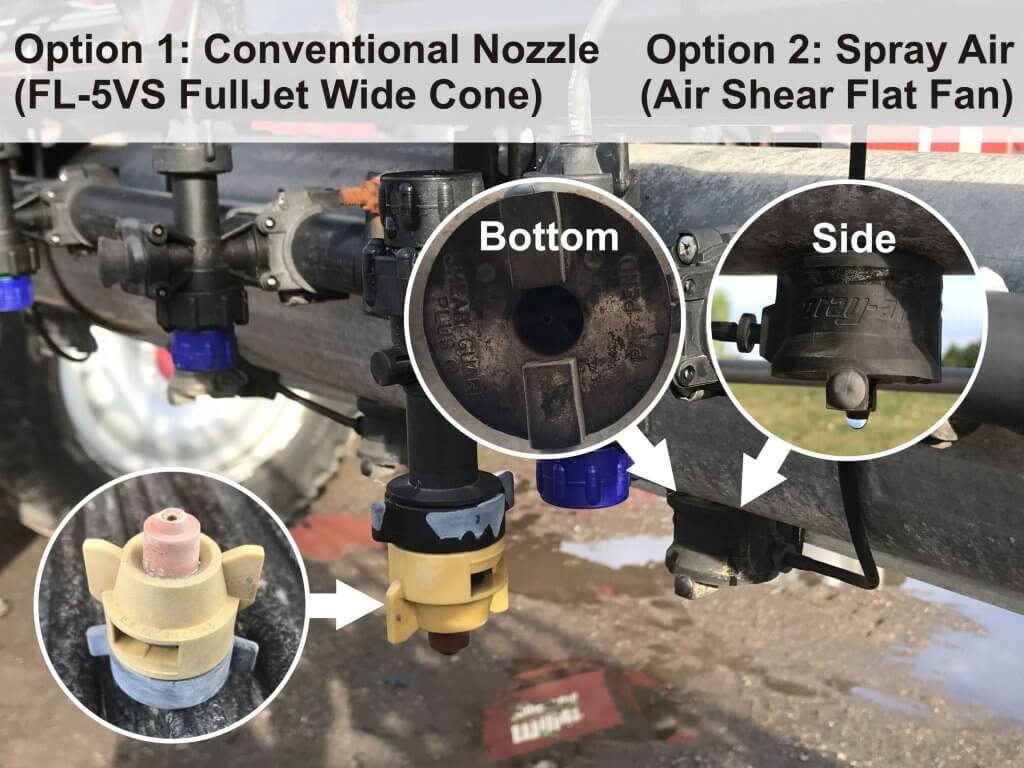
The Spray Air boom features a series of air shear nozzles on 10 inch centres. A liquid feed line meters spray mix to the orifice, where high-volume air is directed at the flow via two Cross-Flow jets. This shreds the liquid into spray and shapes a 60 inch flat fan pattern. The operator can select from a range of air speed/volume settings that affect spray quality (lower air means Coarser and fewer droplets and a smaller fan angle).
This particular boom also carried a set of hydraulic nozzles, so the operator could elect to turn off the Spray Air feature and employ a conventional application. This would be appropriate if applying a herbicide using air induction nozzles. In this case, the sprayer was equipped with TeeJet FullJet cones.
The first thing we noticed was that the air was not distributed evenly across the boom. We inspected the baffles that join each boom section, but found no problem.
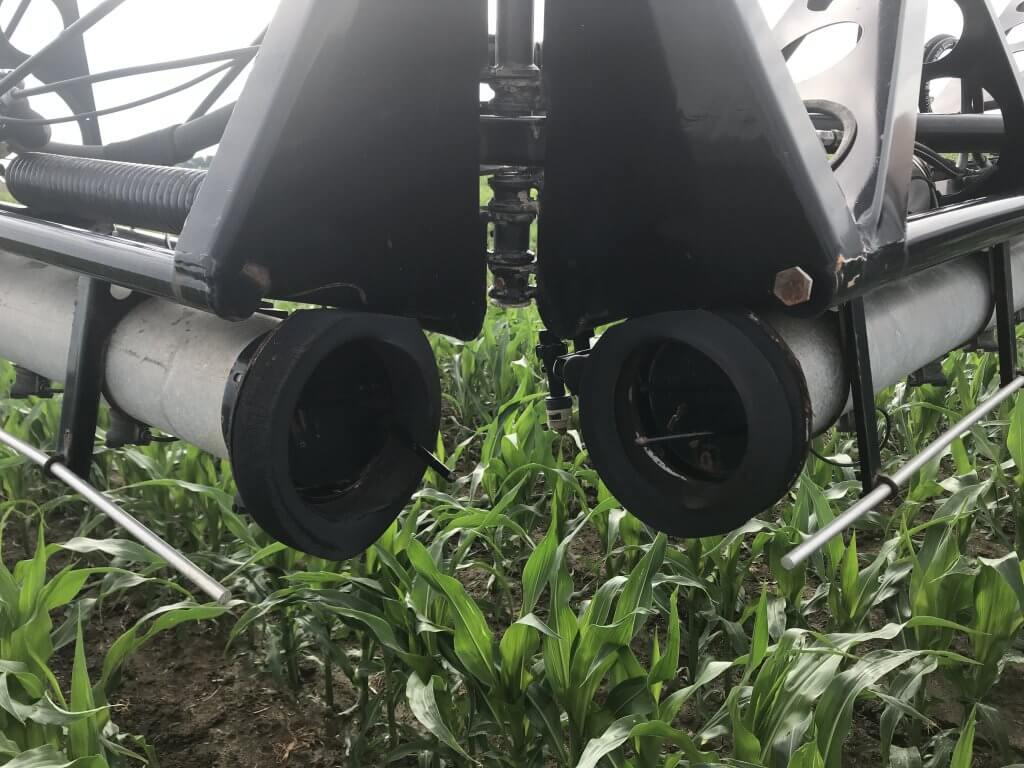
We then suspected the Spray Air combination nozzles might be occluded with debris (it did come all the way from Indiana). This turned out to be the case, so we popped them out and cleared the Cross Flow jets of any obstructions.
We then measured the air speed produced by the boom. A Pitot meter proved to be too finicky to get a consistent reading, so we used a Kestrel wind meter held 12 inches from the nozzle. The operator moved between the six air settings in the cab, producing the following air speeds. Note that these speeds were much slower than the 100+ mph (160+ km/h) speeds noted in the Miller brochure. The owner has since told me that they found a number of air leaks in the boom that they have been diligently repairing, and as a result he’s operating at a lower air setting.
| Air Setting | Approximate Airspeed at 12” |
| 1 | 4 mph (6.5 km/h) |
| 2 | 6.5 mph (10.5 km/h) |
| 3 | 8.5 mph (13.5 km/h) |
| 4 | 12.5 mph (20 km/h) |
| 5 | 15.5 mph (25 km/h) |
| 6 | 17.5 mph (28 km/h) |
We used water-sensitive paper wrapped around dowels to illustrate potential spray coverage.
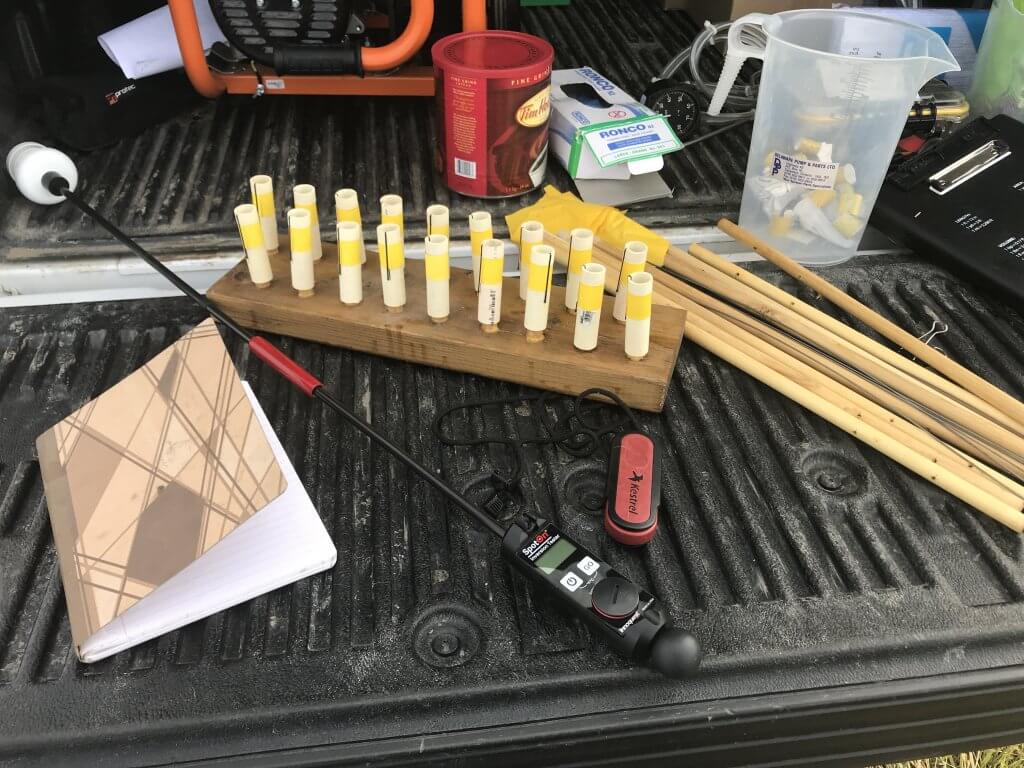
They were placed perpendicular to the spray at three depths in the corn canopy: High, Middle and Bottom. This provided an indication of panoramic coverage and represents a very difficult-to-wet target. In the last two trials, we also added a horizontal target at the Middle (not shown) and Bottom position to illustrate overall canopy penetration, and two at the High condition, angled at 45º into the sprayer’s path and 45º away from the sprayer’s path. These gave an indication of the highest potential coverage available to the canopy. Papers were later unfurled and digitally scanned. The papers were analyzed using DepositScan to determine the total percent coverage, and the droplet density.

Trials took place between 8:30 and 11:00. Temperature slowly climbed from 20ºC to 23ºC (~ 70ºF). Relative humidity dropped from 69% to 60%. With the exception of Trial 1, we sprayed in a tail wind of 7.5 mph (12 km/h) gusting up to 10 mph (16 km/h). Travel speed was 7 mph (11 km/h).
In the first five trials we made single, progressive adjustments to the spray settings that we assumed would improve coverage. Finally, we compared what we felt were optimal settings with the Spray Air (Trial 5) to optimal settings for the conventional hydraulic nozzles (Trial 6). Details are as follows:
| Trial | Air setting | Spray Volume (gpa) | Boom Height (inches) |
| 1 | 2 | 14 | 20 |
| 2 | 3.5 | 14 | 20 |
| 3 | 6 | 14 | 20 |
| 4 | 6 | 14 | 6 |
| 5 | 6 | 20 | 6 |
| 6 | No Air – Fullcones | 20 | 6 |
You can watch the passes in the following video. Note the boom height and the trailing spray.
The following two graphs show the coverage obtained in the High, Middle and Bottom positions for all six trials. The first graph is percent coverage, and the second is droplet density.
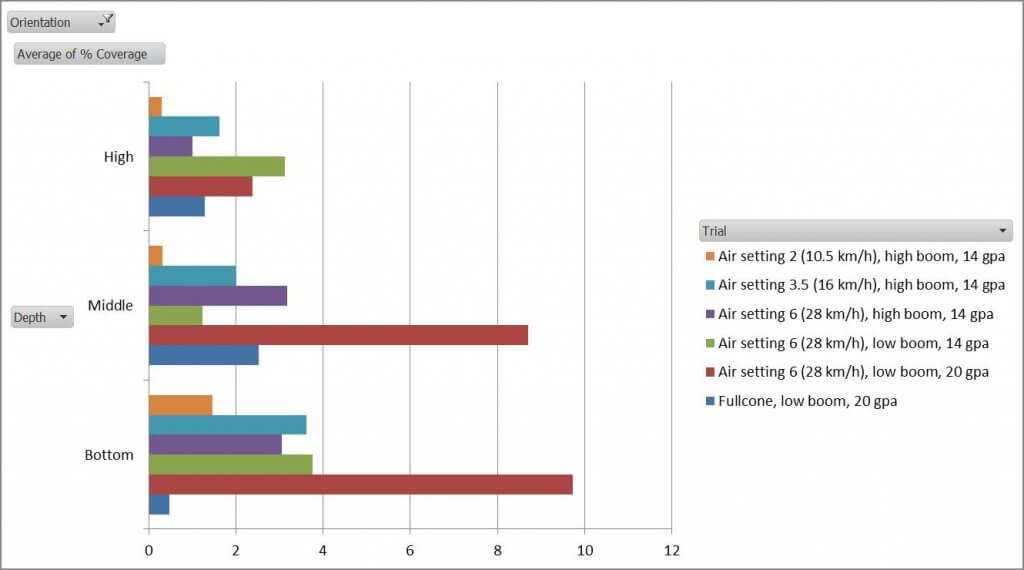
In trial 1 the air was insufficient to properly atomize the spray mix (as seen in the video) and this is evident in both graphs. By increasing the air in trials 2 and 3, we see that coverage increases in the High and Middle positions, but declines a little in the Bottom position. When we lower the boom closer to the canopy in Trial 4, we see increased coverage again in the High and Bottom positions, but lose ground in the Middle. We then increase our water volume for exceptional gains in the Middle and Bottom position, but at the expense of the High. Throughout these changes, overall coverage trended up. Finally, when we turn off the Spray Air system, and switch to the Fullcones, which were set to spray the same volume via the rate controller, there is a drastic reduction in coverage in all positions.
Let’s look at the additional papers placed for Trials 5 and 6 in the following graphs.
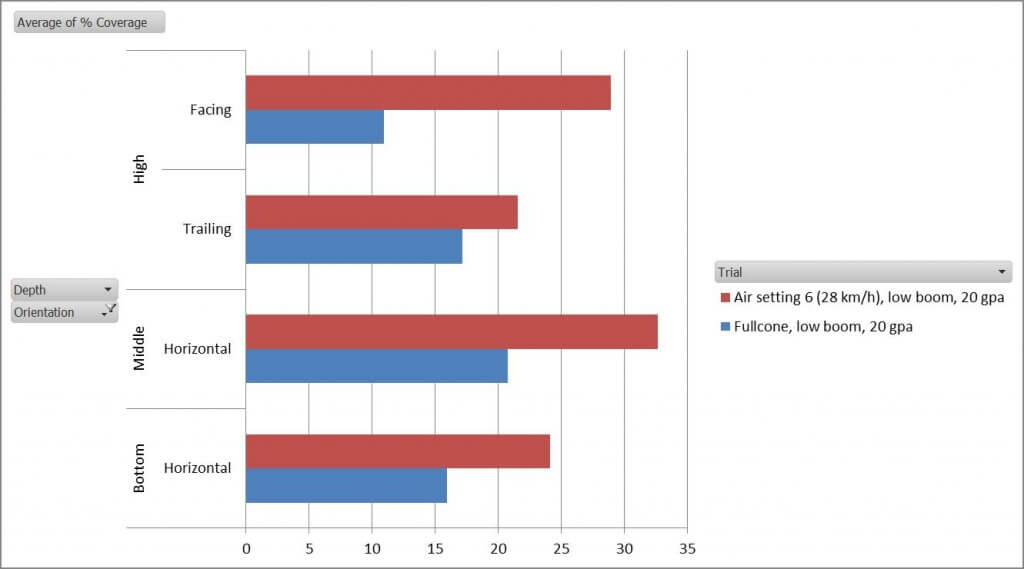
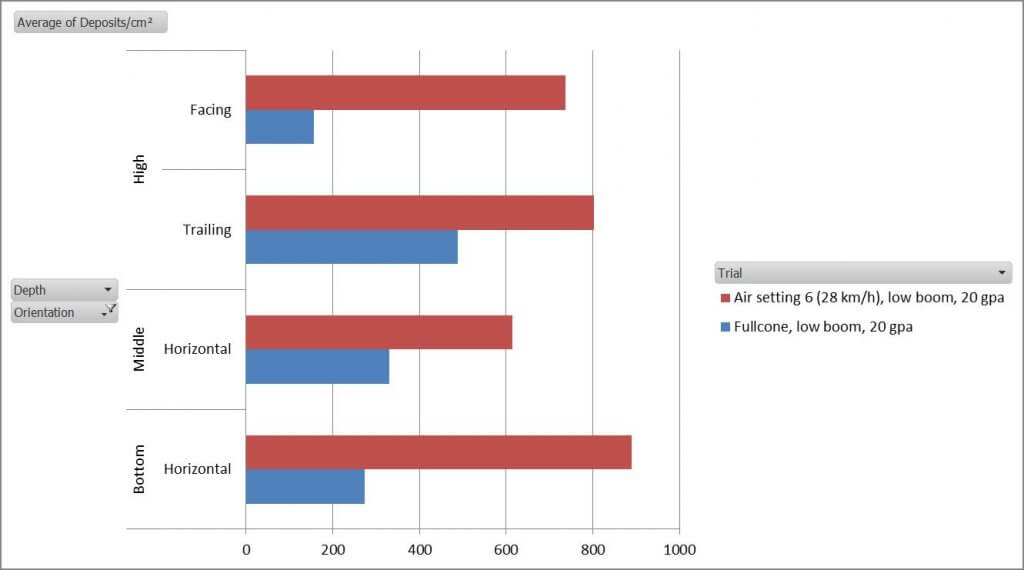
Even when papers were oriented to intercept the spray as much as possible, The Spray Air system provided superior coverage compared to the hydraulic nozzle.
This leads us to conclude that there is an advantage to air assist in overall coverage and canopy penetration. Further, it demonstrates that such a system requires careful calibration to ensure it is being used optimally. Water volume, air settings and travel speed should all be reconsidered when the environmental conditions change (e.g. temperature and wind) and when spraying different crops, at different stages of growth.
Two weeks after this trial, the corn grew too high for the Miller boom, but the grower moved into his onion and tomato and was very pleased with the overall coverage the Spray Air was providing. He’d also replaced the fullcones with 110 degree AI flat fans for herbicide spraying.
I’d like to see more air-assist booms in Canada.