Author: Tom Wolf

  • Do Labels Help us Apply Pesticides Properly?

    Do Labels Help us Apply Pesticides Properly?

    It happened three times this spring.  As is often the case, I was contacted by growers who wanted help with herbicide application.  In most of these calls, the discussion revolves around the proper choice of nozzles for a specific task, perhaps some questions on spray pressure, water volume and travel speed.

    But these three were different.  Instead of being seasoned applicators, all three were new to the business.  And more importantly, they had done their homework by looking at product labels before calling.

    Labels give us important information on product rates, crop and weed staging, mixing order, sprayer cleaning, and personal and environmental protection.  They’re very valuable there.  But they also provide application information, and that’s where the problems begin.

    Perseverance Required

    I have to commend my three clients:  they showed great tenacity by actually finding application information on a pesticide label in the first place.  This document is so mired in legalese protectionist language at the front that it discourages all but the most persistent.

    And often, the application information comes in several parts, interspersed among other information.  Mixing instructions.  A little later, application. Somewhere nearby, buffer zones.  Another paragraph for cleaning.  Rainfastness?  Keep looking.

    It forces the reader to skim through the document, hunting for relevant information.

    But once my clients found application instructions, they obviously questioned if they should believe it, or else they wouldn’t have called.  The application statements on many labels, simply put, are from long ago, and it’s obvious.

    Consider the following two label excerpts, the first from a product initially registered in the mid 1980s and still available, the second from one registered about 30 years later:

    1980s:

    Application should be made using a minimum of 55-110 litres of water per hectare, at a pressure of 275 kPa, or 310 kPa if using check valves, and at a ground speed of 6-8 kph.

    The use of 80° or 110° flat fan nozzles is recommended for optimum spray coverage.

    Do not use flood jet nozzles, controlled droplet application equipment or Sprafoil® equipment.

    Application of the spray at a 45° angle forward and higher water volumes will result in better spray coverage and penetration of the crop canopy.

    Uniform, thorough coverage is important to obtain consistent weed control. Higher water volumes should be used under dense crop and weed canopies to ensure thorough coverage of the target weeds.

    2010s:

    Apply in a spray volume of 46.8 – 93.5 L/ha unless otherwise specified in tankmix partner section of this label – at 207-345 kPa (30-50 PSI) pressure to ensure proper weed coverage.

    Flat fan nozzles of 80° or 110° are recommended for optimum coverage.

    Do not use floodjet or controlled droplet application equipment or Sprafoil® equipment.

    Nozzles may be oriented 45° forward to enhance crop penetration and to give better weed coverage.

    Uniform, thorough coverage is important to obtain consistent weed control. Higher water volumes should be used under dense crop and weed canopies to ensure thorough coverage of the target weeds.

    Thirty years apart, but remarkably similar.

    Crop protection companies spend about 10 yrs. and $250 million to produce a new pesticide and register it for use.  Having made this commitment, it would be most useful to see a small further investment to provide current application information that is relevant to applicators.

    After all, these applicators purchase the active ingredient to provide a return on this multi-million dollar investment, to the tune of about 2 billion dollars per year in Canada alone. They deserve good application information.

    Imagine this scene:

    “Doctor, thank you for this new high tech pharmaceutical engineered to help me with my serious illness.  How should I take it?”

    “Not sure.  Here, read this cough syrup label I found in my drawer.  Should be pretty close.”

    It’s clearly ridiculous

    Let’s dissect these labels to see how they could be improved.

    Flat fan nozzles of 80° or 110° are recommended for optimum coverage…

    Our sample labels refer to what we assume are conventional flat fan nozzles.  While popular in the 80s, these have all but disappeared from sprayers over the course of the past 20 years or so.  We haven’t recommended them since then because they drift too much. They’ve been replaced by low-drift nozzles, either pre-orifice, or air-induction.

    Nozzle fan angles are now generally 110 degrees or more, and frankly, the difference between 80 and 110 degrees is not that important.  What’s important is proper overlap, achievable with a visual assessment followed by boom height and pressure adjustments.  Unfortunately the label is silent on that.

    Application should be made … at a pressure of 275 kPa, or 310 kPa if using check valves…

    A nozzle’s recommended operating pressure depends on the specific nozzle model and on the spray quality (average droplet size) required. With literally many dozens of nozzles now available to each applicator, general pressure suggestions are likely to be wrong, and are more of a liability than a help. And they force label non-compliance when over-ruled by a nozzle manufacturer’s recommendations.

    Speaking of spray quality, growers crave to know at what spray quality a product should be applied for best performance and lowest drift. Some labels refer to spray quality (e.g. “apply with a Coarse spray”), but this is with reference to spray drift and buffer zone distances, not efficacy, and that distinction is not made.  Knowing the right quality for efficacy would help applicators choose the right nozzle and pressure to meet that criteria.

    Higher pressures if using check valves?  Nobody has brass screens with check valves anymore.  Sprayers have had modern diaphragm check valves for a generation, and those don’t produce pressure losses.

    And we all know that six to eight km/h is hardly a common speed these days.

    Do not use floodjet or controlled droplet application equipment or Sprafoil® equipment

    Sprafoil nozzles have not been produced in Canada for about 25 years, in fact their manufacturer is no longer in business.  Controlled droplet atomizers, while becoming more popular again on aircraft, were last seen on ground sprayers in the 1980s. Even then, total installed numbers were probably in the single digits.

    As for FloodJet nozzles, those went out of style for herbicides in the late 70s, and were replaced by the very successful TurboTeeJet nozzles shortly after.

    Nozzles may be oriented 45° forward…

    Nozzles are rarely tilted 45 degrees forward for herbicide application anymore.  Maybe that’s because spray booms aren’t built that way today, or because modern booms on self-propelled sprayers are now about 30” (75 cm) above ground, and we travel at about 15 mph (22 km/h).  So the forward tilting, though shown to be effective for grassy weeds at 5 mph (8 km/h) and 20” (50 cm) boom heights, as researched in the 1970s, isn’t relevant for herbicides with higher booms.

    Uniform, thorough coverage is important to obtain consistent weed control.

    Statements advocating for good coverage are nice, but they aren’t useful.  Everybody knows we want good coverage.  What applicators need to know is how they should measure coverage, and what good coverage actually is.  Can we use water-sensitive paper?  How much of the target should be covered?  How many droplets should be in each square centimetre?  How can we measure that in the field, right now? How does it depend on the crop canopy, on weed stage, and on spray quality? The more information an applicator gets, the higher the chance of success.

    Apply in a spray volume of 46.8 – 93.5 L/ha…

    The only statement that survives our little examination is about water volume. Water volume is important.  But even there we have a problem.  The volume is in L/ha.  This is useful in some parts of Canada, but not in the west, where producers communicate primarily in US gallons per acre.  And in the west, provincial guidelines have generated this odd hybrid of L/acre, which few people use for spray volume.  But 46.8 to 93.5 L/ha?  How is that level of precision justified? (I know that this is a conversion from 5 and 10 US gpa…so why not just say so?)

    A Solution

    The problem with having outdated or impractical information on labels is that it creates disrespect.  Since labels are documents enforceable by federal law, applicators want to comply. At this time, they can’t, and probably shouldn’t, if they want to do the job right.

    A vision for a good label should be one that respects the needs of the applicator.  Such a label:

    • places the information that applicators need at the top;
    • is updated regularly to reflect modern practice and useful advice;
    • helps a new applicator work out how to apply the product with any equipment;
    • identifies a spray quality that offers good coverage and low drift;
    • makes reference to research that supports variations in the application guidelines;
    • is available electronically, readable on a mobile device, i.e., not pdf.

    This label would protect the environment and bystanders, and would foster better pesticide performance.

    This label is easy to generate.

    This label would be read by applicators.

    What’s it going to take?

    Additional:

    This article created a great deal of discussion. We decided that if we were going to point out issues with the current labelling system, we should also propose a way forward. Read about our Label Summary Sheet proposal.

  • What is Delta T and why is it important for spraying?

    What is Delta T and why is it important for spraying?

    Click here to listen to Audio Article

    Humidity is important in spraying. With the average tank of pesticide being 90 to 99.5% water, evaporation plays an important role in both droplet size and active ingredient concentration. Low humidity causes droplets to evaporate faster, potentially increasing drift and reducing uptake. But relative humidity (RH) isn’t the best way to measure this effect because the same RH at two different temperatures results in two different water evaporation rates.

    Instead, we present Delta T, also known as “wet bulb depression”. Delta T is an atmospheric moisture parameter whose use in spraying has made its way to North America from Australian operations. It is defined as the dry bulb temperature minus the wet bulb temperature, and provides a better indication of water evaporation rate than RH. Higher Delta T means faster water evaporation.

    The recommendations from Australia are to avoid spraying when the Delta T is either too high or too low, with a range of two to eight being described as ideal.

    Figure 1: Delta T chart used in Australia (Source: Australian Gov’t Dept of Meteorology)

    Delta T is being reported on an increasing number of weather stations, and it’s time we took a closer look at what it means.

    Measuring Relative Humidity

    In the early days of weather reporting, relative humidity was calculated from psychrometric charts. All one needed was a hygrometer, usually a sling psychrometer. A sling psychrometer is two identical thermometers side by side whose bulbs could be slung in a circle, exposing them to moving air. One bulb was covered in a cotton wick moistened with distilled water, the other was left exposed and dry.

    Figure 2: Sling psychrometer (Source: ScienceStruck.com)

    As the bulbs met moving air, water evaporated from the cotton wick and that reduced the temperature of that thermometer. The dryer the air, the greater the evaporation rate and therefore the greater the temperature drop. The dry thermometer was unaffected by this movement.

    On measuring the wet and dry bulb temperature, one consulted a psychrometric chart. This chart converted the two temperatures to total water content in the air, compared it to total water-holding capacity, and expressed it as Relative Humidity. Psychrometric charts are useful for many other air parameters such as dew point, vapour pressure, or enthalpy. (Pause briefly to give thanks that we don’t need to know what enthalpy is.)

    Figure 3: Psychrometric Chart (Source: Carrier Corporation)

    Turns out that RH is a poor measure of water evaporation rate. An RH of 24% at 20 C has exactly the same evaporation rate as an RH of 44% at 35 C. That’s why Delta T is the preferred measurement: it’s linearly related to evaporation.

    Note: Modern electronic weather stations don’t need two thermometers to measure air moisture content, and use polymers whose capacitance or resistance changes with atmospheric moisture. Add an internal look-up table, and we have all the information we need.

    Pros and Cons of Water Evaporation

    It’s important to note that our Australian colleagues caution against spraying when water evaporation rate is both too high and too low.

    Too High:

    • Water evaporates rapidly, reducing droplet size and pre-disposing the smaller droplets to drift;
    • Deposited droplets dry quickly, reducing pesticide uptake which is more effective from a wet deposit.

    Too Low:

    • Water doesn’t evaporate, maintaining the smaller droplets in a liquid state. These small droplets are already drift prone, but are now more potent because of more effective uptake. Overnight conditions that are inverted are usually humid, adding to harm potential from the inversion.

    Delta T in North America

    The addition of this parameter to our spraying weather lexicon has been useful. But it’s important to understand the context in which it was developed to properly judge its suitability.

    Aussies started talking about Delta T because the use of finer sprays under the hot dry conditions found during their summer sprays resulted in significant evaporative losses, significantly greater drift potential, and potential reduction of product performance. The guidelines to avoid spraying when Delta T exceeds eight or ten originate there.

    A few changes have happened since these guidelines were developed. Over the past ten to 20 years, we’ve observed greater use of low-drift sprays, with the coarser sprays’ larger droplets resisting fast evaporation. In the past five to ten years, water volumes have increased due to our heavier reliance on fungicides, desiccants, and contact modes of action. Both of these developments have helped reduce the impact of a dry atmosphere. We simply can’t say if a Delta T of 10 is too high with these new application methods.

    Looking at it another way, if Delta T values are very high, increasing water volume and droplet size will mitigate that to some degree, as the Aussies state in their extension materials (linked earlier).

    Formulation

    Pesticide formulation can also play a role in evaporation. Once the water is gone, oily formulations may still have good uptake because the oily active ingredient stays dissolved in the oily solvents. This is both good and bad, helping on-target efficacy but also increasing the risk of more potent drift. Solutions, on the other hand, are more likely to leave their actives stranded on leaves as crystals once the water is gone.

    Bottom Line

    Delta T is definitely useful information when spraying. It will typically rise and fall with air temperature as the day proceeds, and it is wise to consider suspending operations when values are critical. Take note of the Delta T when spraying the same product throughout these hot days and learn from the experience. Remember, the atmosphere affects not just sprays but also plants and insects, and due to this complexity we may not be able to attribute success or failure to just one measurement.

  • Biobeds for Pesticide Waste Disposal

    Biobeds for Pesticide Waste Disposal

    One of the most challenging aspects of a spray operation is the disposal of leftovers or rinsate containing pesticides. Let’s be honest, too much of it is drained onto the ground in a corner of the yard or the field. Nobody’s happy about that, nobody’s proud of it, but what are the alternatives?

    Waste disposal is a skeleton in the closet of the pesticide industry. One of the problems is the time-consuming nature of sprayer cleaning, and the lack of clear guidelines on product labels that pass the buck.  Too often, the applicator is asked to “act in accordance with provincial or state guidelines”, which is essentially a dead end.

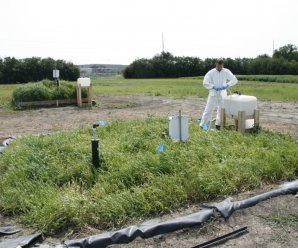
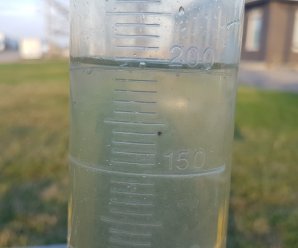
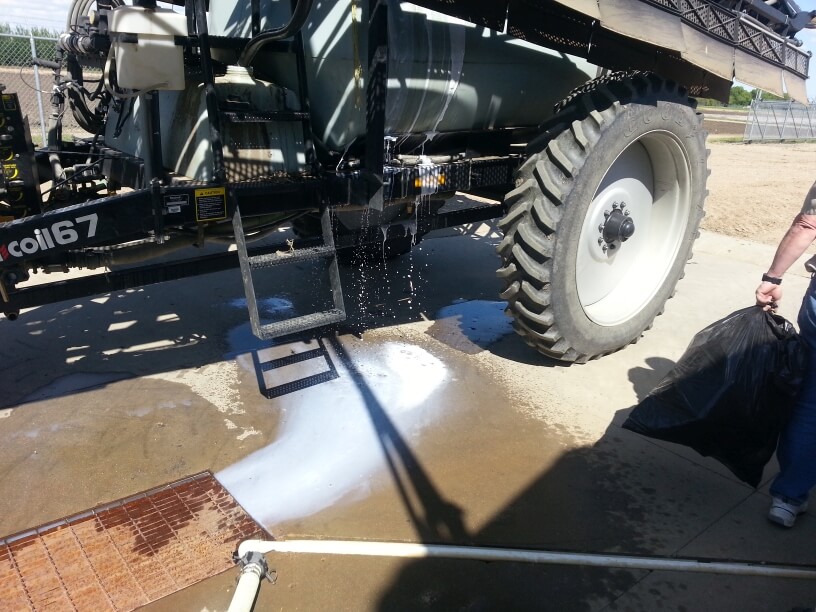
    Figure 1: Sprayer fill station

    At Sprayers101.com, we’ve tried to tackle the problem by finding ways to generate less waste (Express End Caps, Accu-Volume), by disposing of the rinsate by spraying it out, or by installing an efficient continuous rinsing system. We’d now like to talk about another component, biobeds.

    What is a biobed?

    Simply put, a biobed is a place where it’s safe and acceptable to dump dilute pesticide waste. First implemented in Sweden about 20 years ago, a biobed typically consists of a 1-m deep pit measuring about 3 m x 6 m or so. The pit is filled with a biomix, a mixture of cereal straw, compost or peat, and soil. The biomix, when properly prepared, acts to absorb a large amount of moisture, adsorb the pesticide molecules, and provide an environment in which microbes break down the residues.

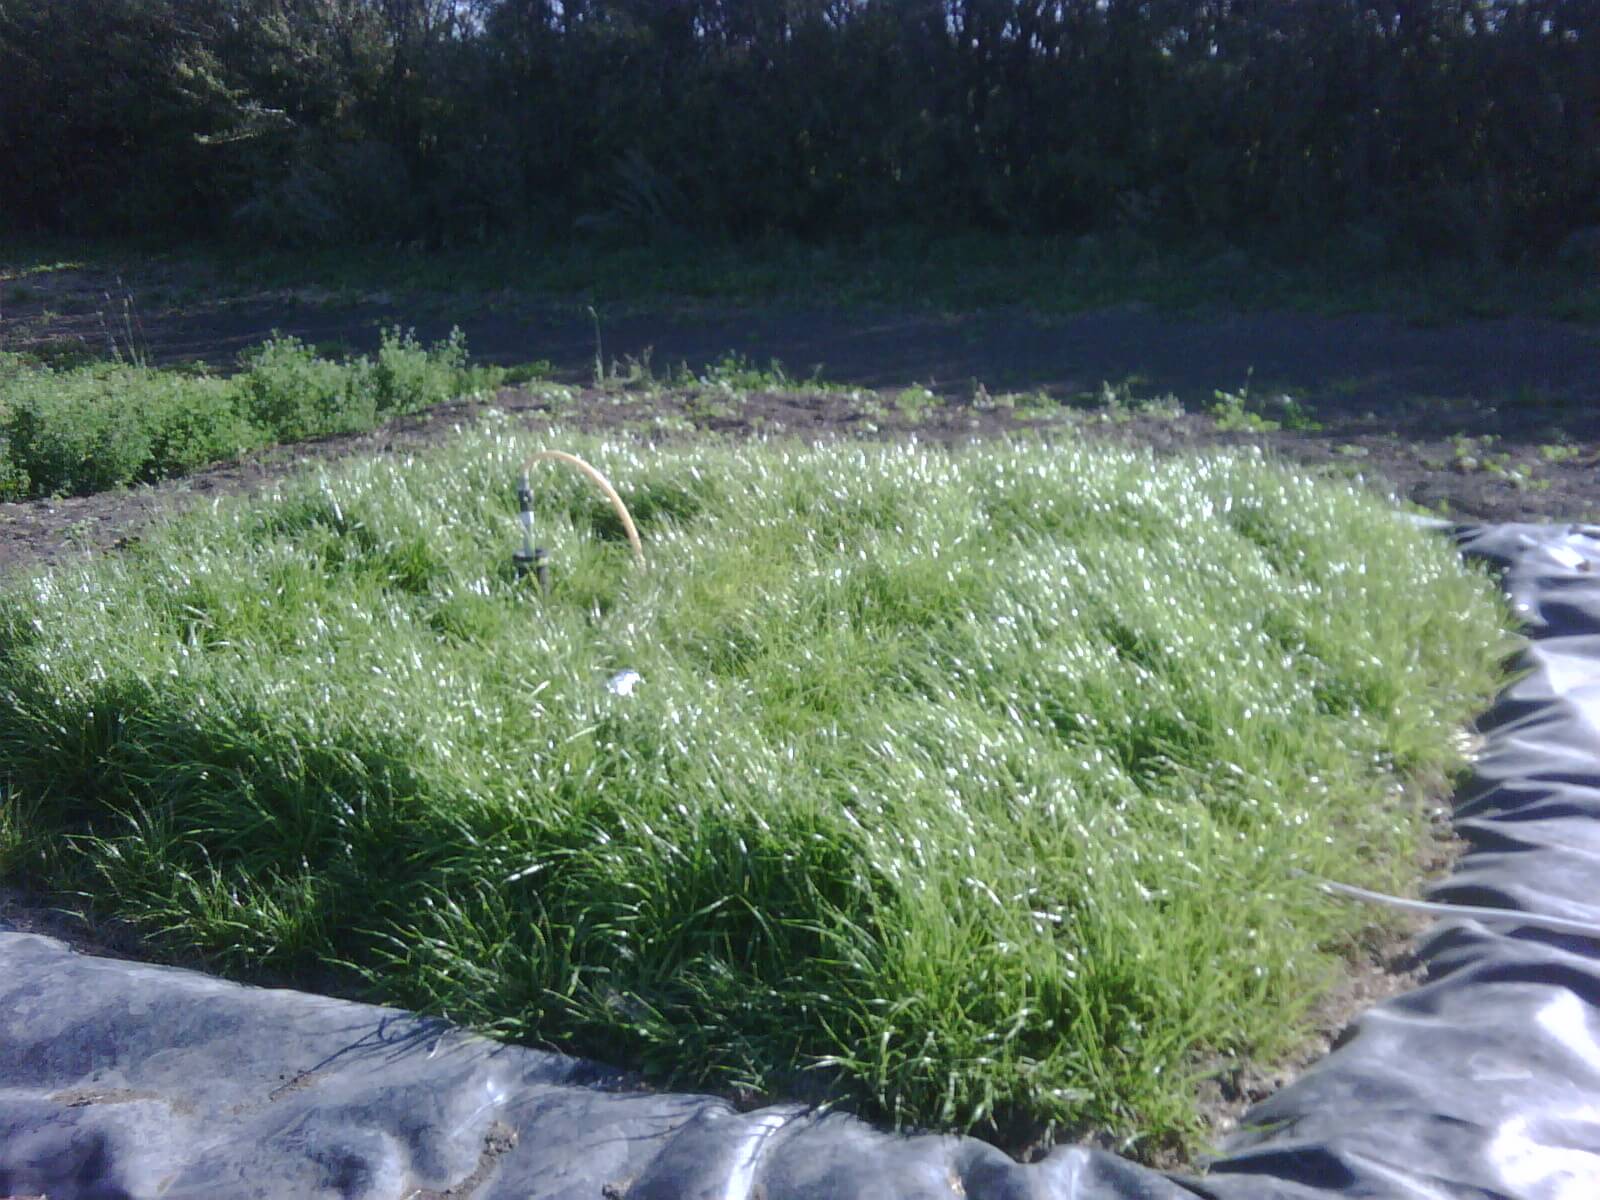
    Figure 2: Canada’s first commercial biobed installation at Indian Head, SK, 2009 (Source: Murray Belyk, Bayer CropScience (retired)).

    The effluent from a properly constructed biobed system contains 90 to 99% less pesticide than what was introduced, depending on the pesticide.

    Biobeds have been extensively studied and are now found throughout Europe and many parts of Central and South America. Canada currently has 6 research biobed sites in the West, and a further 17 in Quebec. The systems have been researched by Agriculture & Agri-Food Canada (AAFC) in recent years, with promising results.

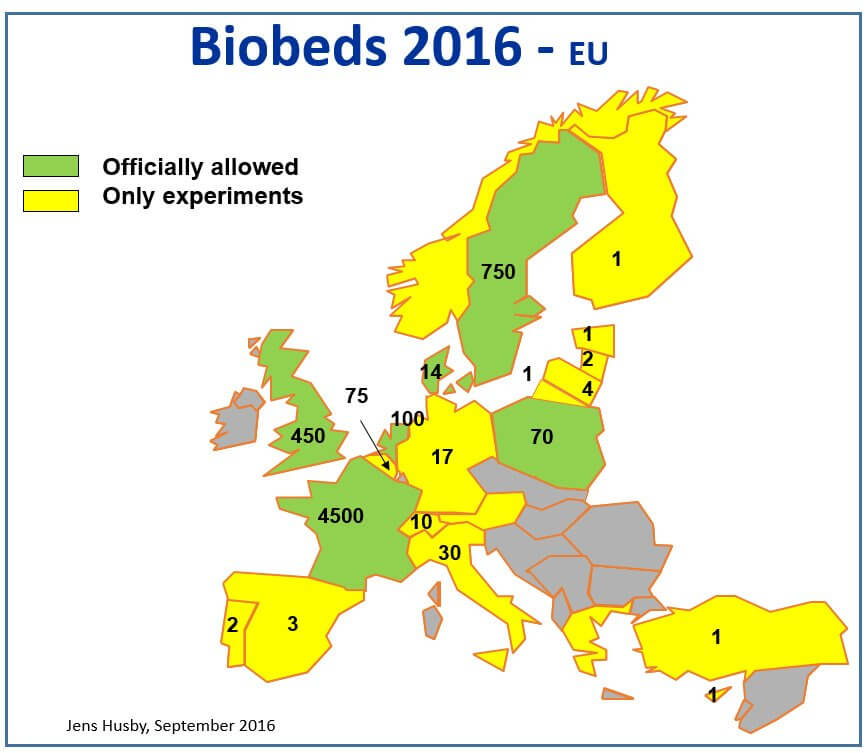
    Figure 3: European biobed installations, 2016 (Source: Jens Husby, Biobeds.org).

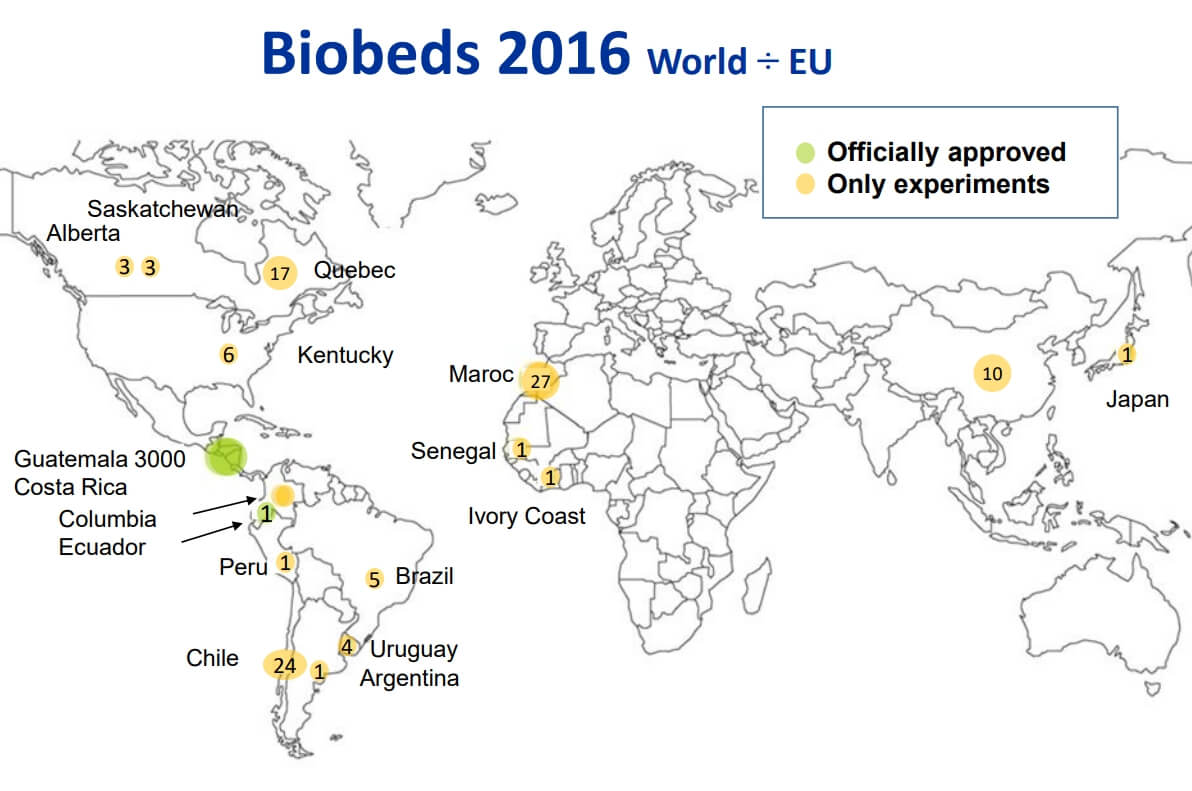
    Figure 4: Global biobed installations, 2016 (Source: Jens Husby, Biobeds.org).

    Constructing a biobed

    There are many possible variations of biobeds, some relatively simple and others engineered to address certain specific needs. A great deal of creativity can be used to customize a biobed for any operation.

    A simple biobed

    The following is a variation of the simplest biobeds, and these are the types first tested by AAFC in Saskatoon and Indian Head, Saskatchewan about 10 years ago. This design is based on the biobeds established in Sweden and the UK, and is a good way to learn about the system.

    Note that this biobed has an impermeable liner, so it’s a closed system. Excess water that leaches to the bottom must be removed and cycled back to the top of the biobed.

    • Create the biomix by blending two parts, by volume, chopped cereal straw or wood chips (not cedar), one part mature plant-sourced compost or peat and one part relatively coarse-textured soil (for optimal drainage). Add water as necessary as if making compost. Allow to sit for four to six weeks.

    Figure 5: Biomix preparation.

    • During this waiting time, the biomix will warm and form a white-mold complex. This is the microbial basis for its ability to break down pesticide residues. White mold will be visible on the cellulose portions of the biomix.

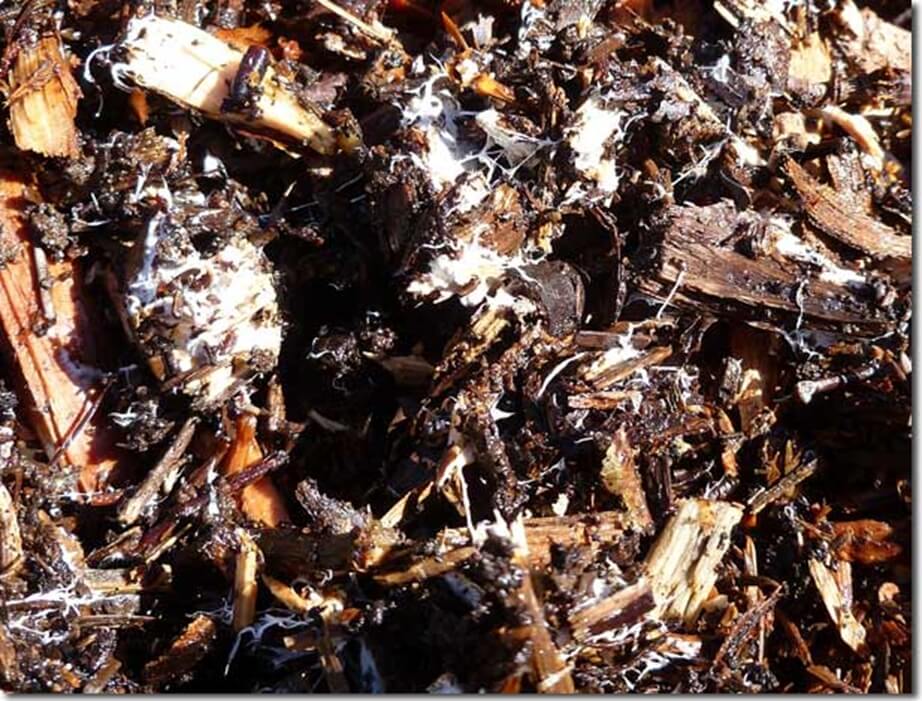
    Figure 6: white mold (Source: AAFC).

    • Identify a well-drained site easily accessible by spray equipment. Avoid low spots as water management becomes problematic.

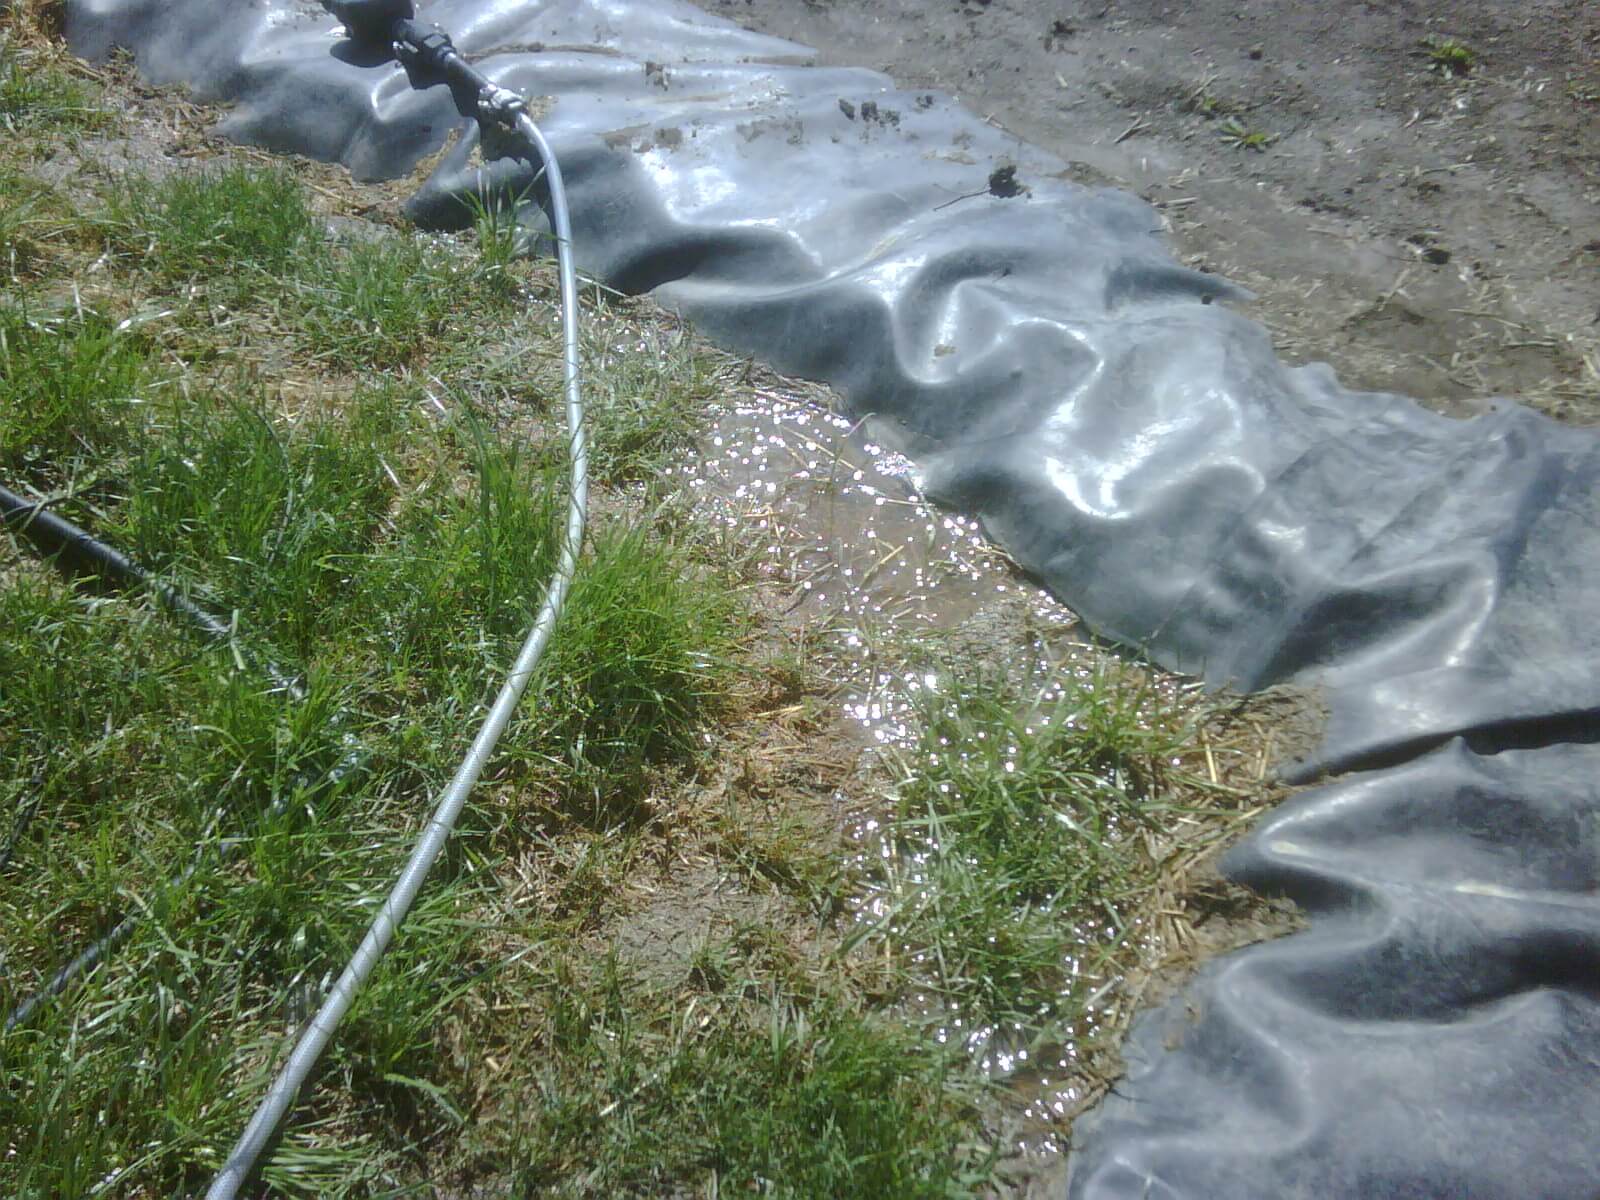
    Figure 7: Site selection and/or biobed covering are essential to avoid waterlogging (Source: Murray Belyk, Bayer CropScience (retired)).

    • Dig a pit sized to suit your requirements. As a rule of thumb, 1 m3 can process about 1000 L of liquid in a season. Rainfall is included in this amount.

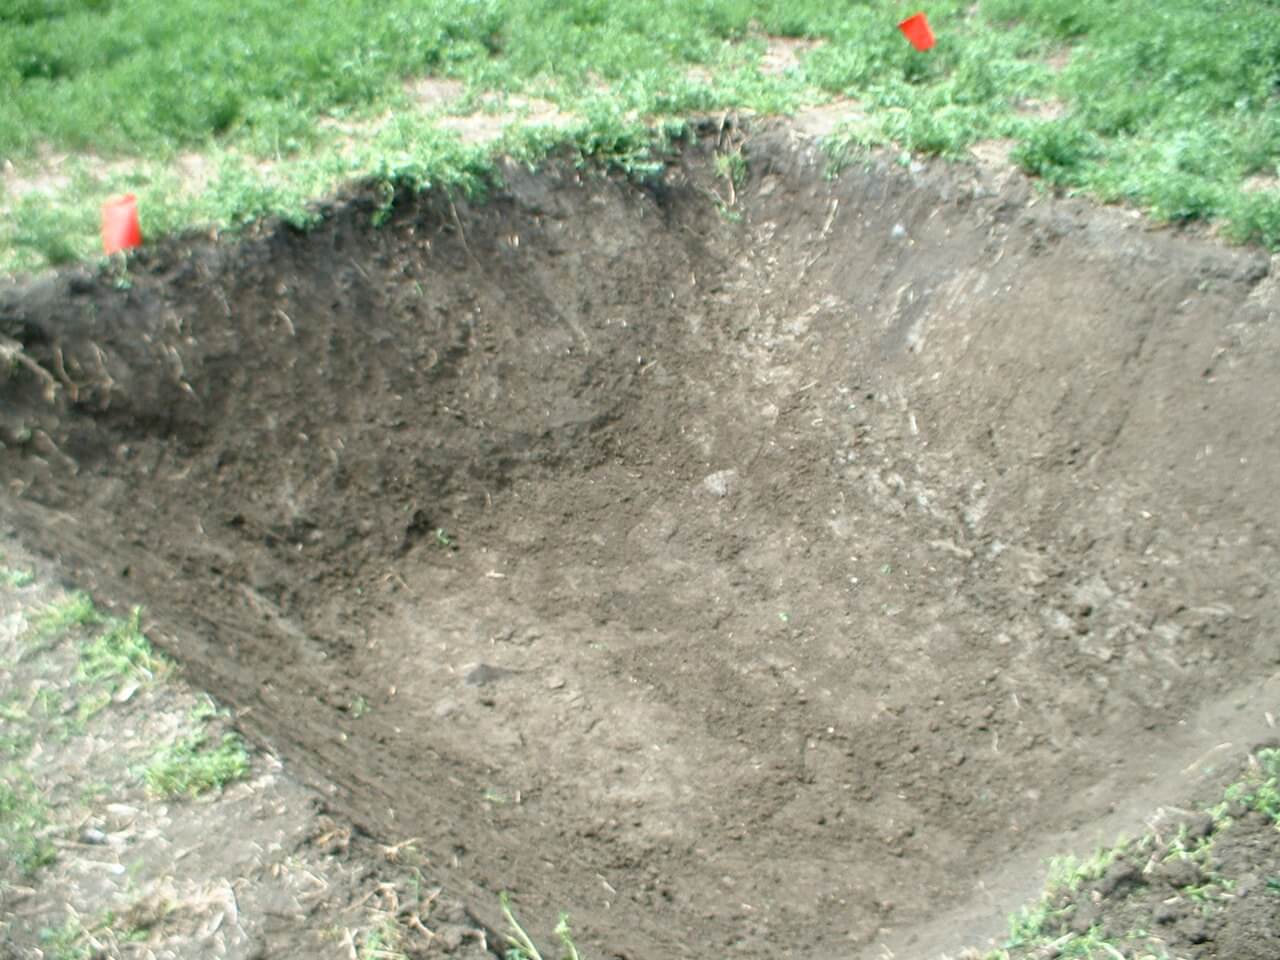
    Figure 8: A nice looking pit.

    • Line the pit with a geomembrane liner. 40 mil is plenty thick; any thicker and it gets hard to handle. Include a raised berm at the edge.

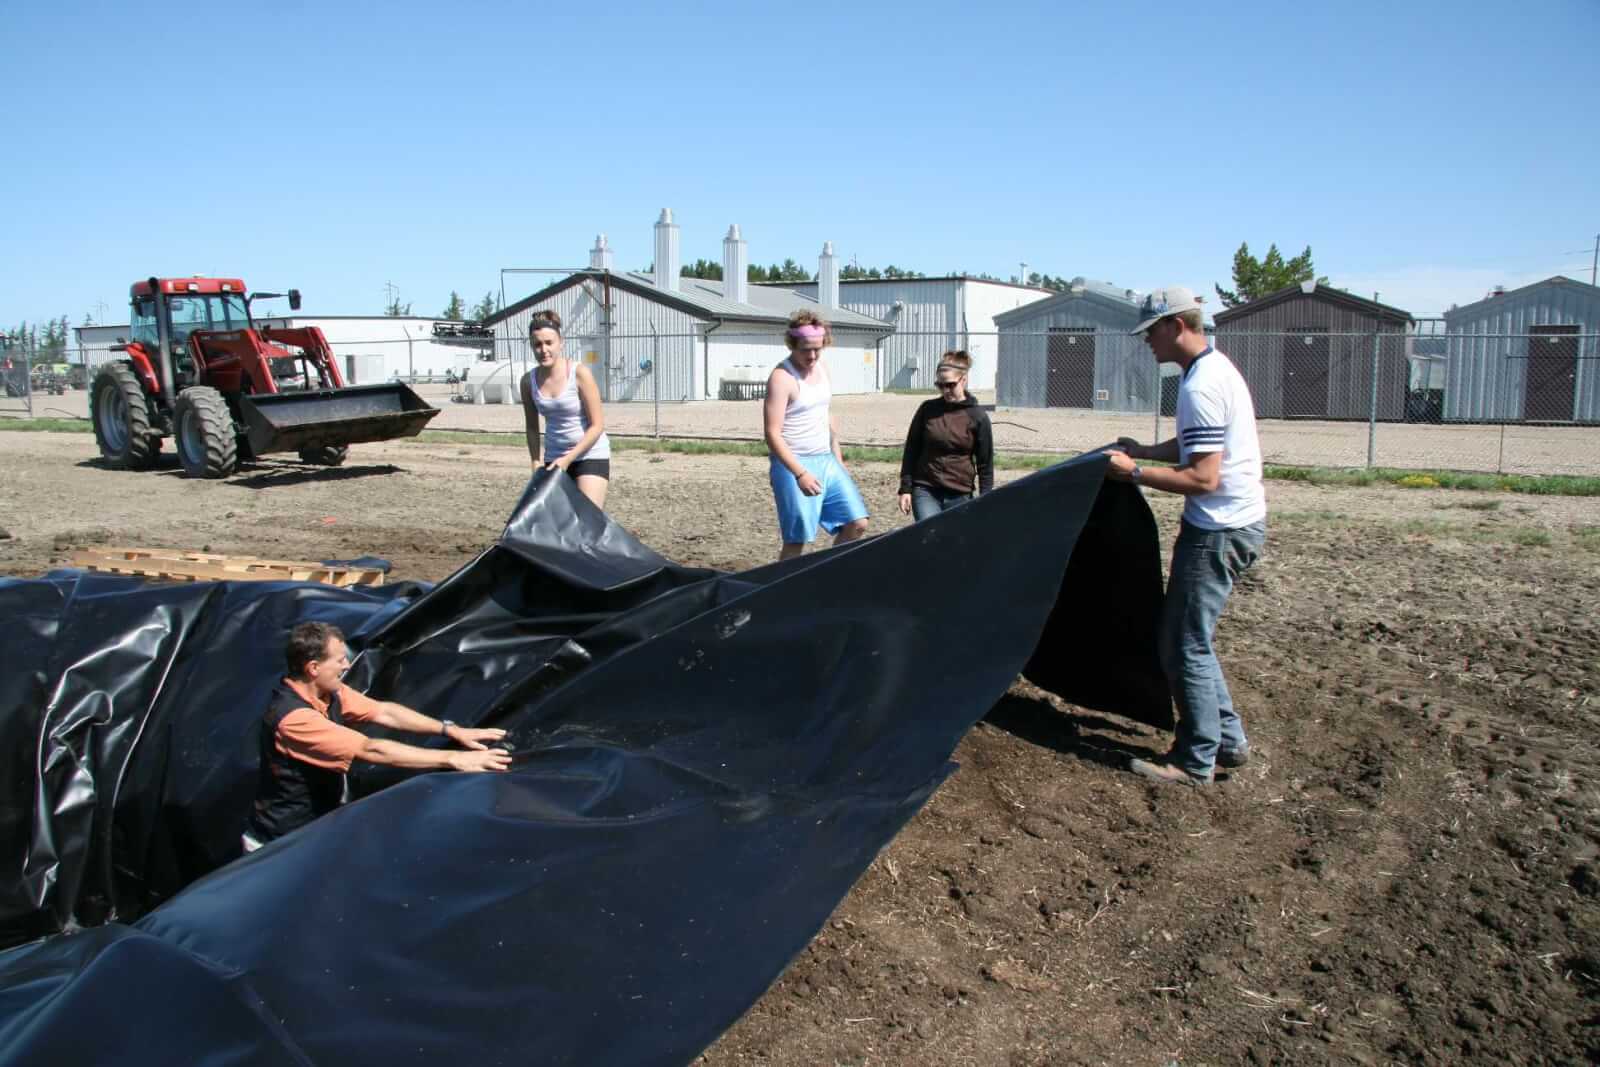
    Figure 9: Liner creates a closed system that will require a way to remove leached water.

    • Install weeping tile at bottom of pit, and extend it to ground level. This will be useful to determine water status and remove water if necessary.

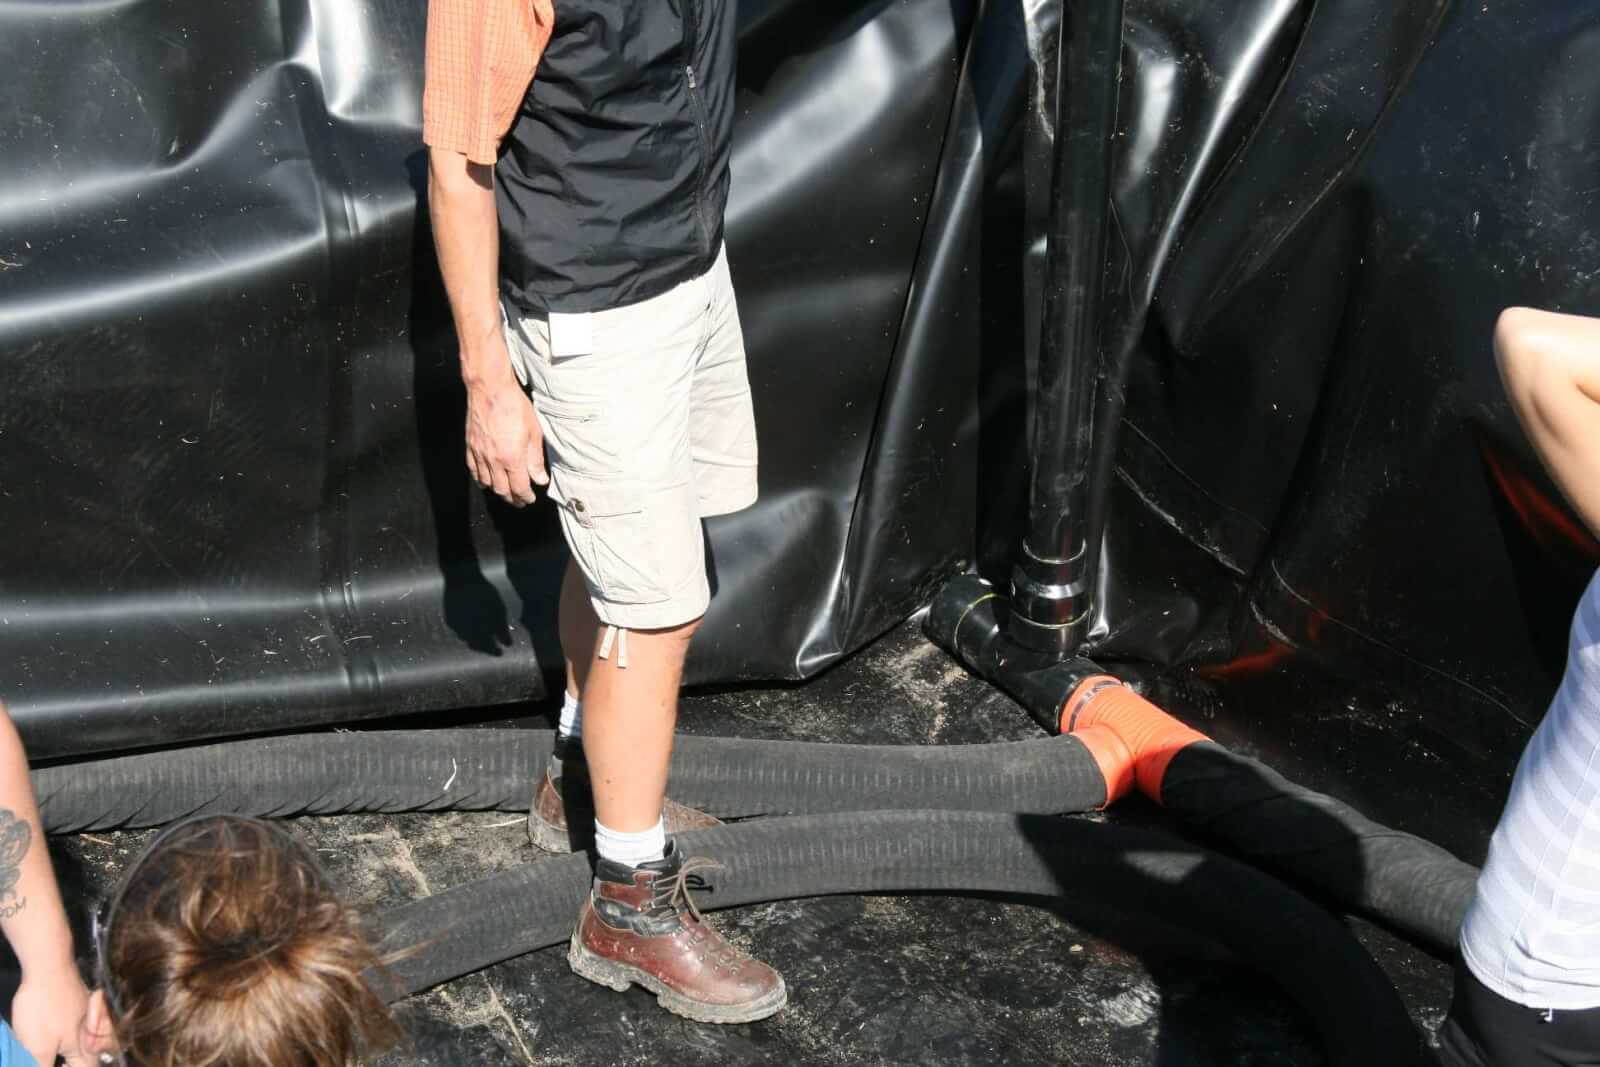
    Figure 10: Weeping tile to collect excess water.

    • Cover weeping tile with pea gravel and a silt trap. This serves to make leached water freely available for removal.

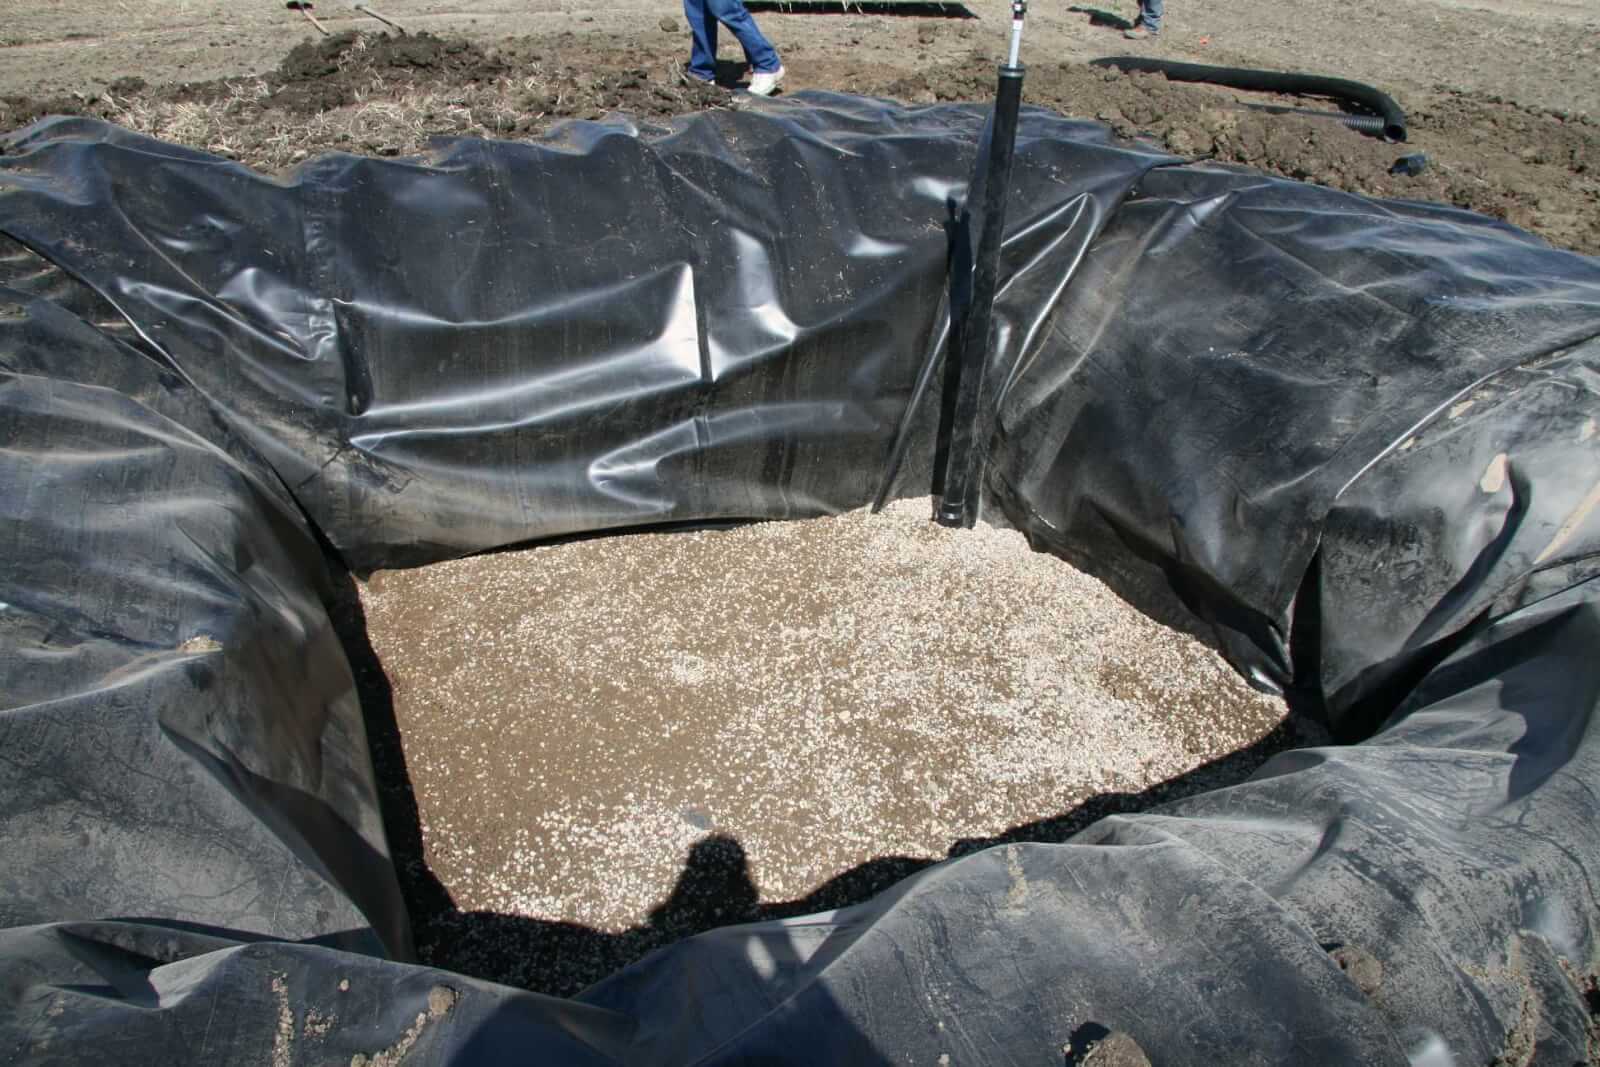
    Figure 11: Pea gravel over weeping tile.

    • Fill pit with biomix, anticipating significant settling. Top up as necessary over next few weeks. Use extra biomix to create a slope away from berm.

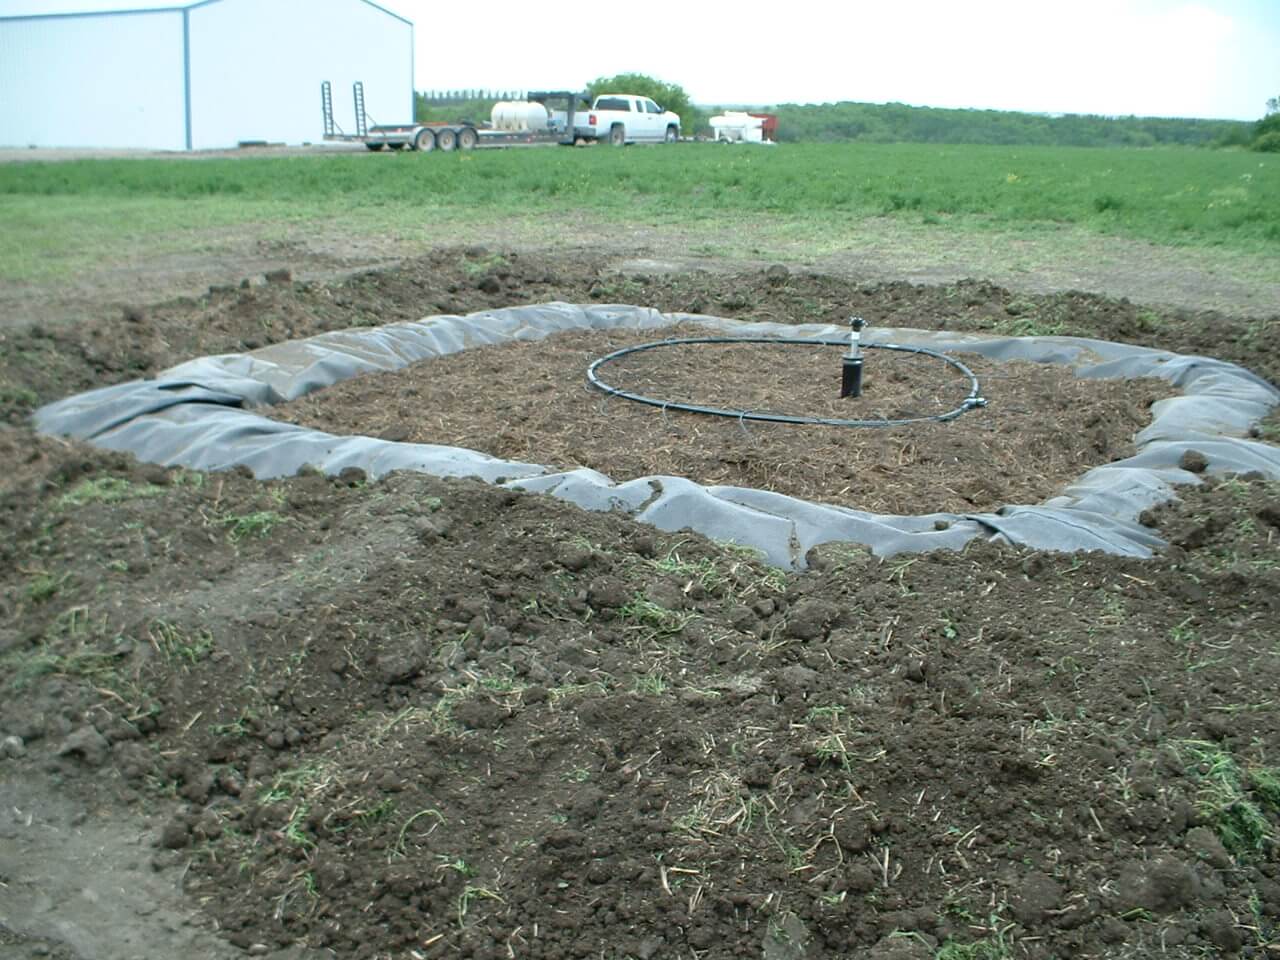
    Figure 12: Filled biobed.

    • Establish a bromegrass cover by transplanting or sodding. This is an important way to remove excess water via evapotranspiration.

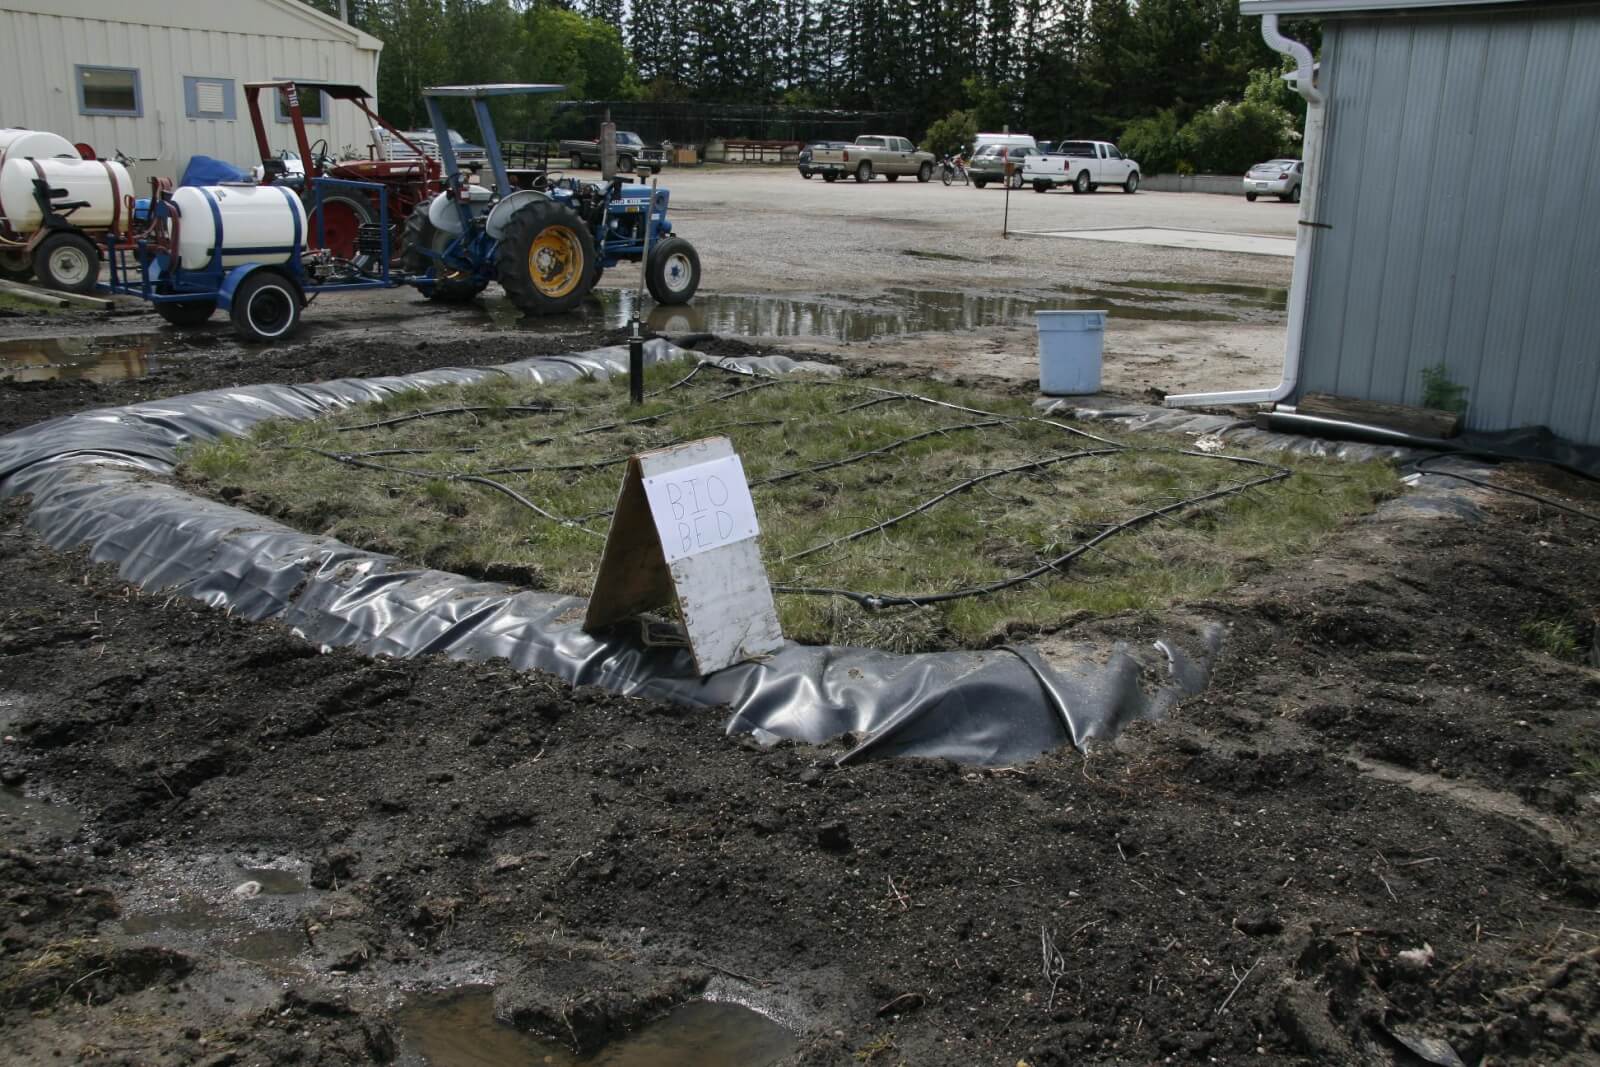
    Figure 13: Early sod growth on biobed at Indian Head, SK.

    • Introduce pesticide waste to biobed, managing moisture content to avoid waterlogging.

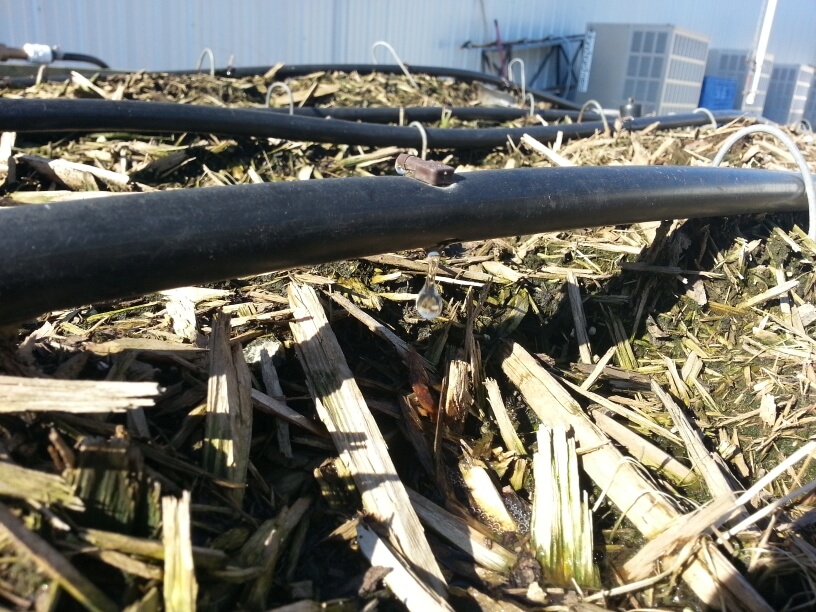
    Figure 14:  Pesticide waste entering biobed via drip irrigation.

    Introduction of pesticide waste to the biobed

    Moving pesticide waste from the sprayer to the biobed should be easy and trouble free. A simple pad built beside biobeds, either sealed with concrete or asphalt, or with a hardy geomembrane liner, works well. The sprayer is cleaned on this pad and rinsate flows into a drain. A sump pump lifts the rinsate to a storage tank from which it is introduced via gravity or pumped drip irrigation.

    Figure 15: Biobed system in Simpson, SK. Rinsate from sprayer is collected in a sump, which is pumped to the black storage tank in background. Rinsate is introduced into biobed (blue tub) as needed (Brian Caldwell in foreground, left, Larry Braul, right).

    When not in use, the sump drains freely to dispose of rain water.

    Others choose to pump or dump rinsate directly into a holding tank, from where it can be pumped onto the biobed.

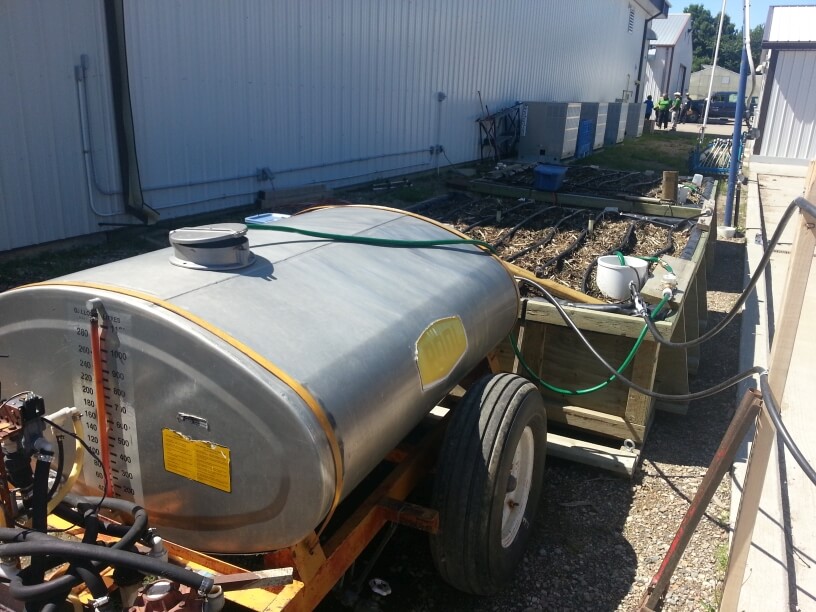
    Figure 16: Holding tank at biobed in Outlook, SK.

    Some European systems include driving supports on the biobed so the sprayer can be parked directly over top.

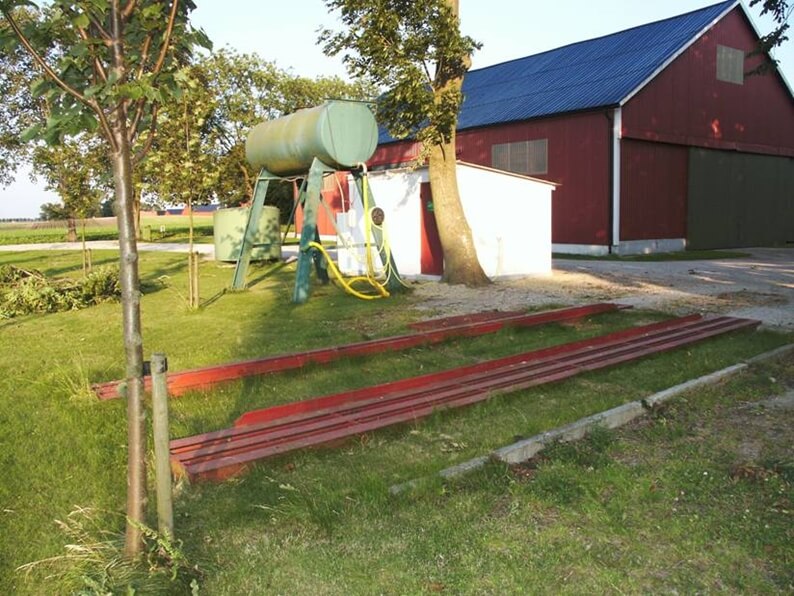
    Figure 17: Steel beams can allow (light) sprayer access (Source: Eskil Nilsson via Biobeds.org).

    A two-stage biobed

    The same basic building principles apply as in the original simple biobed. However, instead of reintroducing the effluent to the top of the biomix as it collects on the bottom, it is instead pumped onto a second biobed. This biobed then degrades any remaining product. This system is more efficient at degrading persistent products, and allows for better water management.

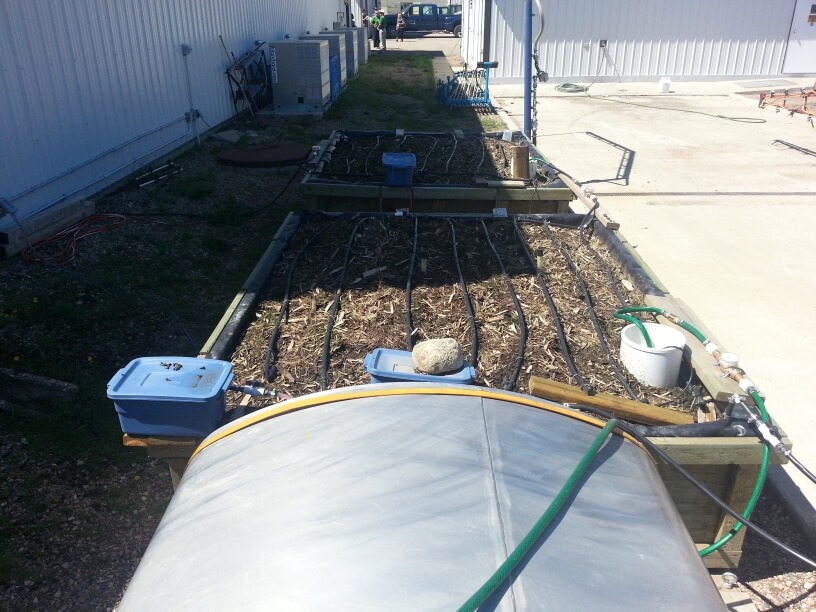
    Figure 18: Two-stage biobed system at Outlook, SK.

    The principle has proven effective, helping degrade more difficult pesticides to acceptable levels.

    Above-ground biobeds

    One of the problems with below-ground biobeds in wet climates is the difficulty managing water. Above-ground biobeds can address this issue by eliminating the possibility of surface runoff being added to the biomix. Adding a rain cover would also be easier and more effective.

    Above-ground biobeds can be edged with plywood, or placed entirely into plastic tanks whose tops have been removed.

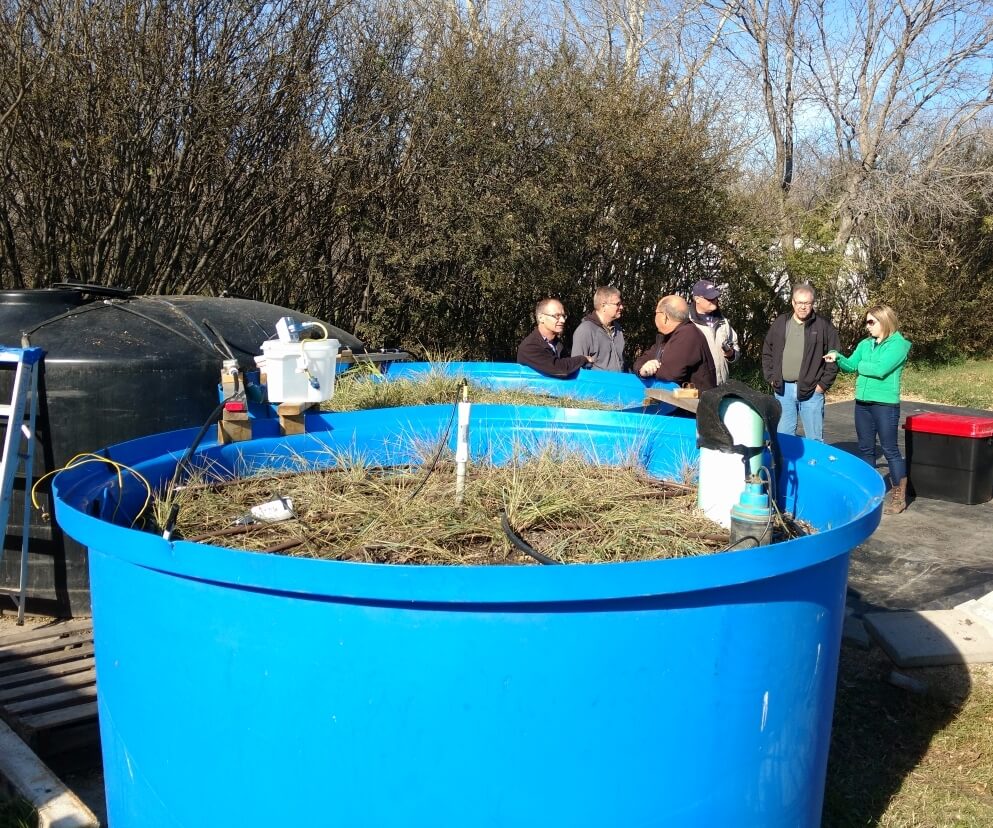
    Figure 19: Above ground biobed installation with plastic tub.

    One potential problem with above-ground biobeds is the later spring warming of this installation compared to below-ground types. Cold temperature reduces the effectiveness of biobeds due to the reliance on microbial activity. Heat tape has been tested by AAFC and shown to be very effective at warming the biomix and stimulating initial microbial activity. Passive solar systems have also been studied but are more difficult to install.

    Figure 20: Heat tape (Source: AAFC).

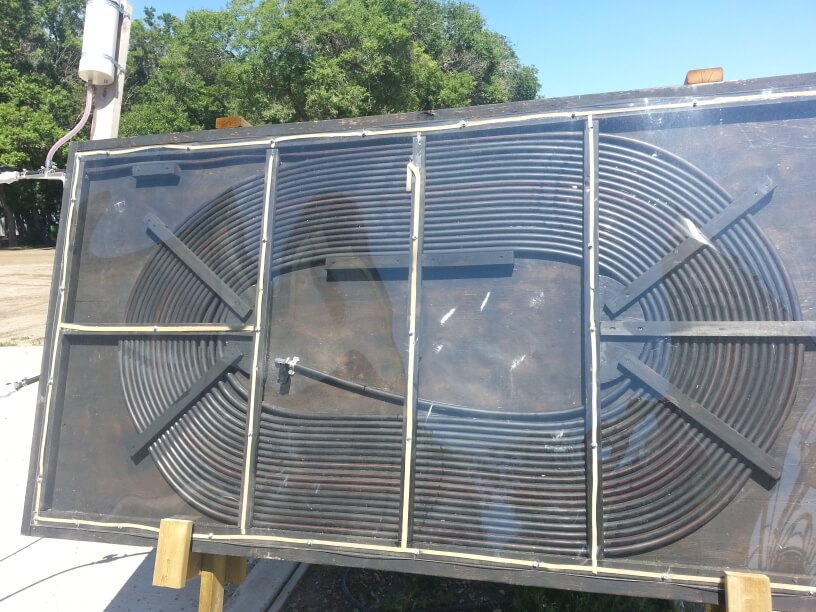
    Figure 21: Passive solar biomix heating system.

    Phytobac and Biofilters

    European designs have utilized plastic containers to form of various designs, including the commercial “Phytobac” systems from France and developed with the support of Bayer CropScience.

    Sequential biofilters have also been implemented. The leachate simply migrates through the biomix into the next container below. Eventually, adjacent biofilters containing plants act to remove the moisture.

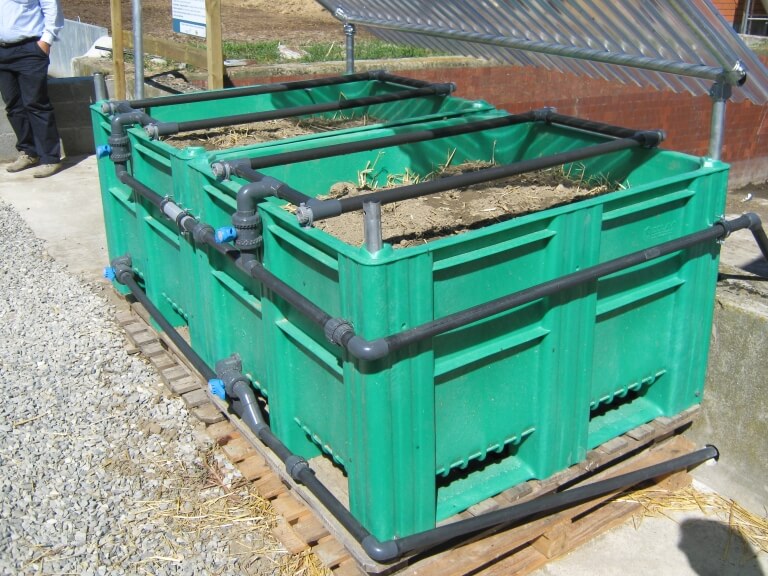
    Figure 22: Phytobac installation, cross-section.

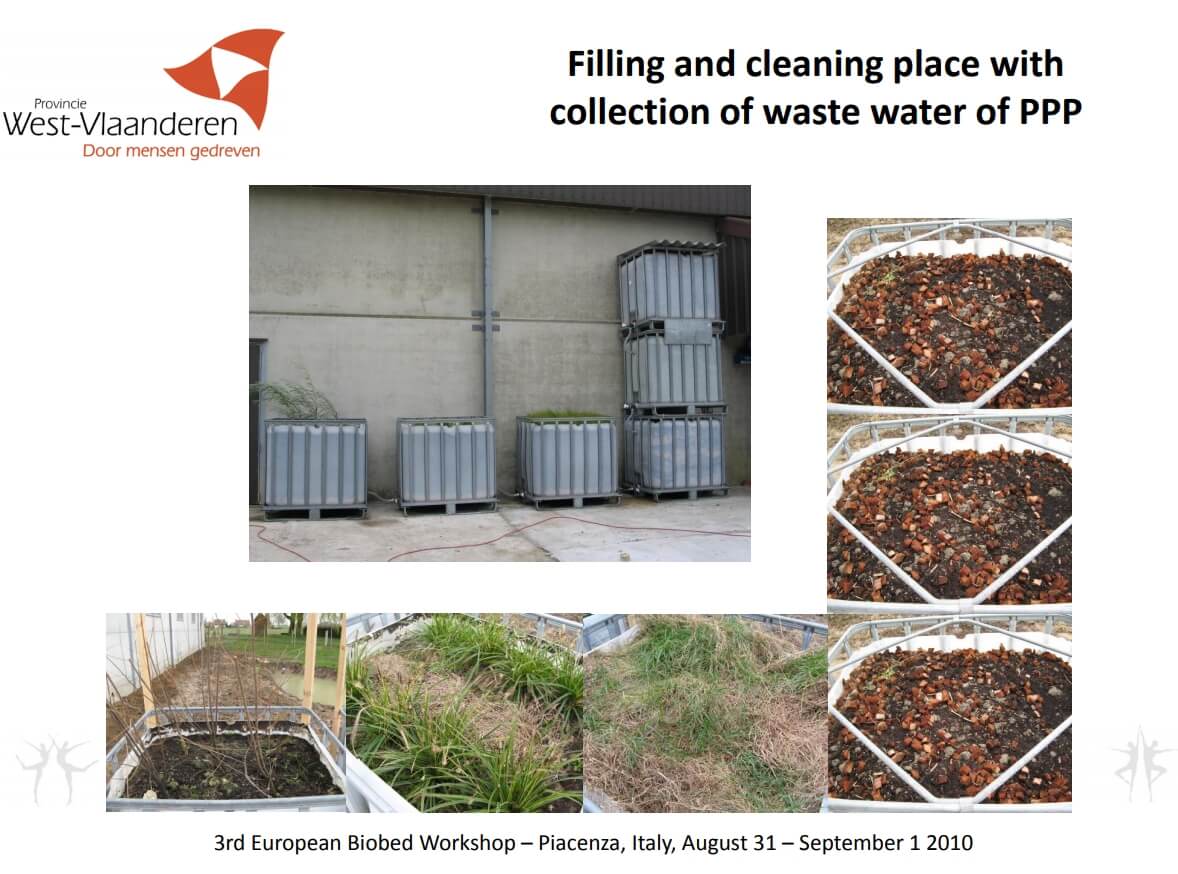
    Figure 23: Biofilter installation in Belgium (Source: Inge Mestdagh via Biobeds.org).

    Biomix longevity

    Swedish and UK research has suggested that biobeds require minimal maintenance aside from water management in closed systems. Biomix will settle over time and may need to be topped up. After five to eight years of use, it has been recommended to remove biomix and distribute it over a field with a manure spreader.

    Canadian research results

    Extensive analysis of pesticide degradation in five biobeds across Western Canada was conducted as part of a three-year study led by AAFC. Between eight and 51 products were analyzed per site, including herbicides, fungicides, and insecticides. Their results showed that single biobeds could remove about 90% of the introduced pesticide, and two in sequence usually removed more than 98%.

    Pesticides that tended not to degrade rapidly were removed to a greater degree in the second biobed.

    In the AAFC studies, three herbicides were more difficult to remove in the tested biobeds: clopyralid (e.g., Lontrel, Stinger), bentazon (Basagran, Storm) and imazethapyr (Pursuit, Arsenal). For these three, roughly 60% was removed in a two-biobed system.

    Concentrated pesticides should not be introduced to a biobed as this will kill the microbial populations.

    Some fungicides were shown to depress microbial populations but only temporarily. Microbial breakdown still occurred.

    Biobed manual

    AAFC has authored a comprehensive manual on biobed operation and installation based on research experience in Canada and elsewhere. It will be available here in late June 2018.

    The future of biobeds

    Research into biobeds remains active around the world. Different substrates for the biomix are being studied to suit local availabilities. Various systems, ranging from simple to highly engineered are being studied. Degradation effectiveness for various influents remains a topic of significant interest. Producer adoption and implementation are being reported.

    Thanks to funded research projects, biobeds are up and working at Canadian institutional sites such as government research centres, and there are opportunities for county and municipal government sites. For biobeds to be a viable option on North American farms, their design needs to remain simple and their integration into established practices needs to be seamless. Producer experience and feedback are essential

    Learn more

    Valuable information on biobeds can be obtained from these two websites:

    Voluntary Initiative (UK industry)

    Biobeds.org (International research)

    Note: Brian Caldwell and I first learned about biobeds from Eskil Nilsson (website) during a visit to Sweden in 2001, and obtained support for initial studies in Saskatoon and Indian Head from the Pest Management Centre as well as Bayer CropScience. Brian took a lead in our creative and technical efforts over many years. Dean Ngombe, under the co-supervision of Diane Knight at the U of S and myself, produced the first M.Sc. thesis, and with significant input from Allan Cessna, the first scientific publications in Canada on biobeds. Thanks for Larry Braul and many collaborators for leading the most recent AAFC study and generously sharing resources, and Erl Svendsen, Bruce Gossen, and Claudia Sheedy for editorial input.

  • Plot Sprayer Calibration Worksheet

    Plot Sprayer Calibration Worksheet

    Need a worksheet for calibrating a plot sprayer? Well, we just so happen to have one here:

    Plot Sprayer Calibration (May 15, 2018)

  • Spraying in Dusty Conditions

    Spraying in Dusty Conditions

    Dusty conditions are common in spraying, and in dry springs they are often associated with a further challenge, drought-stressed plants. There is no magic cure for these problems, but here are a few guidelines:

    1. Most products are not strongly affected by dust. But two important products are very dust-sensitive, glyphosate and Reglone. The active ingredients in both products are very “charged”, therefore they bind readily and strongly to soil particles, which includes not only dust on plant surfaces, but also suspended soil in spray water that gives the “turbid” appearance.

    2. Dust can be viewed as similar to hard water cations, as a game of relative concentration. We try to get the herbicide concentration to be higher, essentially over-powering the antagonist. For glyphosate, two approaches are common: (a) reduce water volume; (b) increase herbicide rate. Reduced volume is tricky if the glyphosate spray contains a tank mix partner such as a Group 6, 14, or 15 to combat resistance. Those products require more water. For Reglone, low water is a bad idea for the same reason.

    3. Some specialists recommend the use of higher water volumes to reduce the effects of dust. Although spray volumes are usually too low to actually wash dust off surfaces, the higher water volumes permit the use of larger droplets which may have better absorption characteristics in the presence of dust.

    4. Another remedy is to increase the application rate in the spray swath where dust is most severe, usually behind the wheel tracks. Slightly larger nozzles in those regions are widely used by sprayer operators.

    5. Even when dust is not a problem, roadside field edges may contain dust from traffic. Higher rates may be justified on the outside rounds for that reason.

    6. A report in No-Till Farmer makes the following useful statements:  “Greenhouse research conducted by researchers at North Dakota State University in 2006 found that control of nightshade species with glyphosate was reduced when dust was deposited on the leaf surfaces before, or within 15 minutes after, glyphosate application. If the dust was deposited later than 15 minutes after application, phytotoxicity was not reduced.  Dust generated from silty clay soil tended to reduce glyphosate phytotoxicity more than dust generated from loamy sand soil.”

    7. Several additional management opportunities exist for dusty conditions. Slowing down tends to reduce turbulence and dust generation. Although front-mounted booms apply the spray before the dust is generated, it will deposit before the spray is dry, limiting the benefit, as indicated by the NDSU study.

    8. Don’t mistake aerodynamic turbulence for dust. Weed control may be lower behind the tractor unit or near the wheels because the spray is displaced by air currents. The use of water-sensitive paper can help identify if this is part of the problem.

    One of the better references on dust and wheel tracks was produced by the GRDC in Australia, and can be found here.