- Aerial dye mapping showed drone deposition concentrated along flight lines, often not overlapping adjacent passes.
- Rhodamine WT required multispectral filtering to visualize faint deposits; single-pass staining was weak without enhancement.
- Swath width tapers during acceleration and deceleration, creating intense tapered edges and potential coverage gaps.
- The DJI T100 needs about 50 m to accelerate to or decelerate from 10 m/s.
- Headwinds increased acceleration and deceleration distances by roughly 16 percent, worsening gap risk; acceleration distances exceeded deceleration significantly.
This text was generated by OpenAI GPT 5 Mini
It can be challenging to illustrate how a drone deposits spray. We can take a cross-section of spray deposit (that is, the swath) using a continuous sampler, or a series of discrete samplers. This typically reveals a sharply-peaked curve that is symmetrical in a head- or tail-wind, or skewed if there is a cross-wind.
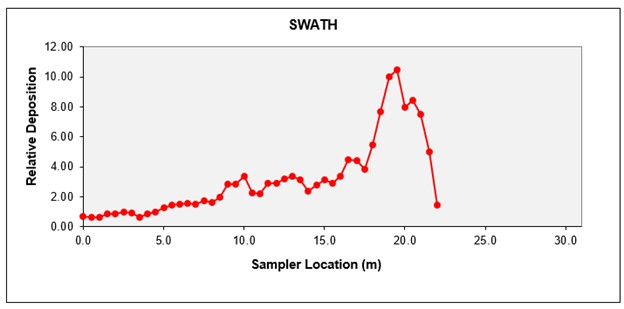
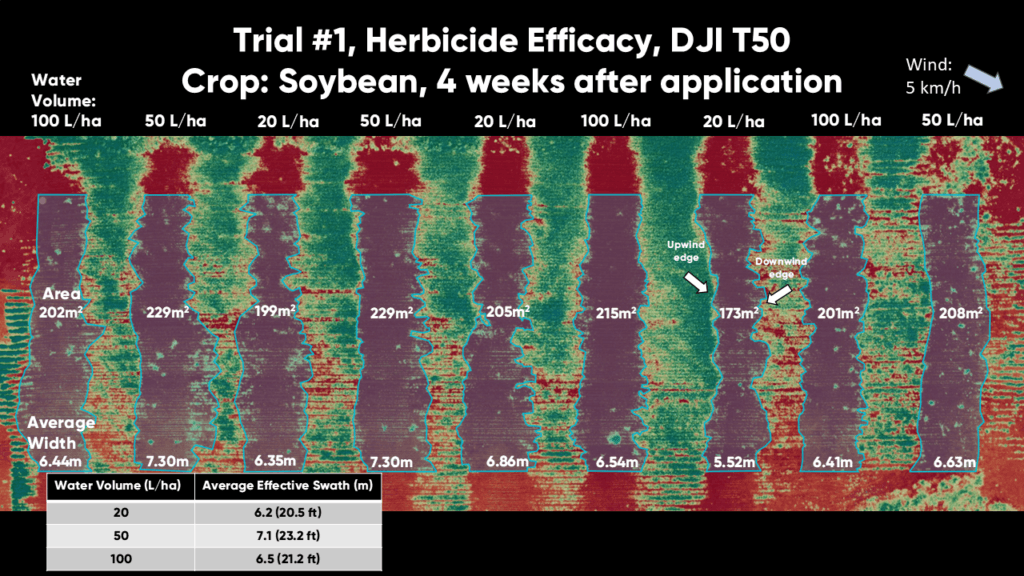
But this analysis only captures a slice of the swath at a single moment in time. Swath width and relative position along the flight path is inconsistent and highly variable. Some have shown this using herbicides and aerial photographs analyzed through a Normalized Difference Vegetation Index (NDVI). NDVI reveals the health and density of vegetation based on how they reflect different wavelengths.
Design
We wanted to try something similar, but using dye instead of herbicide. Rhodamine WT is a synthetic fluorescent dye that absorbs green light and emits red light. It’s highly water-soluble and is the industry standard for environmental monitoring, including mapping groundwater flow, tracing pollution plumes and studying flow rates in rivers. We’ve used it in the past on Ontario’s snowy fields to show how boom height affects coverage uniformity with boom sprayers. Why not from a drone?
The idea was to lay down swaths from a DJI T100 at different altitudes and speeds, and then take aerial photographs of the stained snow using a DJI Mavic 3 Multispectral drone. It would be visually impactful, and perhaps we could even quantify the deposition using photogrammetry and drone mapping software.
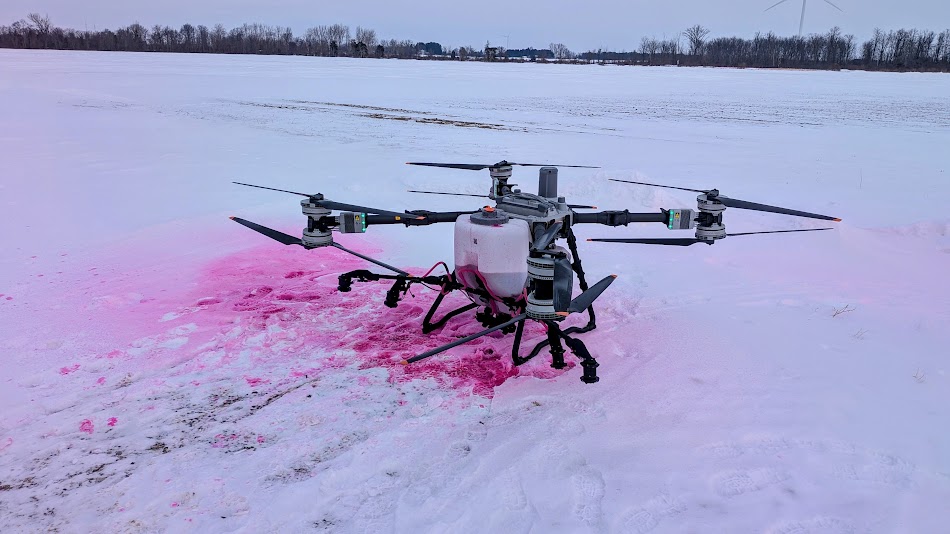
We flew a snowy field on Stefina Line, Blenheim, Ontario. It was 2°C and wind was gusting from 8-14 km/h. We mixed a 0.5% v/v solution of 0.5 L rhodamine WT in 900 L and flew a trial run (4 m altitude, 50 L/ha, 10 m/s, 500 µm droplets). But, as Robbie Burns said, “The best laid plans of mice and men [often go awry]. (If you’re not into late 18th century poetry, you’re forgiven.)
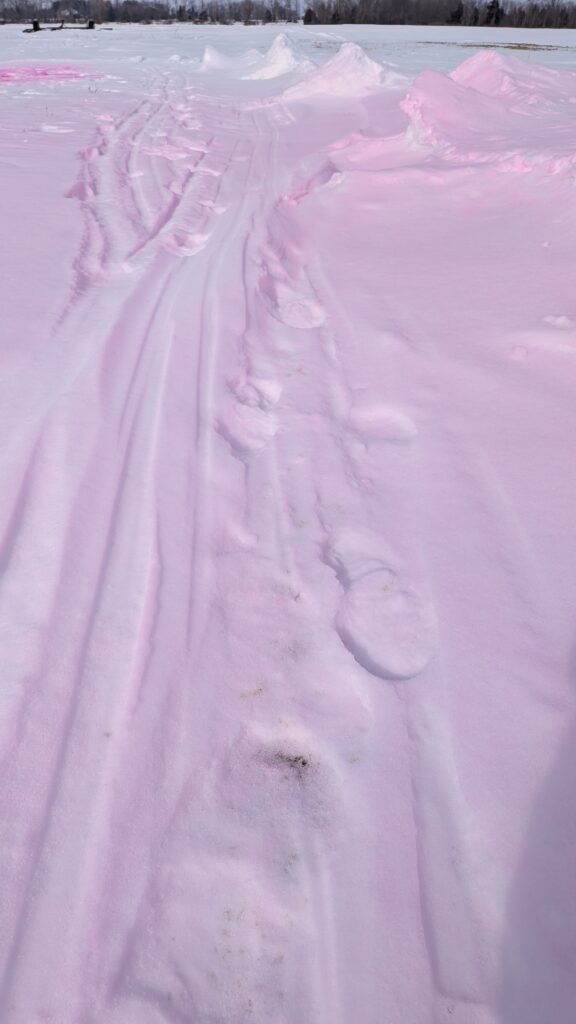
Rhodamine WT applied by drone did not result in high-contrast deposition. Hoping it was a function of concentration, we emptied the remaining rhodamine into the nurse tank, essentially doubling the concentration (we didn’t measure it), but to no avail.
New Plan
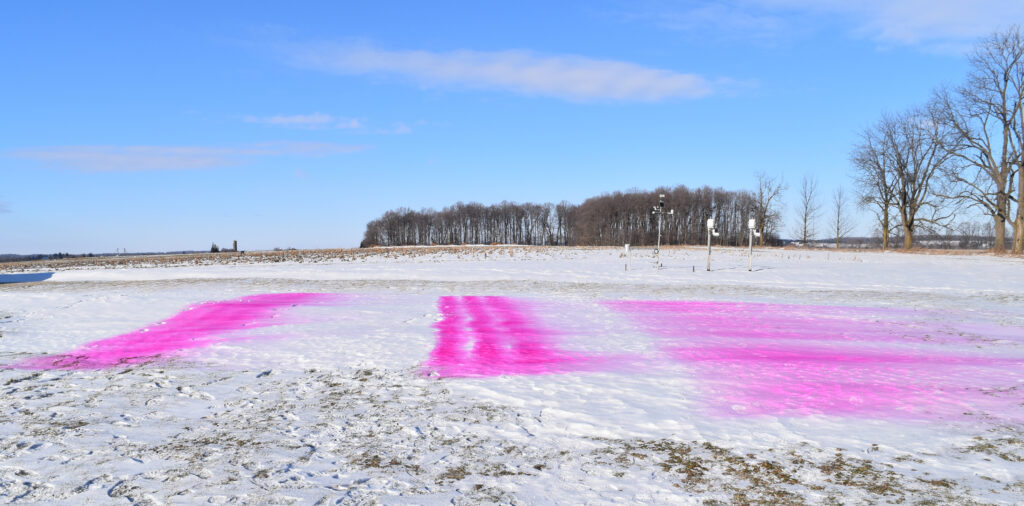
We decided to pivot. We laid out a ~2.0 ha (5 ac) area and programmed the drone to fly a 10 m route spacing. Our hope was that the swaths would overlap for complete coverage, and perhaps we’d see a completely-stained rectangle. But, it seemed striated rather than solid, and the faint colouration made it difficult to see. This led us to shift to another location and spray another block, but this time we flew it four times in the hope that “multiple coats” would result in a brighter stain. We were already there, so why not?
Feeling a bit underwhelmed, we slowly flew the Mavic M3M to capture aerial footage. In the following image you see the less-than-spectacular result in the visual spectrum (left). Then our operator had the bright idea to filter the spectrum to enhance the rhodamine, and suddenly we had something (right). By reducing the green light, the rhodamine glowed gold, and we could see the faint block (sprayed once) and the much more intense block (sprayed four times).
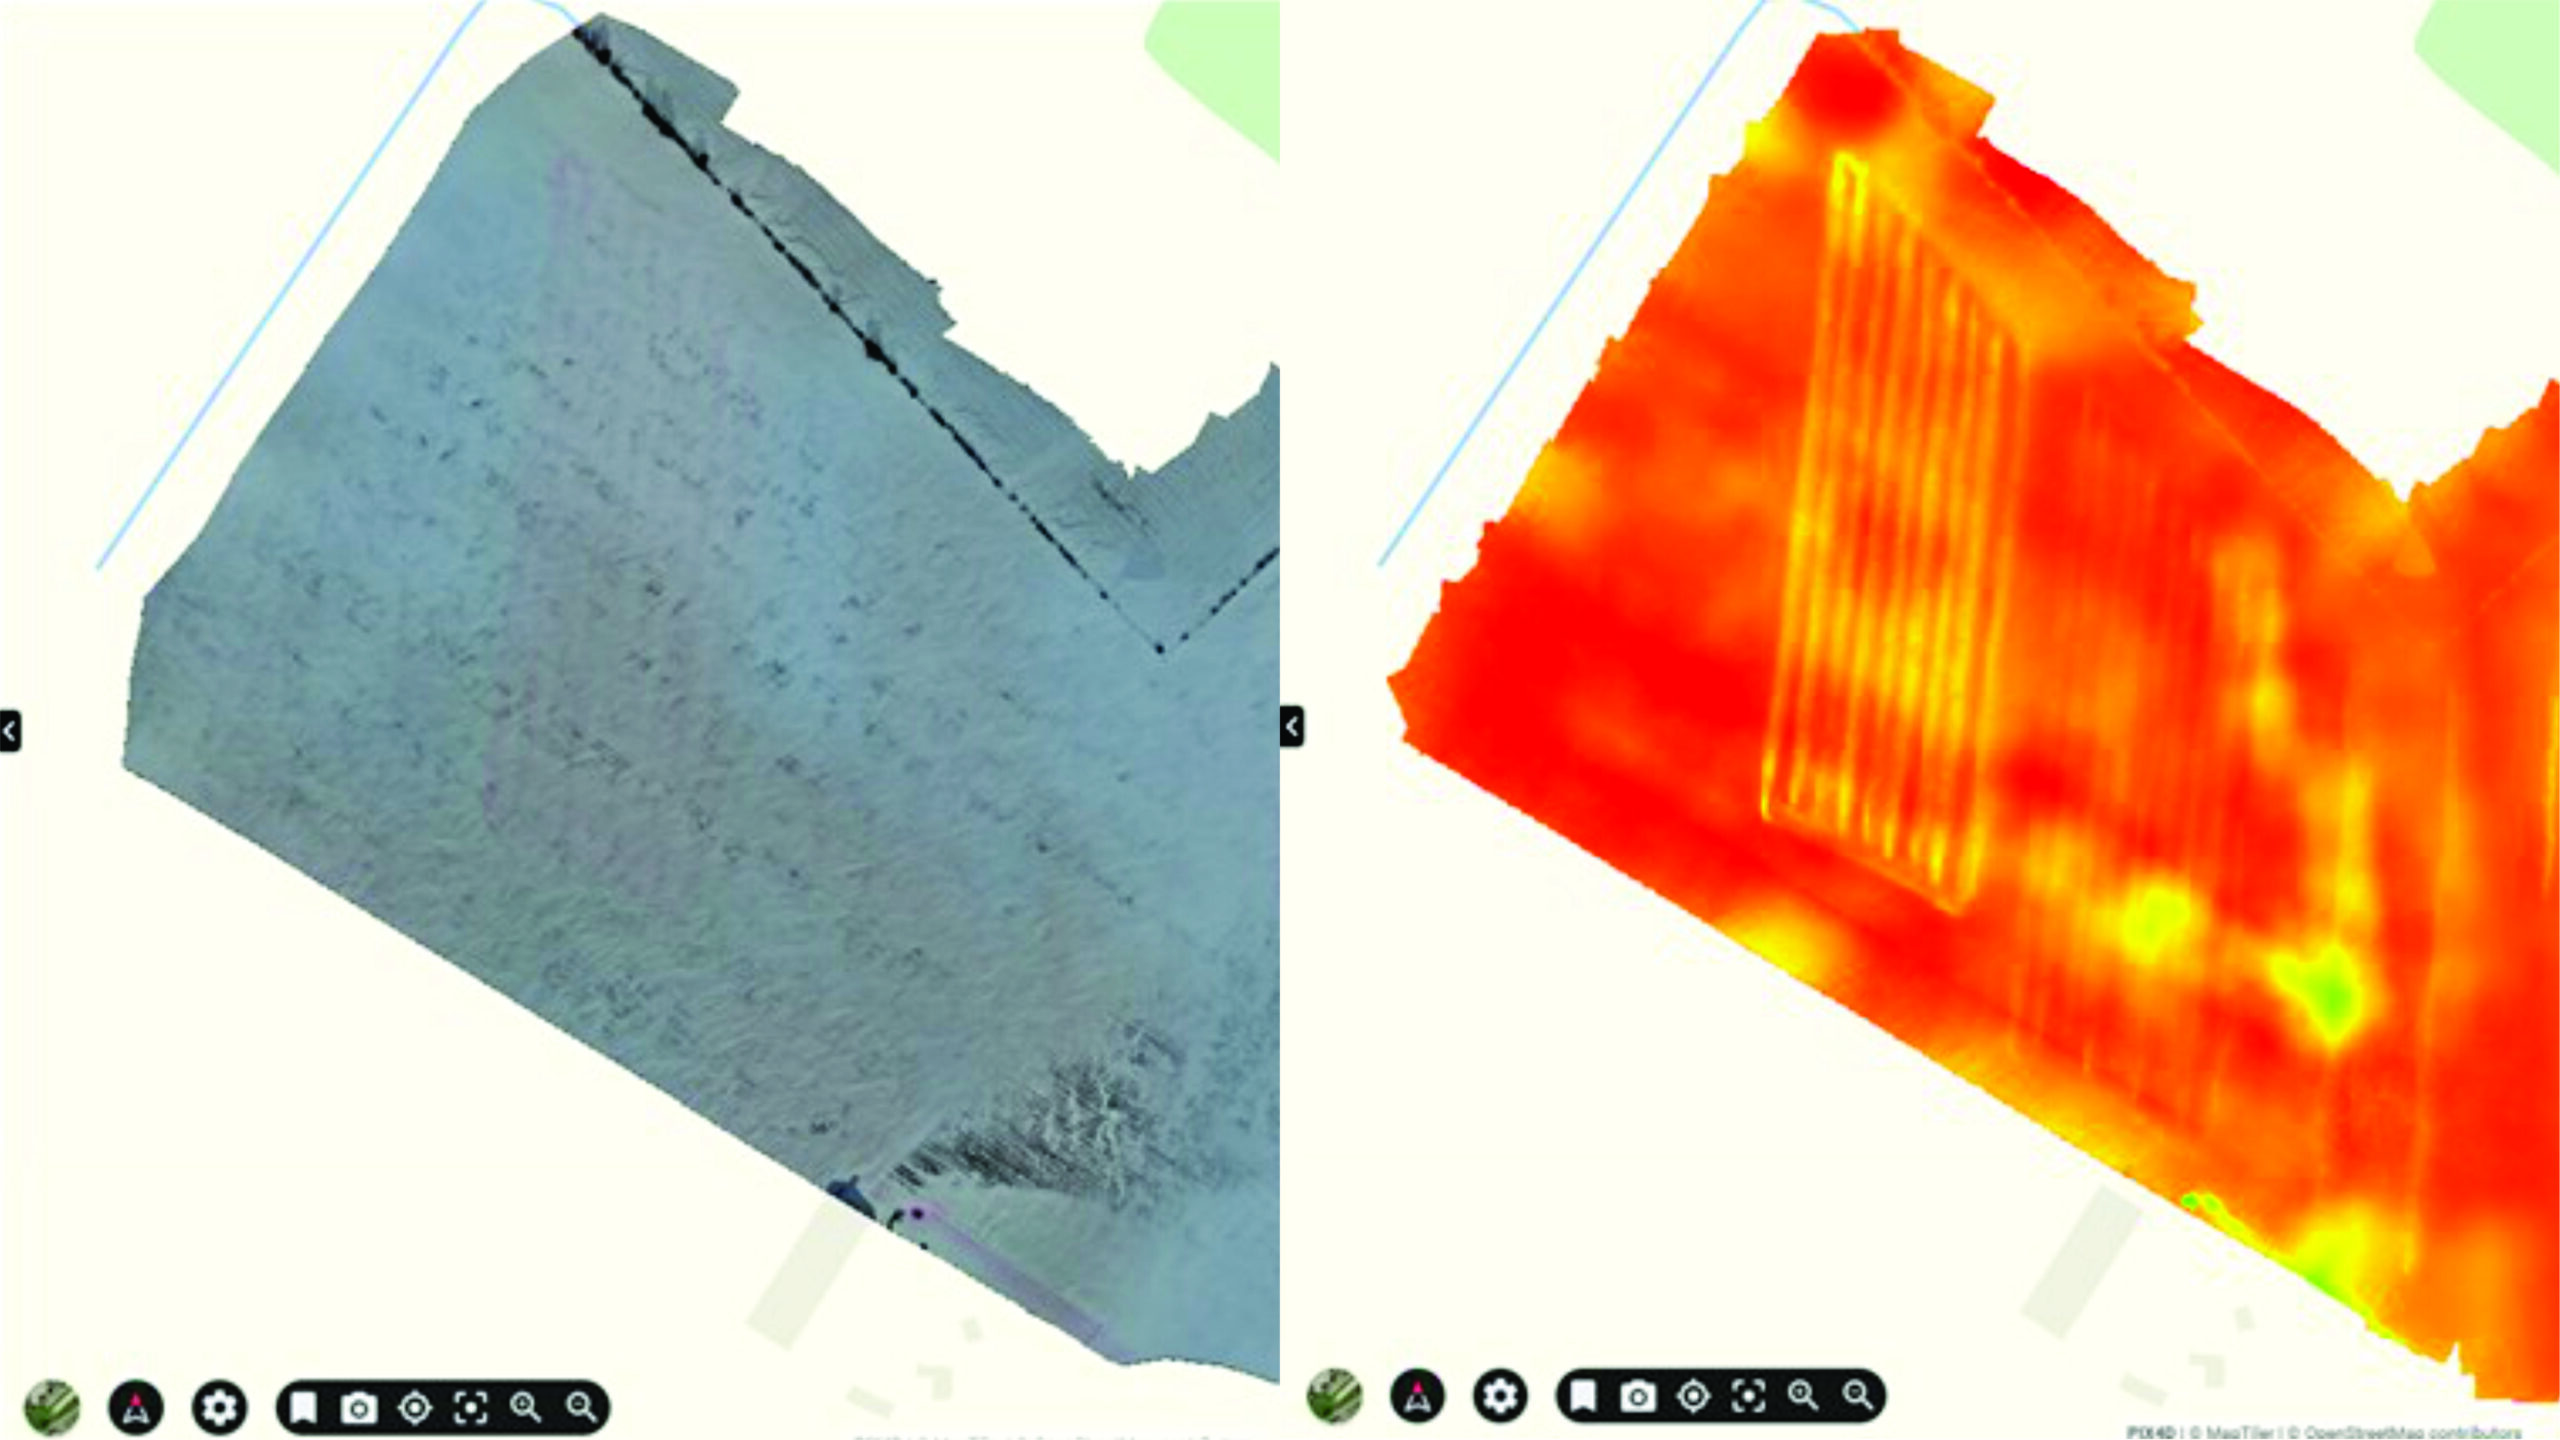
Note that the block is not a uniform, gold rectangle. The deposition is concentrated along the flight paths and does not seem to overlap (or even reach) the spray from adjacent passes. While this might be a resolution issue, it implies the swath width was less than the route spacing.
Then we zoomed-in on the downwind and upwind edges of the block that received multiple passes and noticed something. Given the variability of spray deposition, and the fact that we made four passes, we expected coverage would be blurred. Instead, there were clear, intense tapers where the drone was either accelerating or decelerating at the boundary (depending on the direction it was flying).
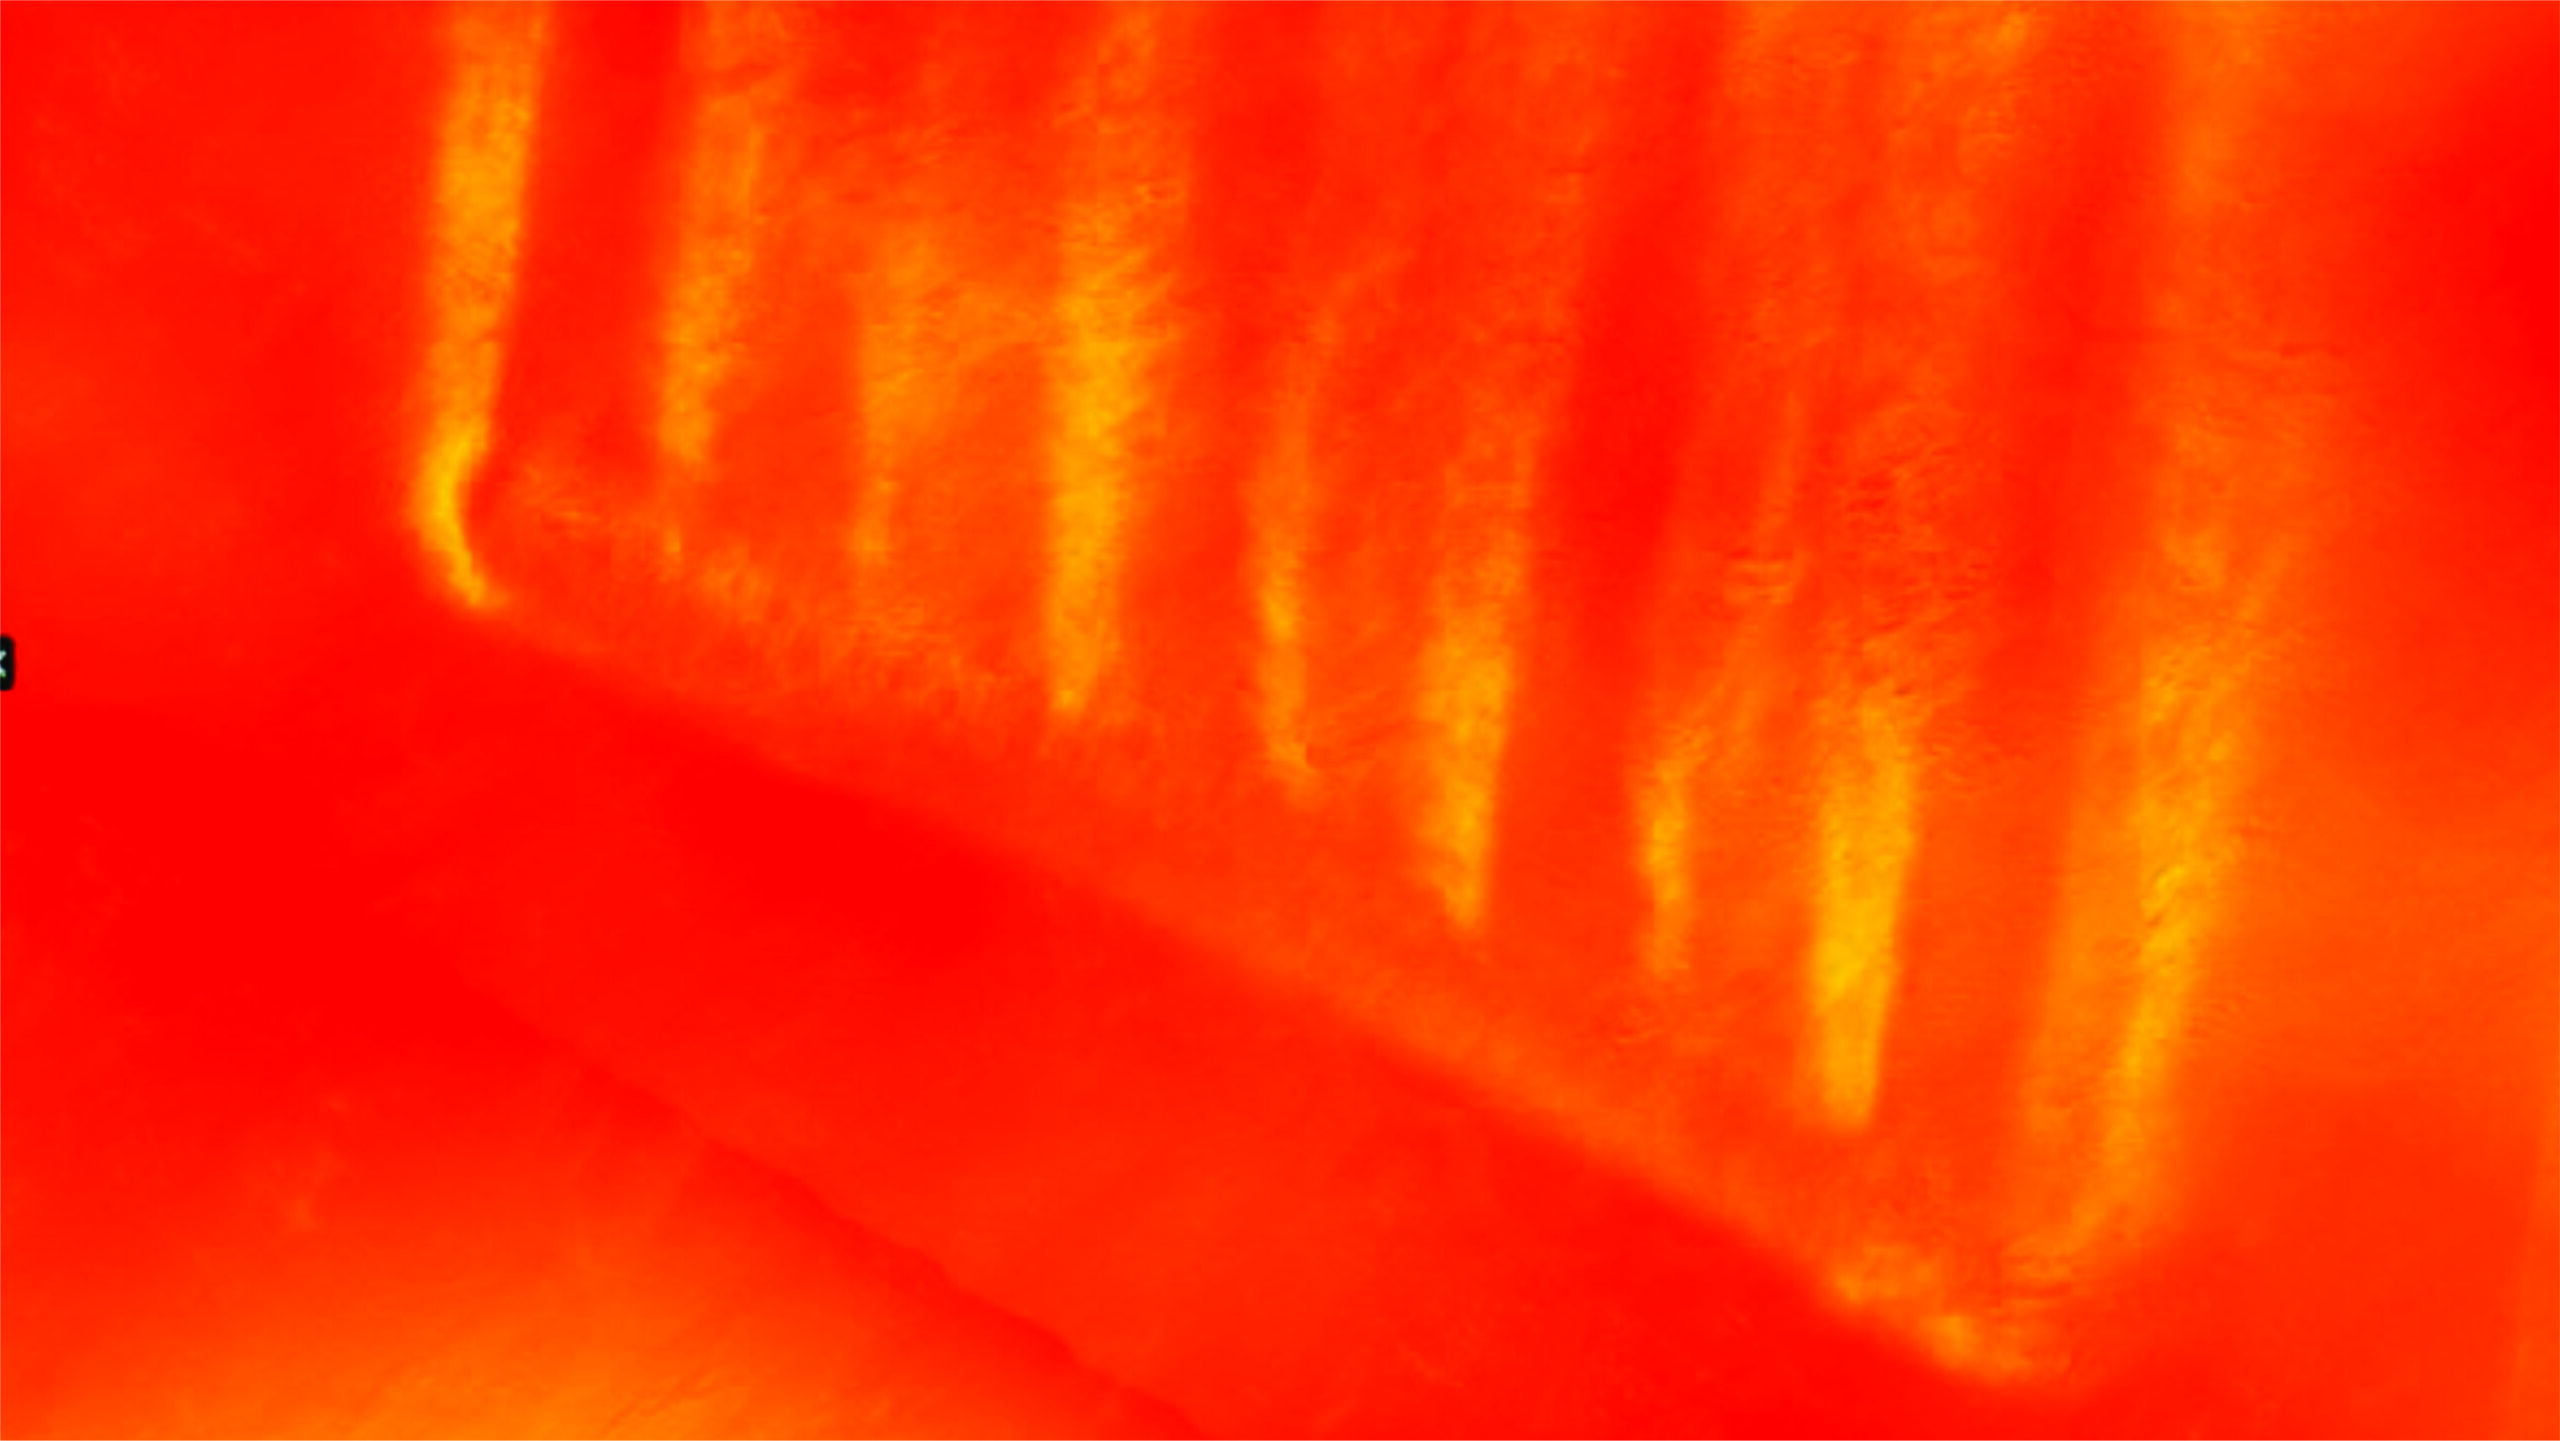
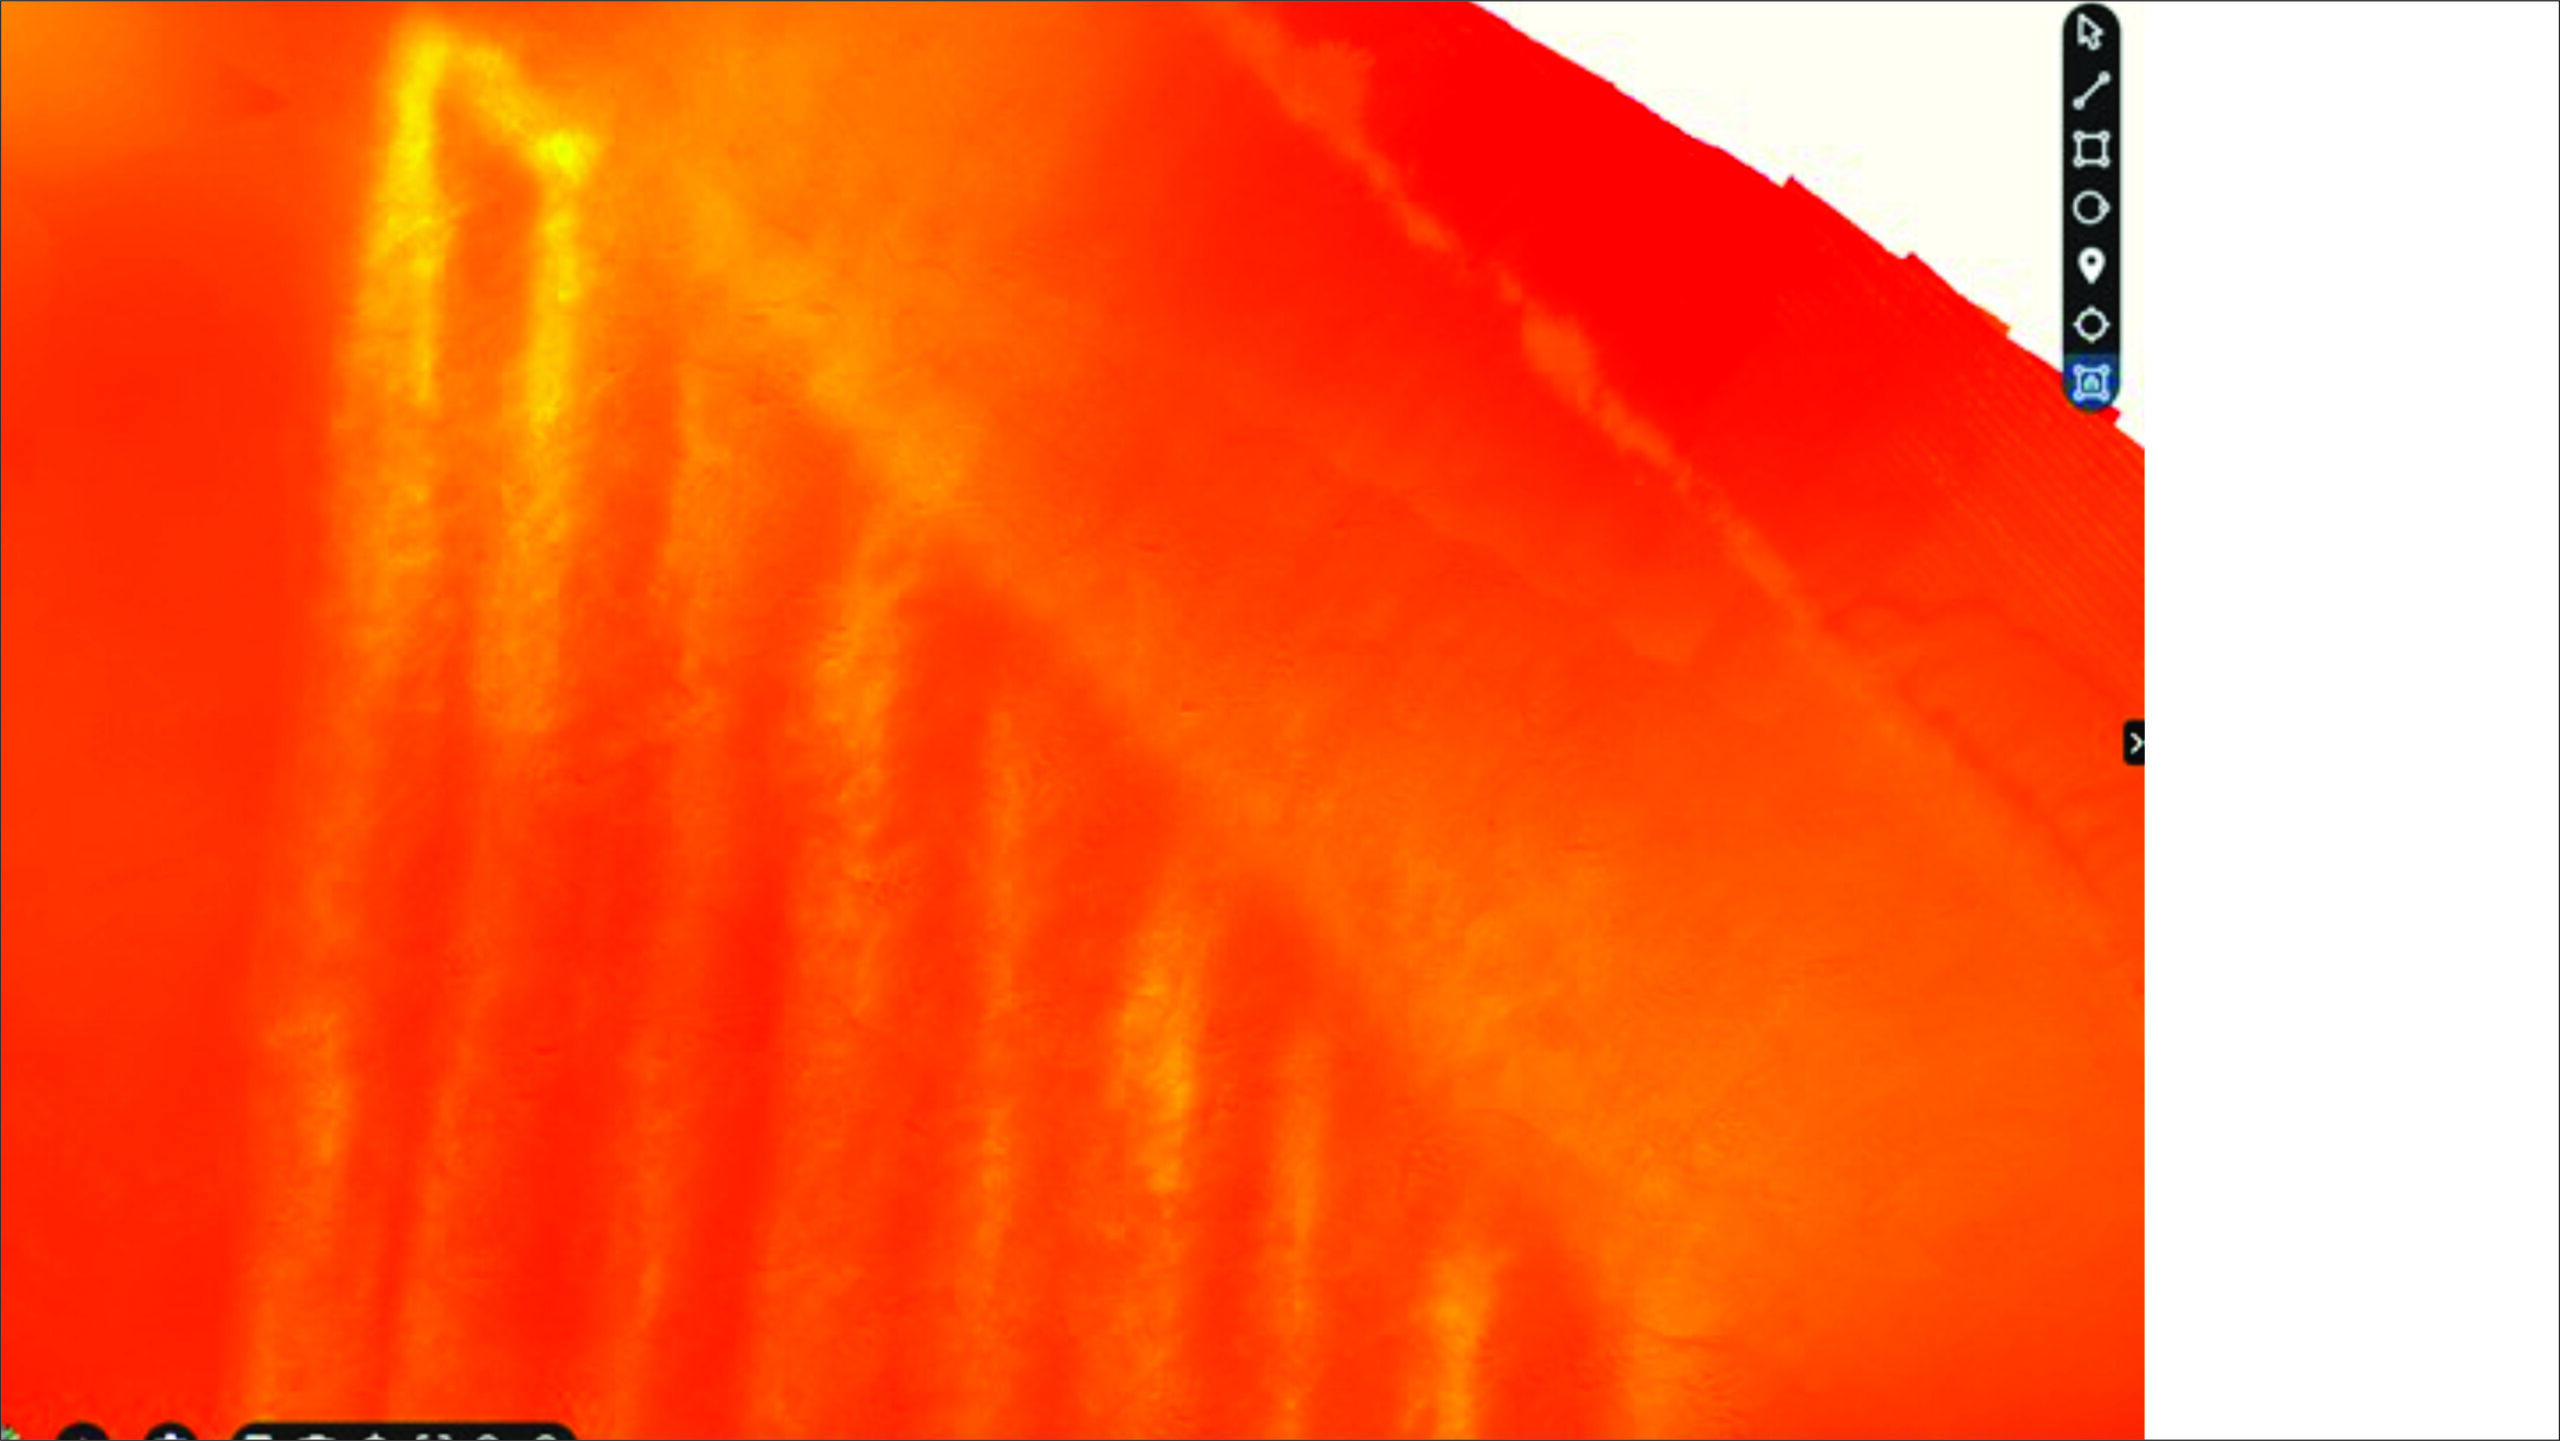
We know from prior work with the T10, T30 and T50 that swath width and travel speed are directly related up to a certain speed (perhaps around 10 m/s, but this is yet to be determined). The practical implication was made clear in these images: there were significant gaps in coverage on two field margins. How long were the gaps? Did relative wind direction matter? Did this change with acceleration or deceleration? We went to the DJI flight record to find out.
Using the DJI telemetry data (specifically, the playback feature), we could see the flow rate relative to the drone speed and geographical position (that is, latitude and longitude). For each pass we established the point where the drone started or stopped spraying, and the point where the the target flow rate and speed were constant. Then, using the latitude and longitude, we calculated the intervening distance between coordinates.
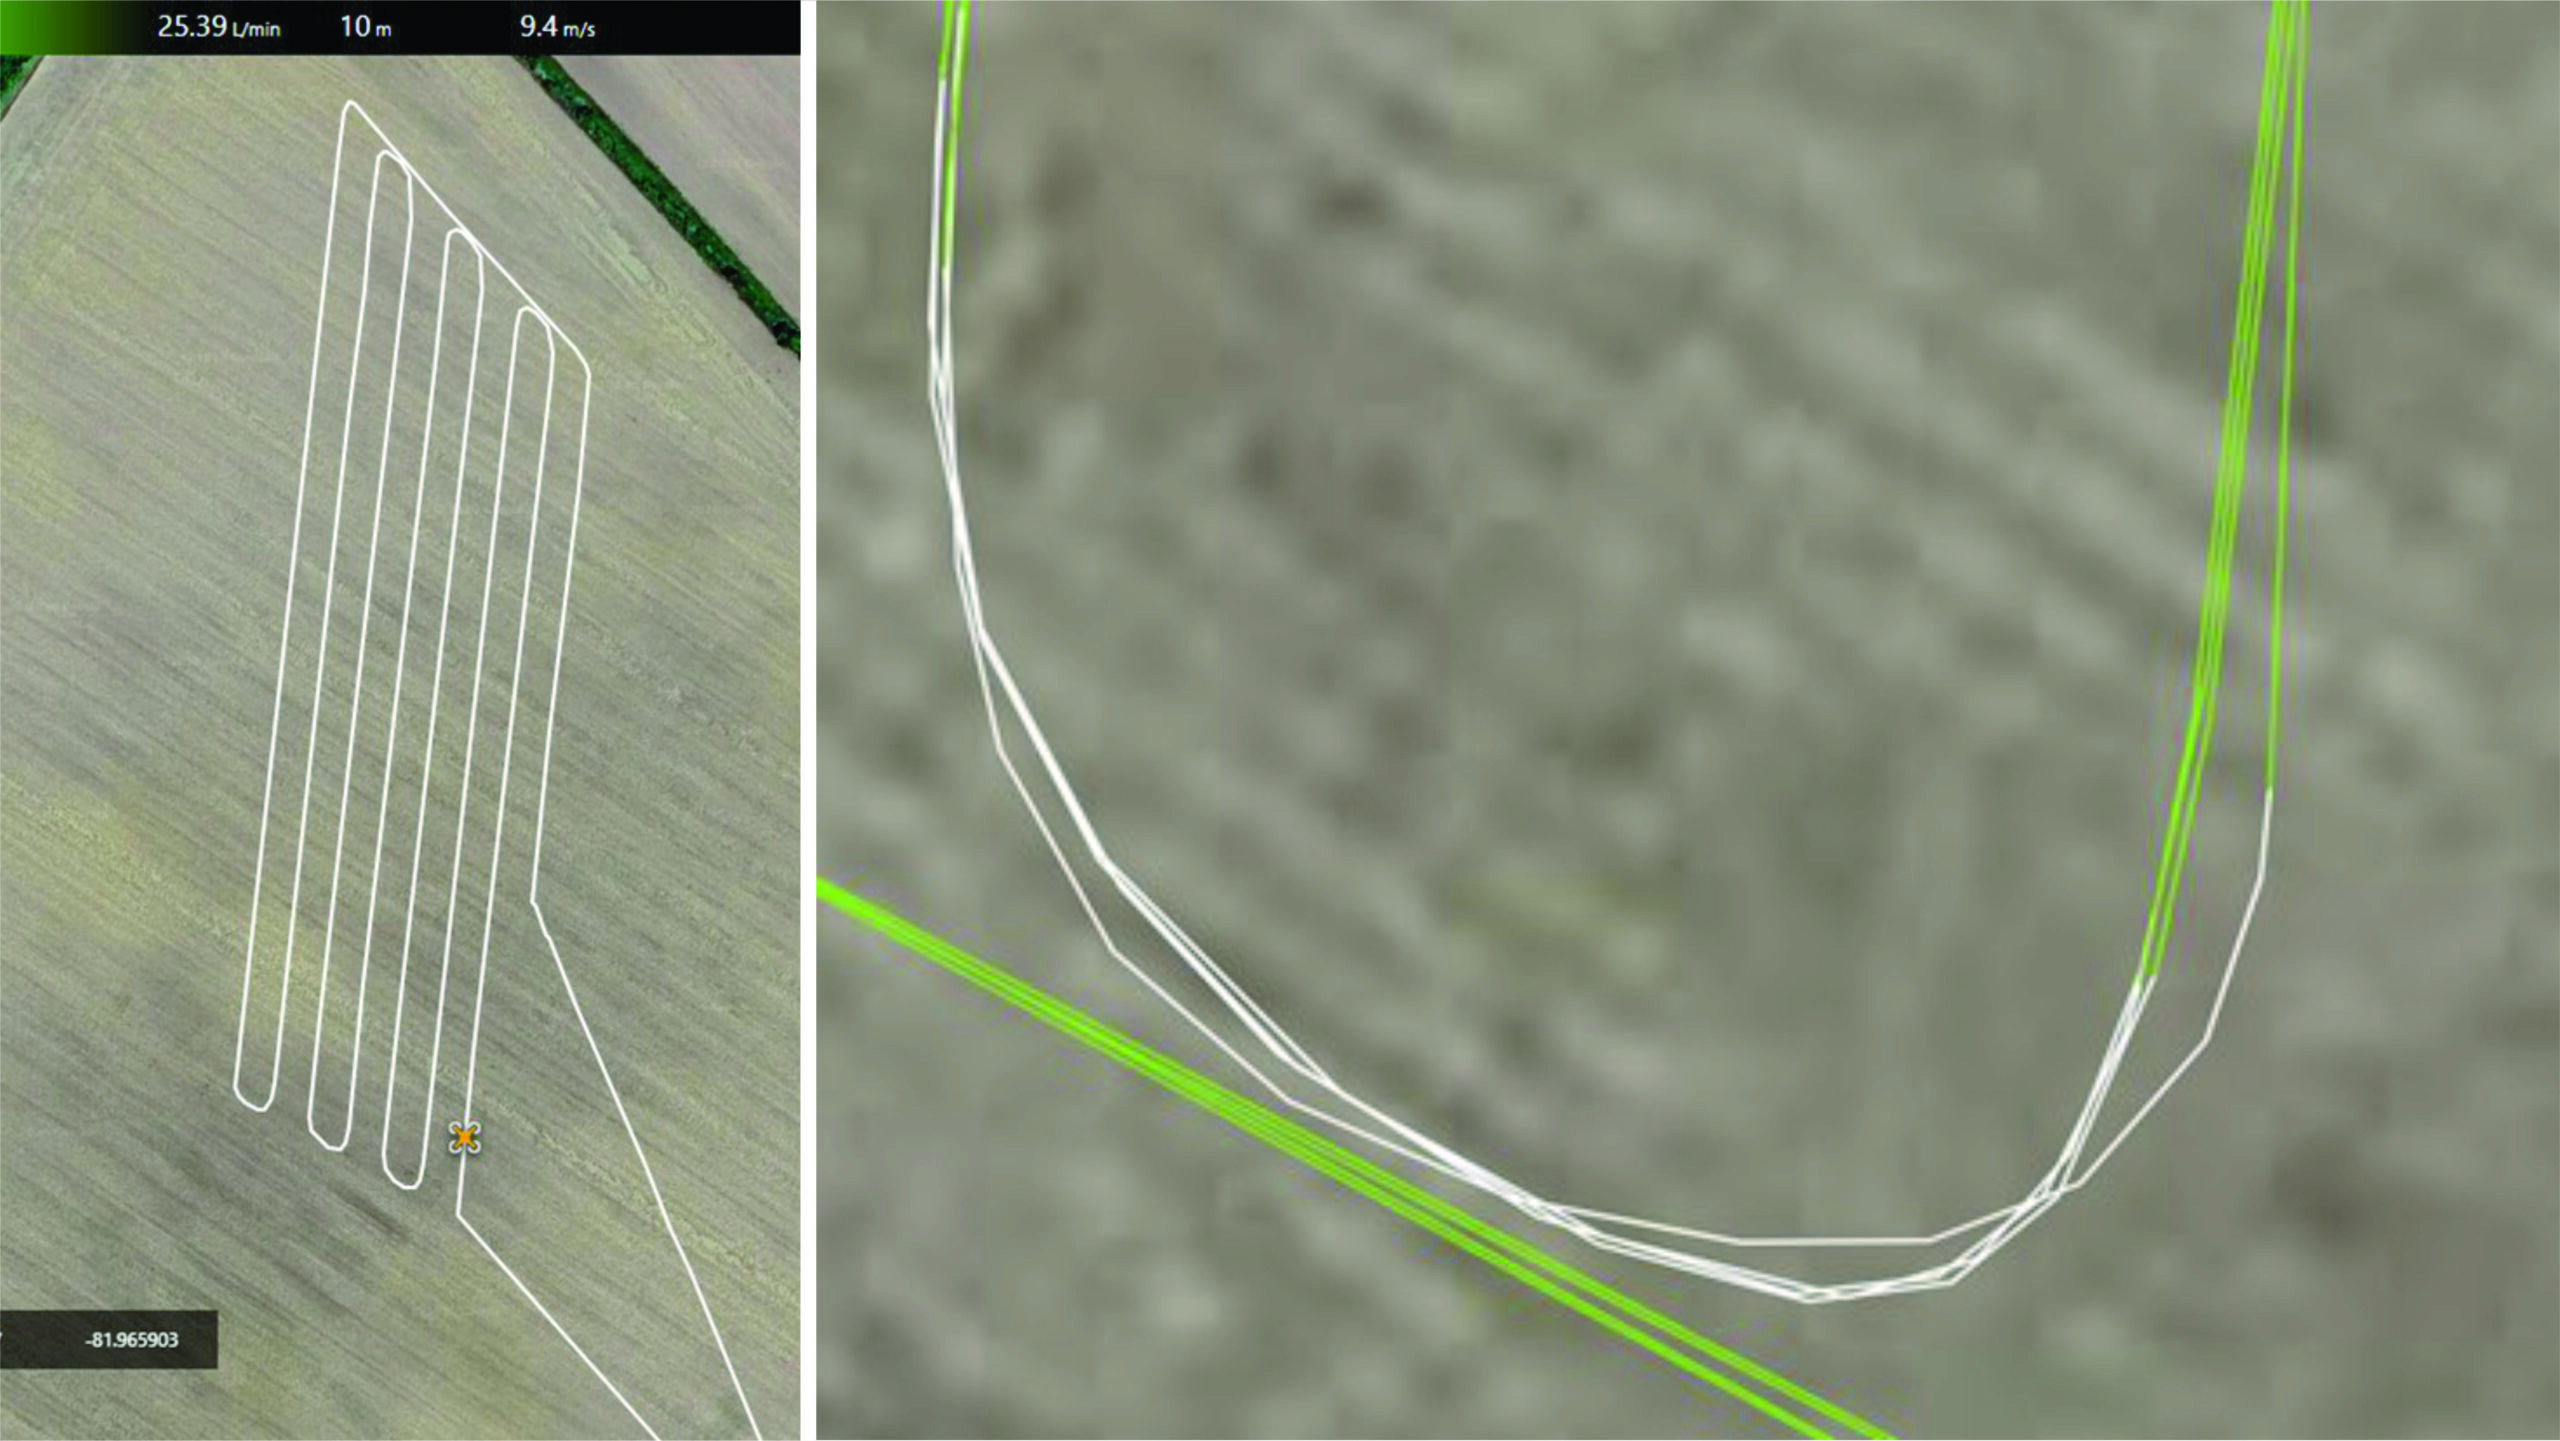
Analysis
We should note that we were able to spray just under 5 ac with a single tank, so the area that received four passes required multiple refills. This means the weight of the drone at any given location (and therefore the strength of the downwash) changed throughout the trial. We feel weight would affect acceleration and deceleration distances, but it wasn’t controlled in this study.
Most runs showed the acceleration distance was significantly greater than deceleration distance (Paired t-test: t = 2.54, p = 0.044).
| Pass | Relative Velocity | Headwind Distance (m) | Tailwind Distance (m) |
| 1 | Acceleration | – | 54.4 |
| 1 | Deceleration | – | 44.1 |
| 2 | Acceleration | 57.1 | – |
| 2 | Deceleration | 43.4 | – |
| 3 | Acceleration | – | 44.3 |
| 3 | Deceleration | – | 38.9 |
| 4 | Acceleration | 54.8 | – |
| 4 | Deceleration | 64.6 | – |
| 5 | Acceleration | – | 52.2 |
| 5 | Deceleration | – | 37.7 |
| 6 | Acceleration | 56.7 | – |
| 6 | Deceleration | 46.7 | – |
| 7 | Acceleration | – | 55.9 |
| 7 | Deceleration | – | 43.5 |
Headwind increased both acceleration and deceleration distances. There was a 7.5 m (16%) increase in a headwind, which was significant (r2 = 0.23). There was a stronger effect on deceleration, although not significantly.
| Wind Direction | Mean (m) | Std Dev (m) | Min (m) | Max (m) | Count |
| Headwind | 53.9 | 7.7 | 43.4 | 64.6 | 6 |
| Tailwind | 46.4 | 7.0 | 37.7 | 55.9 | 8 |
| Relative Velocity | Headwind Mean Distance (m) | Tailwind Mean Distance (m) |
| Acceleration | 56.2 | 51.7 |
| Deceleration | 51.6 | 41.0 |
Conclusion
In a previous trial with the DJI T100 we noted the drone was not able to exceed 18.3 m/s over a 250 m treatment distance. It took roughly 200 m to get up to 18.3 m/s before the drone began to slow in anticipation of the end of the treatment block. At the time we assumed the drone would not be under- or over-applying because the pump flow rate compensated for a changing travel speed.
However, we had not considered the effect on swath width. Here, we see the T100 requires about 50 m to accelerate to / decelerate from 10 m/s. This distance is a function of wind direction, and to a lesser extent, whether the drone is accelerating or decelerating. During this time, the swath width is less than when at target flight speed, leaving (larger) gaps between passes.
This is a concern for broadacre applications where consistent, uniform coverage is required. Consider a fungicide that may no longer be effective at the extremes of the swath, or a systemic post-emerge herbicide where crops directly beneath the drone (especially horticultural crops or GMO’s with stressed metabolisms) could experience phytotoxic damage.
We have no practical work-around to suggest, but operators should be aware of the effect.
Thanks to Drone Spray Canada for in kind support and access to flight records, and thanks for Cesar Cappa, OMAFA horticulture weed specialist for his participation in the study and assistance with data analysis.
