Category: Boom Sprayers

Main category for sprayers with horizontal booms

  • How to Use a Nozzle Flow Chart, With a Surprising Twist

    How to Use a Nozzle Flow Chart, With a Surprising Twist

    Undoubtedly, the number one question we get from operators is: “Which nozzle should I get”? Luckily there’s no simple answer, or we wouldn’t have jobs! The reason it’s not simple is because selecting the “right” nozzle for a sprayer is a process. It can be broken down into two steps:

    • identifying the right flow rate (aka nozzle size)
    • choosing a specific nozzle model (i.e. brand, spray pattern type, spray quality, etc.)

    It’s a big question, so let’s tackle just the first bullet: identifying the right flow rate.

    All sprayer nozzles come in standardized (ISO) sizes, and these sizes are usually identified by numbers stamped on the nozzle as well as the colour of the nozzle itself. The nozzle’s key characteristics (i.e. the fan angle and nominal flow rate), are identified in a format that looks like some version of this (Fig. 1):

    2013_Nozzle_Nomenclature
    Fig. 1: Typical information printed on modern nozzles.

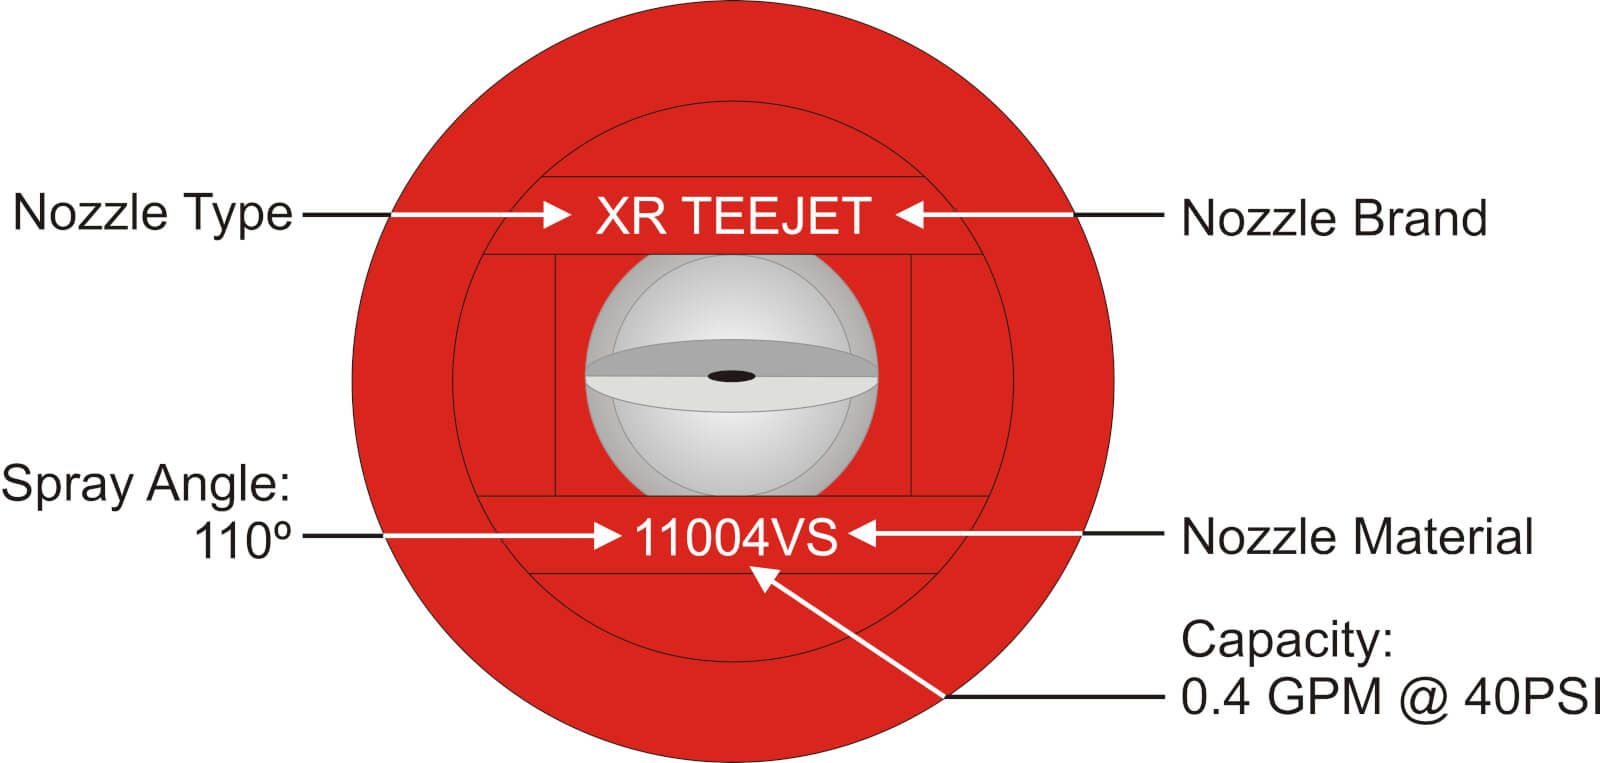
    The 110 refers to the fan angle (110°) and the 04 refers to the flow rate. 04 means 0.4 US gallons of water per minute (gpm) at 40 psi. Each nozzle brand has a slightly different convention, but no matter how the information is presented it ought to be on the nozzle somewhere.

    Nozzle colour has an ISO standard across fan-style nozzles, and we have this table to match the nozzle colour to the flow rate:

    Fig 3: ISO nozzle colours and flow rates

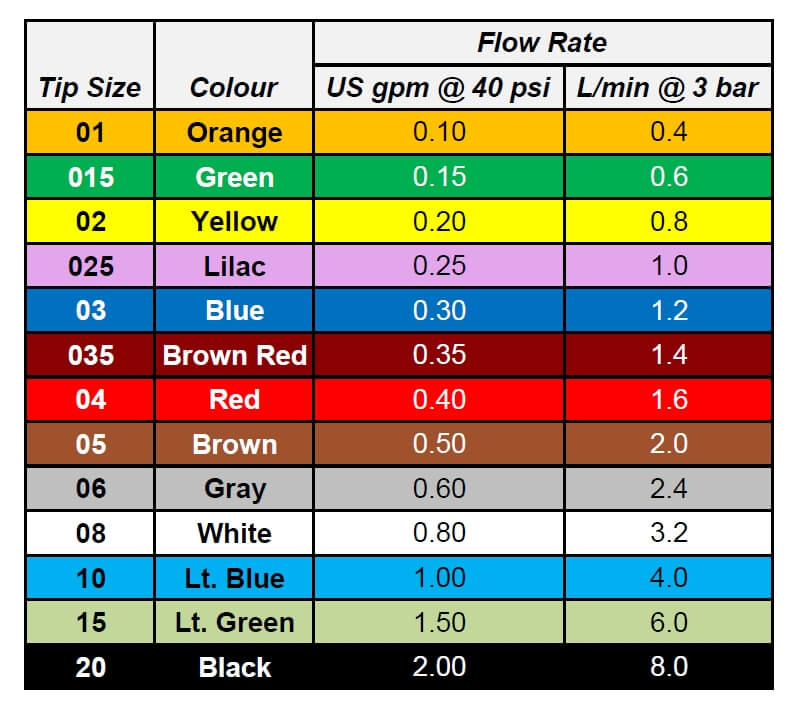
    You’ll note that the nozzle we pictured earlier was “flame red”, matching the 0.4 gpm on the table. So how do we use the table to pick the right size nozzle?

    Application rate (i.e. gallons per acre or L/ha) is a function of travel speed, nozzle spacing along the boom, and nozzle flow rate. Traditionally, this has been expressed as the following formula in US units:

    US Calibration Formula

    This formula is famously represented in nozzle charts found in all sprayer catalogues (Fig 4). Along the left side are nozzle sizes and pressures. Along the top is sprayer speed. The body of the table contains application volume. Pick your speed, and look for your application volume in the columns. If you want to apply five gpa, you need to look for the number 5 (or as close as you can get to it), among these numbers.

    Hypro Calibration Chart
    Fig 4: Typical nozzle flow rate chart, with speed at top and volumes in body. Ugh.

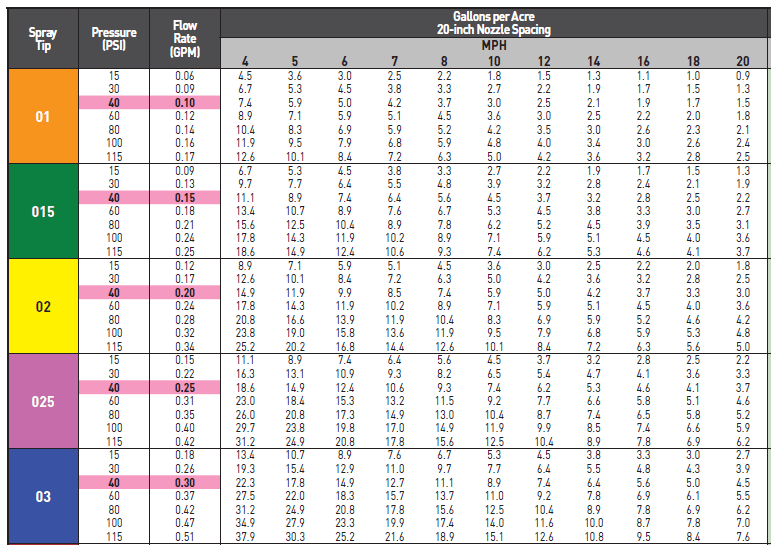
    The format of the chart can be confusing because it doesn’t follow a modern sprayer operator’s priorities. Usually, an operator decides on an application volume first, and this decision is not very flexible. Travel speed, decided second, has more flexibility.

    We’ve therefore re-worked the table to make more sense (Fig. 5). Along the top are common water volumes. The body of the table are travel speeds. Pick a water volume at the top and follow the column underneath this value to find a speed range you’re comfortable with. To the left, the nozzle size and corresponding operating pressures are now visible.

    Fig. 5: Nozzle flow rate chart with volumes at top makes it user friendly.

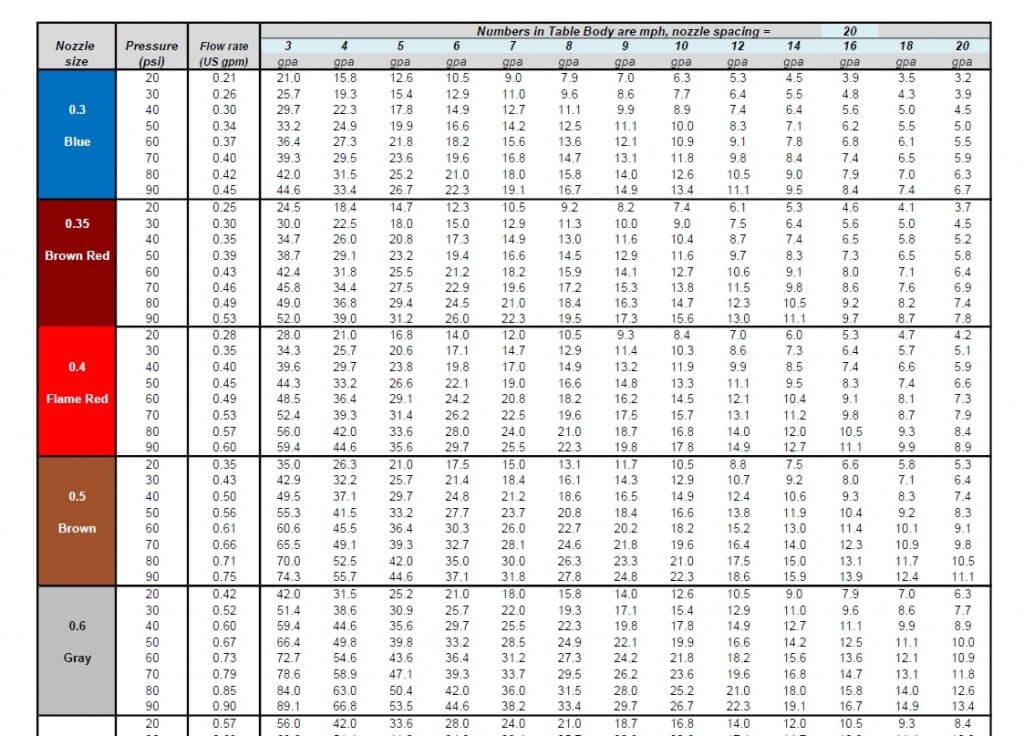
    Try to operate at a spray pressure that’s in the middle of the nozzle’s operating range. For an air-induced nozzle, the range is usually from 30 to 90 psi, so the middle is 60 to 70 psi. That should be the target pressure. Look for a nozzle size that delivers this pressure at your expected travel speed.

    These columns can be used to work out a nozzle’s travel speed range. If a nozzle can be operated between 30 and 90 psi, for example, the corresponding speeds are listed in the same rows in the volume column.

    For example, say you want to apply seven gpa and think that 13 mph would be a good average travel speed.

    Fig 6: Five solutions for the question, “which nozzle to apply 7 gpa at 13 mph?”

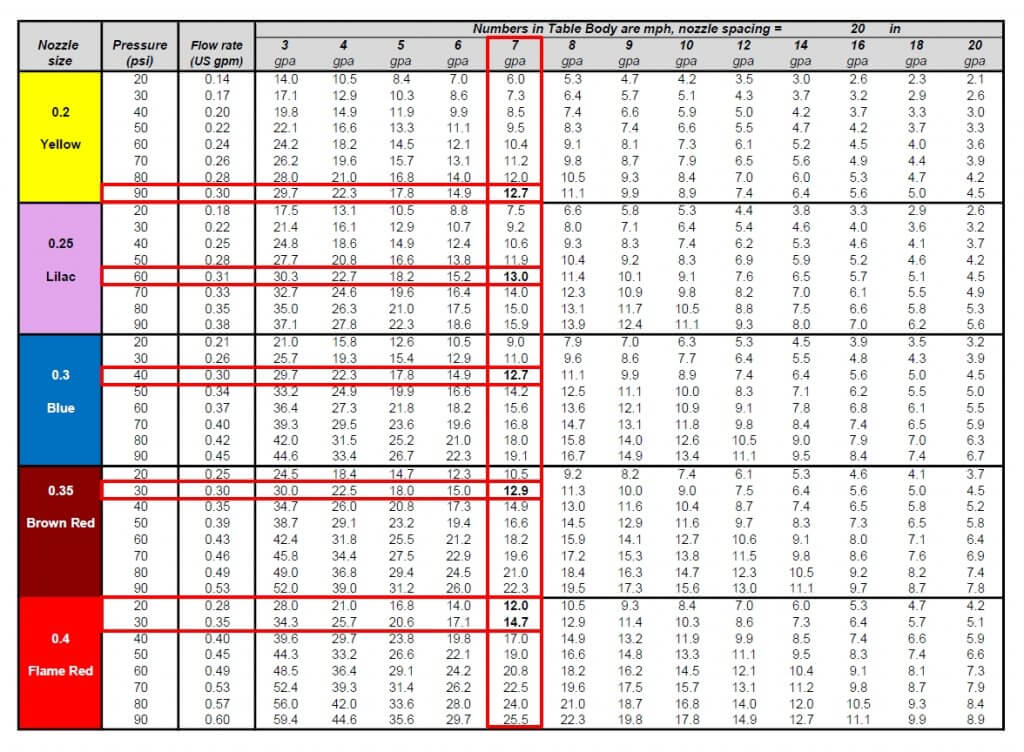
    Move down the seven gpa column, and you’ll encounter a value close to 13 mph five times – the yellow nozzle at 90 psi, the lilac nozzle at 60 psi, the blue nozzle at 40 psi, the dark red at 30 psi, and the red at about 25 psi. Now use the columns to see which of these three best matches your expected travel speed range.

    The yellow nozzle would allow between seven and 12.5 mph from 30 and 90 psi, the lilac nozzle nine to 16 mph, the blue nozzle 11 to 19 mph, the dark red 13 to 22 mph, and the red 15 to 26 mph.

    The best choice for a typical air-induced tip would be the lilac 025 size, since it would meet the target speed of 13 mph at a perfect 60 psi, about right for nozzles of that size, and allowing some travel speed flex on the slower side.

    Some operators try to extend that range, but dropping below 30 psi will likely result in too narrow a pattern, or too coarse a spray quality, so it’s not advised.

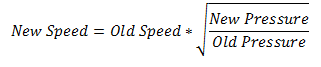
    Note that the three-fold change in pressure from 30 to 90 psi translates to only a 1.73-fold change in travel speed. That’s due to the square-root nature of the relationship, as illustrated by this formula:

    Pressure Formula

    This exercise applies to sprayers with rate controllers that adjust pressure to regulate flow rates. However, if you use pulse-width modulation (e.g. Case AIM Command, Capstan Sharpshooter, Raven Hawkeye, or TeeJet DynaJet) check out this article describing these systems.

    There are a number of apps and websites, usually developed by nozzle manufacturers, which provide similar answers. These are also very useful, and all of them rely on the same formulas used in our new, simplified table. You can go here to download a high resolution version, suitable for framing, in both US and metric units.

  • An Easier Way to Clean Your Sprayer

    An Easier Way to Clean Your Sprayer

    Farming can be divided into pleasant and unpleasant tasks.  Seeding is pleasant.  Hauling oats or barley not so much.  Sprayer cleaning is…not.  And yet it’s the unpleasant tasks that are often the most important.  How can we make them better?

    We all know the need for a properly cleaned sprayer.  Herbicide residue can harm a sprayed crop, and the damage might not show up for over a week.  When it does, it usually takes a while to identify the symptoms and damage patterns to be sure.  And then we wait for the inevitable yield loss.

    It wasn’t long after the introduction of the Group 2 Mode of Action that producers started noticing how even small residues of these products in sprayer tanks could damage crop yields, most noticeably canola, but also other broadleaf species.

    Thirty years later, the problems persist.  Let’s look at ways of preventing them.

    Cleaning a sprayer is a lot like doing the dishes.  Using the right detergent, soaking the hard stuff, being thorough, and rinsing properly – they all matter.

    It all starts, though, with preventing the problem.

    The main culprits that cause sprayer contamination have the following properties:

    • They are typically dry formulations,
    • they typically have poor water-solubility, and
    • they are potent in low doses.

    Many products in herbicide Group 2 MOA fit that bill.  The ones that rise to the top of the list have an additional characteristic:

    As a subgroup within the Group 2 MOA, the sulfonyl ureas are a top concern, with products like Refine, Express, and Ally on the most-wanted list. Another problem subgroup is the triazolopyrimidines, containing products like Frontline and Simplicity, which, like the SUs, have very pH-dependent solubilities (better solubility at higher pH). Other Group 2s have fewer issues. Everest and Varro have good overall water solubility, for example.  The solubility of imidazolinones like Odyssey, Pursuit, Raptor increases with low pH. We tend to see fewer problems with these products.

    Instances that add to the problem involve tank mixing with weak acid herbicides, including glyphosate, but especially those that are formulated as emulsifiable concentrates (oils, EC), appearing milky when mixed with water.  Most of our herbicides are weak acids.

    Two problems occur with these:

    • The weak-acid herbicide lowers the pH of the spray mix, possibly reducing the solubility of the problematic Group 2s.
    • Then, oily formulation can adhere the herbicide to plastic and rubber sprayer parts such as tanks, connectors, and hoses.

    The best advice on preventing a cleanout problem, is, therefore, to make sure the product is fully dissolved or suspended.   Proper mixing technique and time are the key components.  Some products, like Simplicity, can benefit from a pH increase (adding ammonia) prior to mixing the product.

    Once properly mixed, we can still have problems at the screens. Dry formulations require a screen mesh of 50 or coarser according to their labels.  But many sprayers contain 80 mesh screens, some even have 100 mesh.  All screens should be inspected both before, during, and after spraying these products.  Screen residues cause longer-term contamination, and their cleaning is an important part of this whole process.

    After spraying, the cleaning process relies on three main things:

    1. We need to remove as much of the problem mixture as possible.
    2. We need to dilute the remainder as much as possible and use it to clean the boom plumbing.
    3. Ensure anything that came in contact with spray mix has been cleaned.

    Removing the mixture

    The best way to remove the remainder is to spray it out in the field you’ve just treated.  You can overspray some products again, or if you have any land set aside it can be used for this purpose.  It’s never a good idea to drain the tank on any land.  Obviously, some experience and math is helpful to make sure the last tank empties nicely on the field.

    Diluting the remainder

    The next step is to dilute the remainder, using tank cleaning adjuvants like ammonia (this raises the pH and helps remove those products whose solubility benefits from this) and detergent (this removes the oily layer formed by EC formulations).  Commercial cleaners like All Clear or Cleanout combine these properties in one jug.

    Diluting is most effective when done in multiple smaller batches, as long as we can ensure the tank walls are reached.  Wash-down nozzles installed in the tank can do this for us.

    Let’s assume the sprayer has a 150 gallon clean water reservoir.  It’s tempting to empty the whole thing into the tank.  We can calculate the diluting power of this:  if we had a 10 gallon remainder in the tank and added 150 gallons water, the remainder would be diluted by a factor of 16.  After spraying this out, we’d then have to re-fill the rinse tank if we wanted to do more.

    If we rinsed in two 75 gallon batches (add 75 gallons, agitate via wash-down nozzle, spray out, repeat), we would dilute by a factor of 72.  If we did three rinses of 50 gallons each, our final dilution factor would be 216.  That’s the same dilution as adding about 2150 gallons to the first 10 gal spray tank remainder, and is about 14 times better than dumping the whole 150 gallons in at the beginning!

    An improvement in diluting power can be achieved by adding a separate clean water pump.  Introducing clean water to the tank as rinsate is sprayed out the boom reduces water use even further.

    Cleaning all spray mix contact points

    The last step is to pay attention to the things you can’t see: Screens, boom lines and boom ends. The total interior surface area of black rubber boom hoses on a 100 ft sprayer with 7 sections can be as much as several square metres, and this surface can bind residues. Seven sections, each with boom ends, can hold several gallons, as well as accumulated debris. Scrubbing screens, soaking boom lines, and flushing boom ends is the necessary detail that this job requires.

    A few final pointers:

    • Adding a surfactant or a commercial cleaner can generate a lot of foam. Have de-foamer handy, it will save a lot of frustration.
    • A bucket helps collect and clean screens and nozzles.
    • Consider upgrading to more steel components on your next sprayer – tanks and booms. Stainless steel cleans faster than plastic.
    • Install a way to flush your boom ends. Traditional ball valves do the job, but Hypro’s Express Nozzle Body End Caps do it automatically. These inexpensive units eliminate the dead space in boom ends and as a bonus, bleed air from the lines on the go.
    Hypro's Express Nozzle Body End Caps on a short length of stainless boom.
    Hypro’s Express Nozzle Body End Caps on a short length of stainless boom.

    Done well, sprayer cleaning doesn’t have to be unpleasant. And it certainly results in a better night’s sleep.

  • Increase Sprayer Productivity Without Driving Faster

    Increase Sprayer Productivity Without Driving Faster

    Timing trumps most things in crop protection. A great spray applied at the wrong time isn’t nearly as valuable as a mediocre spray at the right time. So how do we improve our ability to get things done at the right time?

    Often, we try to win races by driving faster. In our last article, we looked at driving speed and concluded that faster speeds can lead to more drift and less uniform deposition. Driving slower can be viewed as a sort of insurance policy: You may not notice the benefits right away, but on days when that extra bit of performance is required, you’re covered.

    So how do you get the job done quickly if you can’t drive faster?  To answer, we have to look to other opportunities for boosting productivity.

    Recently, we built a model to capture all the elements of a normal spray operation that affect timeliness. These were:

    • travel speed
    • boom width
    • tank size
    • water volume
    • field length
    • number of headlands
    • turning speed
    • fill time

    First, we identified a reasonable base condition. For the sprayer, that was a travel speed of 14 mph, a 90’ boom, an 800 gal tank, a 10 gpa water volume, and a 20 minute fill time. Then, we set up a typical field situation, which was spraying a half-mile run on a quarter with two sprayed headlands and a turning speed of 8 mph. Finally, we changed one factor at a time to determine its relative importance.

    Before we discuss the results, let’s make it clear that just because changing some of these factors improves productivity doesn’t mean we’re recommending them! For example, adequate water volume remains an important input that improves coverage and permits the use of low-drift sprays. Larger tanks increase compaction and take more power, and so forth.

    Here’s what we found:

    All productivity values were expressed as acres per engine hour. For this reason, our numbers will be lower than what a typical sprayer monitor reports, most of which calculate acres per spraying hour.

    For the base condition, the sprayer spent 15% of its driving time turning, and 37% of its on-field time stationary (i.e. filling).  For every hour spent on the field, less than half the time (48%) was spent spraying. This resulted in an average productivity of 82 acres/h.

    Increasing the spray speed to 18 mph increased average productivity to 93 acres/h, but it also increased the proportion of time spent turning and loading, resulting in just 40% of the field time spent spraying.

    Decreasing the loading time from 20 to 10 minutes reduced the proportion of field time spent stationary to 23%, covering 100 acres/h at 14 mph. Surprisingly, this was the productivity-winner, resuling in 62% of on-field time spraying.

    We discovered other powerful productivity factors, and chief among them was boom width. A 33% increase in boom width from 90’ to 120’ gave a productivity boost to 94 acres/h, close to the same result as increasing the travel speed to 18 mph earlier. Similar side effects occurred: more time turning, and a greater proportion of time filling, as we saw with faster travel speeds.

    Boom width seems to have some room for growth.  Many smaller European counties use wider booms than we do in North America, for example.  With gps guidance and large fields, we have excellent conditions for their implementation.

    Two other factors that had similar effects to fill time were water volume and tank size. Less water and larger tanks increased productivity by decreasing the fill frequency, with effects similar in magnitude to speeding up the fill time. Decreasing the water volume from 10 to 5 gpa increased productivity to 100 acres/h by decreasing the proportion of time the sprayer was stopped from 37% to 23%. Increasing from an 800 to a 1,200 gallon tank increased productivity to 94 acres/h, again by decreasing the proportion of time spent filling to 28%.

    Taken together, a sprayer with a 120’ boom, a 1,200 gal tank, applying 10 gpa and filling in 10 min had an average productivity of 132 acres/h. And this was achieved without driving faster than 14 mph. If you can string two quarters together and drive a whole mile before turning, that number rises to 145 acres/h, a surprisingly large 13 acres/h gain.

    The perspective of minimizing downtime extends to other tasks, too:

    • Be more prepared for the job by reviewing the product label in advance, noting the correct mixing order.
    • Keep extra nozzles, clamps, and nozzle bodies in the cab.
    • Don’t clean plugged nozzles, replace them.
    • Use low-drift nozzles so a small increase in wind doesn’t shut you down.
    • Ensure all the products needed are on the tender truck (e.g. pesticide, adjuvant, tank cleaner, anti-foamer, etc.).
    • Consider switching to 3” plumbing (pump rates of 300 – 400 gpm are possible).
    • Make sure your inductor won’t be the limiting factor. For example, product pumps can be awfully slow when the product is cold. It might be worthwhile to explore a venturi system.

    Speeding up the fill process is a good idea, but be careful with certain products. Dry materials such as the sulfonyl ureas (e.g. Refine, Express SG, etc.) and some fungicides (e.g. Astound, etc.) require time to hydrate in water so they mix properly. Some operators pre-hydrate these in a smaller tank, while others get an extra tank to pre-mix whole loads and simply transfer them over.

    Also think about the time spent cleaning the sprayer. Thoroughness is important, but perhaps there are efficiencies to be gained there as well, like never letting a sprayer sit after spraying. We’ve written about continuous rinsing, for example, to improve cleaning speed and effectiveness.

    So, the quicker we can spray, while ensuring a quality job, the more effective our crop protection practices will be. We encourage you to use our to determine your best configuration.

    Got a productivity tips to share? Let us know! And remember: In spraying, the race is won in the pits.

    Factor

    Base

    Drive Faster

    Fill Faster

    Spray Wider

    Less Water

    Bigger Tank

    New Sprayer

    Travel Speed

    14 mph

    18 mph

    14 mph

    14 mph

    14 mph

    14 mph

    14 mph

    Fill time

    20 min

    20 min

    10 min

    20 min

    20 min

    20 min

    10 min

    Boom Width

    90 ft

    90 ft

    90 ft

    120 ft

    90 ft

    90 ft

    120 ft

    Water Volume

    10 gpa

    10 gpa

    10 gpa

    10 gpa

    5 gpa

    10 gpa

    10 gpa

    Tank Size

    800 gal

    800 gal

    800 gal

    800 gal

    800 gal

    1200 gal

    1200 gal

    Field Length

    0.5 mile

    0.5 mile

    0.5 mile

    0.5 mile

    0.5 mile

    0.5 mile

    0.5 mile


    Time Turning

    15%

    19%

    15%

    20%

    15%

    15%

    20%

    Time Loading

    37%

    42%

    23%

    42%

    23%

    28%

    19%

    Time Spraying

    48%

    39%

    62%

    38%

    62%

    57%

    61%

    Acres/h

    82

    93

    100

    94

    100

    94

    132

  • How Fast Should I Drive My Sprayer?

    How Fast Should I Drive My Sprayer?

    It seems simple: The faster you drive the sprayer, the more area you cover. This makes higher travel speeds a seductive method for improving productivity. Sprayer manufacturers knew this 25 years ago when pull-type sprayers first received bigger, suspended outrigger wheels. Since then they’ve delivered more powerful engines, better hydraulic motors, smoother suspension and cruise control.

    Each of these innovations still required the operator to consider the relationship between travel speed, pressure, nozzle choice and the desired output per acre. But now we have rate controllers, and we don’t have to think about such mundane things anymore… do we? Do we still do a good job if we go faster? What exactly happens when we speed up?

    Before considering the role of the rate controller, you have to decide on an overall target-speed range. Charts, apps, or online tools can help you select nozzles sized to deliver your application volume at a given speed and pressure. This initial travel-speed decision requires an understanding of how spray gets delivered to the target. Let’s start with the spray boom.

    As the boom moves through air, the oncoming air does three things to the spray:

    • It shears the spray, making it a bit finer.
    • It scrubs the smallest droplets from the pattern, leaving them in the wake of the boom.
    • Finally, negative pressure behind the pattern sucks even more fine spray into the sprayer wake.

    Collectively, these create the dreaded “spray plume” that hangs behind the spray boom… and we’ve lost control over it. The faster we move, the greater the proportion of the spray that ends up in the plume. This can be anywhere from one to 15% of the spray. Once formed, that plume moves with the prevailing winds.

    Today’s sprayers have wide booms, and faster speeds often require us to keep these booms higher than we have in the past to prevent impacts. But higher booms reduce our control over the spray’s direction. For example, when spraying vertical targets (e.g. wheat heads) we have begun to employ angled sprays. But droplets lose momentum quickly. The further they are from the target, the more likely they are to slow or even fall vertically before they reach the target. That means that higher booms often negate the benefit of angled sprays.

    Still not convinced of the perils of high speeds? Well, think about the aerodynamics of the sprayer itself. As travel speed increases, the sprayer, the boom, and even the spray pattern itself disrupt the air around it.  Visualize a sprayer in a wind tunnel with smoke tracer lines. The nice pattern created by the boom gets really messy in a turbulent environment. This can cause a loss of deposit uniformity, resulting in a reduction of overall effectiveness.

    So far, we’ve talked about average speeds – choosing to travel eight, 12 or 16 mph overall, and then choosing the nozzle that will suit. Now let’s talk about changes in your travel speed within your target-speed range.

    Operators know that even small travel speed changes can result in large pressure changes.  That’s because travel speed and pressure enjoy a “square-root relationship”. If you double travel speed, your rate controller needs to quadruple the spray pressure to meet the new flow need!

    Even minor changes in speed (to adapt to field conditions) can lead to big fluctuations in pressure, changing average droplet size, and affecting coverage and drift potential. Severe pressure fluctuations are more likely with a faster average travel speed. That’s perhaps why pulse-width modulation, which decouples spray pressure from travel speed and replaces it with a solenoid duty cycle, has a growing role in fast self-propelled sprayers.

    To minimize pressure fluctuations, use the pressure gauge as your speedometer. Have the boom pressure displayed prominently in your sprayer cab, and try to operate at speeds that result in a pressure which is optimal for the job you’re trying to do.

    So, let’s summarize the effects of fast travel speeds.

    Pros:

    • More area covered per hour
    • Better contact with vertical targets (if the booms are kept low)

    Cons:

    • More drift
    • Less uniform deposition
    • Wider pressure fluctuations

    So, how fast is too fast? We won’t draw a line in the sand, but we will emphasize how important it is to consider as much information as you can before deciding on a travel speed. Don’t rely on the rate-controller to think for you – it doesn’t have all the information.

  • Water Sensitive Paper for Assessing Spray Coverage

    Water Sensitive Paper for Assessing Spray Coverage

    Water Sensitive Paper

    Water-sensitive paper is a useful tool for assessing spray coverage.  Here are a few tips for making it work for you.

    Water-sensitive paper is manufactured by a number of companies, including Syngenta, Spot On, and WS Paper and is available for purchase (see here for comparisons). The papers are a useful tool for helping calibrate aerial and ground sprayers because spray deposition becomes visible immediately after spraying.  With the proper equipment, droplet size and coverage can be estimated from scanned images.

    Simply place the paper on or near the target of interest.  On most cases for herbicide application, it can be placed on the ground. It can also be attached to leaves or stems using paperclips.

    When water comes in contact with the paper, it turns blue, and spray droplets as small as 50 µm become visible.  Avoid touching the paper with bare hands except from the edges – you’ll see your fingerprints. Wearing gloves helps if you plan to handle many of them.  Wait for the paper to dry before storing or stacking.

    If left exposed to air, they will soon turn completely blue from atmospheric humidity. The same will happen if stored in a plastic bag before they are completely dry.

    To show how these cards can be useful for an applicator, we prepared 15 cards (five spray qualities at three water volumes each).  They can be used as a guide to assess the quality of the spray job. As a start, aim for a Coarse spray quality, and use enough water to achieve coverage about in the middle of the matrix. Avoid low water volumes in combination with extremely coarse sprays.

    These water-sensitive papers were sprayed under controlled conditions and they demonstrate the role droplet size plays in coverage. As the droplets get finer, there are more of them, increasing coverage. However, this is really only hypothetical as many drift off target before impinging. As the droplets get coarser, there are less of them, and coverage may be compromised. To compensate for this, higher volumes are used. Credit – Dr. T. Wolf, Saskatchewan.
    These water-sensitive papers were sprayed under controlled conditions and they demonstrate the role droplet size plays in coverage. As the droplets get finer, there are more of them, increasing coverage. However, this is really only hypothetical as many drift off target before impinging. As the droplets get coarser, there are less of them, and coverage may be compromised. To compensate for this, higher volumes are used. Credit – Dr. T. Wolf, Saskatchewan.

    This matrix can be used as a guide to assess approximate coverage of a spray under field conditions.

    A high-res pdf of the matrix (in US units) can be downloaded here.

    The metric version is here.

    The spray deposits spread out after they hit the paper, and as a result the deposit diameter is about twice the actual droplet diameter.  This ratio is known as the spread factor, and it must be known before an accurate droplet size measurement can be done.  That’s easier said than done because the spread factor depends on the properties of the spray liquid (surface tension, for example), the diameter of the droplet, and also the humidity at the time of the trial.  On humid days, the spread factor increases and in fact the papers may turn entirely blue just from exposure to that humidity.

    A practical water volume limit for making an accurate measurement is about 10 US gpa or 100 L/ha.  At higher volumes, the droplets coalesce and it’s hard to tell how many droplets for any given deposit.