
- Drone spray swaths are dynamic and irregular over distance; edges wander and width varies, so they are not a clean uniform ribbon.
- Single point tools like water sensitive paper capture moments, not two dimensional patterns, so they miss edge dynamics and along pass variability.
- Operational risk: irregular swaths cause gaps or overlaps, yielding patchy control and dose non uniformity, especially harmful with herbicides.
- Practical fixes: calibrate over distance, tighten swath spacing, increase water volume, slow flight, and validate in light wind conditions.
This text was generated by OpenAI GPT 5 Mini
Most operators assume drone swath widths are wide, stable, and predictable. That confidence generally comes from three places:
- Manufacturer specs, often broad, vague and dependent on working conditions, not to mention each drone model is different, and even two drones of the same model behave differently.
- Single point calibrations (water sensitive paper, Swath Gobbler, etc.) that are useful and display a 1-dimensional point-in-time snapshot of the swath.
- “Looks good from the ground.” Watching a plume from below often makes it feel wider than it is.
But drones move through space and time; spray patterns evolve as they fly. What you think is happening in the two seconds you glance up is not what’s happening over a 50 metre pass. The following video shows a multi-drone comparison where three drones apply 20, 50 and 100 L/ha.
Why Single Point Methods Fall Short
This isn’t a criticism. Water sensitive paper (WSP) cards and tools like Swath Gobbler™ are valuable. But they are 1-D snapshots of a 2-D, time-evolving problem. WSP captures a moment, not a pattern. Swath Gobbler™ helps visualize centre mass but can’t show edge dynamics or how edges wander along the pass.
Real deposition and uniformity depend on:
- Flight parameters (altitude, speed, droplet size)
- Ground or crop size and shape
- Path stability and lane keeping of the aircraft
- Continuous micro corrections the aircraft makes
- Gusts, even in “light” wind
- Onboard wind compensation behaviour
We noticed an observation from the field: gusts → aircraft corrections → amplified drift. If a left-side gust pushes the aircraft, the autopilot often dips into the wind to hold course. The nozzles are mounted to the airframe, so that slight tilt can direct spray downwind, in the same direction the gust is pushing, amplifying drift rather than cancelling it.
Hidden Message: Many operators are doing their homework. At SDEUC 2026, I was impressed by how many pilots were calibrating and said they “knew” their drone’s pattern. My data suggests your drone may be subtly lying to you – its pattern shifts as it moves through air over distance.
What Happens Over 50 m: The Swath You Weren’t Expecting
The setup matters, because without context, a lot of people will assume the pattern you’re about to see is an artifact. It’s not. It’s the result of a controlled, repeatable field experiment designed specifically to expose real-world swath behaviour.
During August–September 2024, we conducted clopyralid herbicide application trials in soybean, a crop that is extremely sensitive to clopyralid. Even a trace amount causes clear visual symptoms four weeks after application, which makes soybean a perfect bio indicator of spray deposition. (I jokingly call this sensitivity the “touch of death” because it reveals every detail.)
We used a DJI T50 to apply Lontrel™ XC (clopyralid) at the highest labeled rate (300 g ae/ha) across three water volumes (20, 50, 100 L/ha) over 100 m long field plots. From each pass, a continuous 50 metre analysis zone was extracted to see how the swath behaved over distance (Table 1).
| Category | Details |
| Crop | Crop Soybean (highly sensitive to clopyralid, ideal for visualizing deposition) |
| Herbicide | Lontrel™ XC (clopyralid) @ 300 g ae/ha (highest labeled rate) |
| Equipment | DJI Agras T50 with rotary atomizers |
| Spray Altitude | 3 m above canopy |
| Water Volumes | 20 L/ha, 50 L/ha, 100 L/ha |
| Droplet Size | 300 µm (rotary atomizer setting) |
| Flight Speeds Achieved | ~7.0 m/s (20 L/ha), ~6.9 m/s (50 L/ha), ~4.2 m/s (100 L/ha) |
| Plot Dimensions | 10 m wide × up to 110 m long (location dependent) |
| Analysis Window | Central 50 m (avoids acceleration/deceleration effects) |
| Wind | ~5 km/h (cross wind) |
| Data Extraction | DroneDeploy orthomosaic → continuous 2 D swath visualization |
Now, here’s what the swath actually looked like over 50 m (Figures 1 and 2):
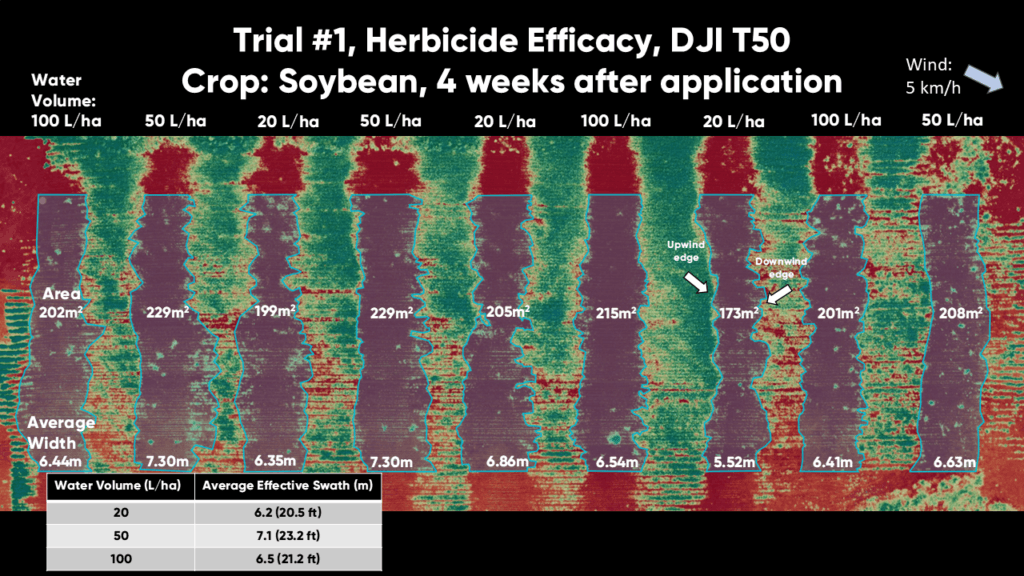
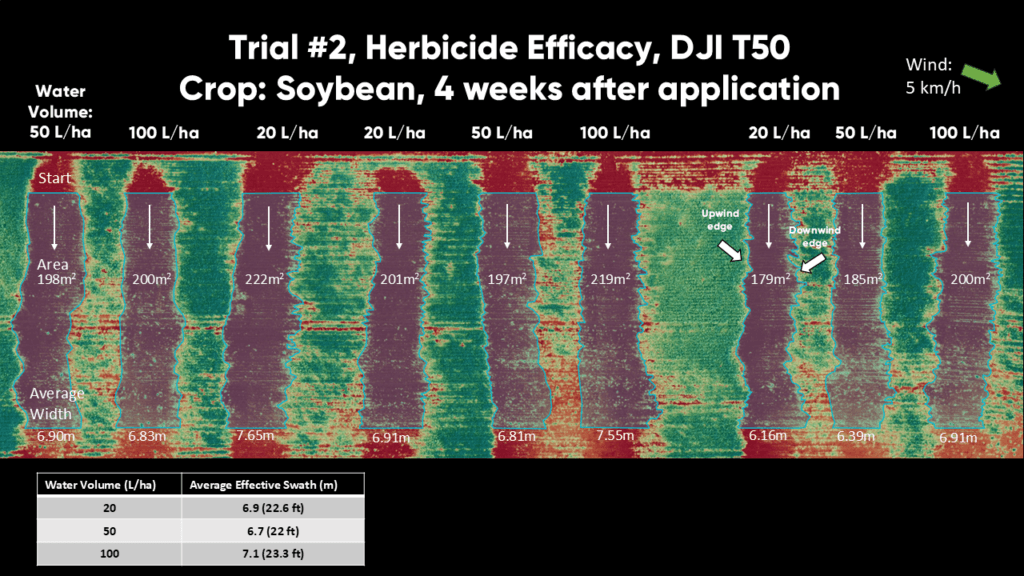
What becomes immediately obvious is that this is not the clean, geometric ribbon many expect. Here’s what the 50 m swath showed:
- Despite all the drone consistently flying north to south in a straight line, the path of efficacy isn’t consistently straight, appearing to subtly be affected by the wind.
- Within the path, the edges are also not straight, the upwind edge can often appear jagged. Each “tooth” could correspond to a micro correction the drone makes to hold course. The downwind edge adds a frayed or tattered look, not as clean of a boundary, likely caused by drifting spray.
- The width changes along the pass. Some sections widen, while others pinch inward. It would be unlikely to see these 2-D effects with 1-D sampling such as WSP cards.
- The plume tail wanders. The airborne portion of the spray oscillates left and right in response to gusts and minor stability corrections.
- The pattern is asymmetric. Left ≠ right. Upwind ≠ downwind. A drone swath is not a mirror image, and each pass is different.
The bottom line: A drone’s real swath is not a clean bar of colour, it’s an irregular coastline. And once you visualize it in 2-D over 50 m, the story becomes clear: swaths are dynamic, variable, dependent on conditions, and often narrower than manufacturer recommendations.
Why I Think It Looks Like This
It’s not that drones are bad sprayers; it’s that their reality is dynamic. 2-D imagery simply reveals what single point tools cannot:
- Drones are constantly making tiny left/right/forward/back corrections to counter act the forces (mostly wind) acting on them.
- The wind and the resulting corrections of the aircraft slightly change where the spray actually travels.
- The downwash column shifts with the aircraft’s posture.
- Even light wind (< 5 km/h) is enough to expose these shifts.
The Wandering Swath and Jagged Edge Problem: Swaths Don’t Fit Together Like Shark Teeth
This is where mis-set swath widths come back to bite. When you slide one measured swath against its neighbour, the non-linear path and jagged edges don’t interlock. Some spots show metres of overlap; others flirt with gaps. The following video shows us sliding a measured 2-D swath polygon until it just touches the neighbouring swath. Note how irregular edges force uneven overlap and occasional near misses.
Operationally, if you rely on the widest advertised swath—or on a single clean snapshot—two things happen:
- Misses (especially with herbicides): escapes, patchy control.
- Dose non uniformity: some areas get 0x, others 2x.
Sure, the average across 160 acres may equal the target rate, but field level uniformity is not icing-smooth.
Practical Recommendations You Can Use Tomorrow
These are observational, conservative, and based on what the 2-D data actually shows:
1. Calibrate, test in your conditions, over distance
Run a long test strip and evaluate coverage continuously (not just a few cards). Evaluate in many wind conditions, to best understand your swath variance given the situation.
2. Tighten your swaths beyond what’s stated in the brochure
Depending on the application and product, plan for more overlap than the manufacturer’s suggested swath width. Adjust from there with your own measurements.
3. Different jobs, different risk tolerance
- Herbicides: misses are costly → tightest spacing.
- Fungicides: somewhat more forgiving but still benefit from stability and overlap.
4. Faster (7 m/s) with lower water volume displayed more variable swath
Higher water volumes direct in a large amount of water being pushed down within the downwash resulting in less drift and more consistency. This coupled with slower flight = fewer corrections = a straighter, more consistent swath.
- At ~5 m/s, droplets fall mostly into the downwash beneath the drone, deposition is close to the flight line.
- At ~9 m/s, the airframe tilts forward to hold speed. The nozzles are slightly tilted back and the spray is deflected backward, it trails the drone like Superman’s cape.
- Downwash is no longer straight down.
- Coupled with the flight speed, the downwash is no longer pushing the spray into the canopy.
- Deposition lands farther behind the drone.
- Small gusts now matter more.
- A backward angled plume has more side profile for crosswind to grab. The following speed comparison (same drone, two speeds) illustrates this effect:
- Downwash is no longer straight down.
5. Respect “light” wind
The imagery shows meaningful edge change and drift even in 5 km/h. Even the ‘gusts’ in light wind move the swath. In relatively calm days continue to watch variability, plan overlap, and validate.
Conclusion – Know the Swath You Actually Have
Drone spraying is promising and can be very effective and is getting better fast. Fit the setting with the task. If there is less room for error (herbicide), tighten those swaths to prevent misses caused by the wandering swath. Swaths are often misunderstood when we only look at single points.
When you test over distance and see the 2-D pattern:
- Coverage becomes more reliable
- Reduces misses
- Efficacy gets consistent
- Confidence rises
The first step to improving application is knowing the real shape of your swath. Tighten spacing, higher water volumes, slow down when you can, validate in your own conditions, and keep learning as the technology evolves. Spray drone technology is rapidly evolving, and many of today’s limitations will be addressed with innovation.