We’ve identified and discussed shortcomings in the content and design of today’s pesticide labels in an earlier article. From the perspective of the spray applicator, the information needed most often can be difficult to locate, anachronistic, contradictory, subjective or even missing from the label altogether. To truly encourage an applicator to read and follow the label we need a consistent, concise and clear format that summarizes critical content.
To that end, we have worked with growers, university/government extension and industry to develop a prototype we’re calling the “Label Summary Sheet”, or LSS for short. We presented the concept in a series of public presentations in western Canada as part of the RealAgriculture TechTour Live event in 2018. You can watch a recording of part of that event at the end of this article.
The LSS does not replace or interpret the current label, which is a legal document. It is a summary intended to accompany it. At this stage the LSS is simply a proposal. These documents are not intended for use right now; we hope they will grow and change for the better as they stimulate discussion.
Consider this metaphor: You have just purchased a laptop. When you unbox it, you get an in-depth instruction guide that covers everything from operation to trouble shooting and includes all the legal riders. It’s a daunting technical document that you likely won’t read unless something goes wrong. Knowing that, manufacturers include a graphic and accessible quick start-up guide that summarizes the most common and critical issues. It doesn’t replace the instruction manual, it just augments it. If you can’t find what you need in the quick start-up guide, you are referred to the more fulsome description in the instruction manual. Think of the pesticide label as the instruction manual and the LSS as the quick start-up guide.
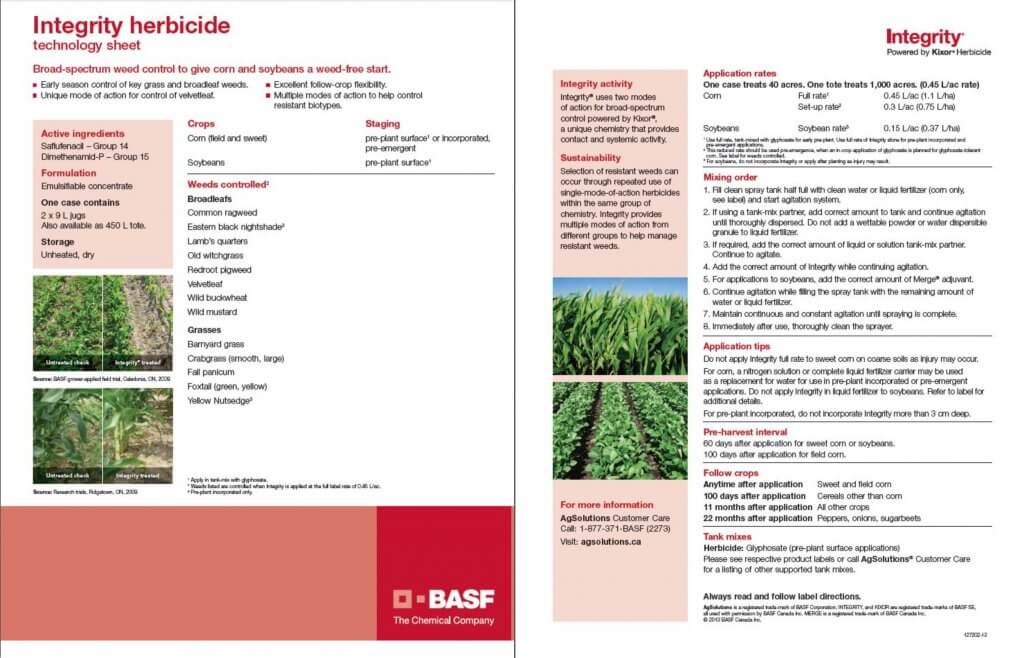
Some agrichemcial companies recognize this need and have developed short documents to summarize key aspects of the label, but they are inconsistent and brand-specific marketing documents that do not always contain the information we are proposing. Here, for example, is the technology sheet for Integrity herbicide.
We tested the versatility of our LSS format by summarizing four diverse pesticide labels. Our selections are not intended to imply that these labels are particularly deficient. Only that they are commonly used, somewhat complicated and represent the spectrum of pesticide categories and application methods.
Download and look at the variety of labels we have summarized as examples. They are available here:
Note that each LSS features the same section headings and a relatively consistent layout, no matter the manufacturer. Generic icons are used to illustrate content and make it easier for users to navigate without language barriers. The LSS are black and white to facilitate reproduction and refer back to their respective pesticide labels (i.e. the online PDF, not the booklets that come with the pesticides).
LSS Sections
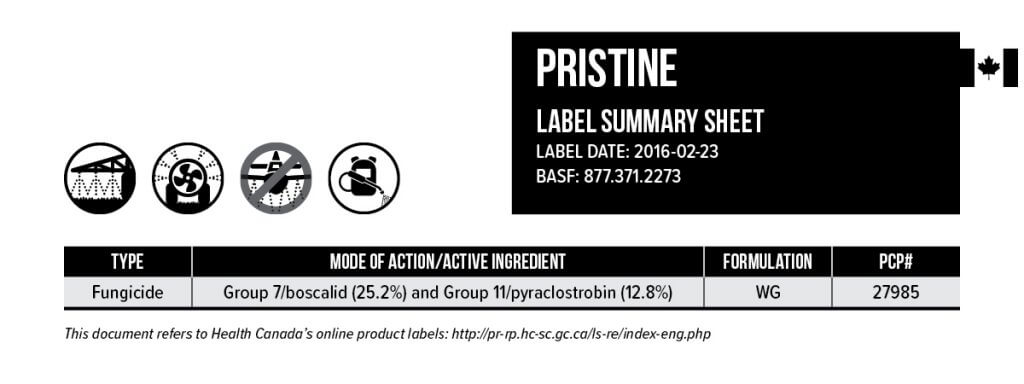
Here is the Pristine LSS broken down by section to highlight the key features.
1. Banner Section
The banner is at the top of every LSS. It gives the commercial product name and the date to ensure the LSS reflects the current pesticide label. Four icons represent the most common application technologies: Horizontal boom sprayer, airblast, aerial and handheld. If an application method is prohibited, a banned symbol appears (such as aerial in this case). Note we have left room for RPAAS (UAV’s) anticipating the day we have products registered for that technology. The table notes the type of pesticide (e.g. fungicide, insecticide, adjuvant, etc.). The mode of action and active ingredient(s) are noted, as well as the formulation and the Pest Control Product number.
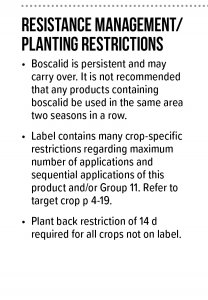
2. Resistance Management / Planting Restrictions
Intended to provide key information on managing pesticide resistance, this section reflects label content about carry over and the rotation of active ingredients. Further, to aid in application decisions, it reflects any restrictions around maximum number of applications, sequential applications or plant back issues following use.
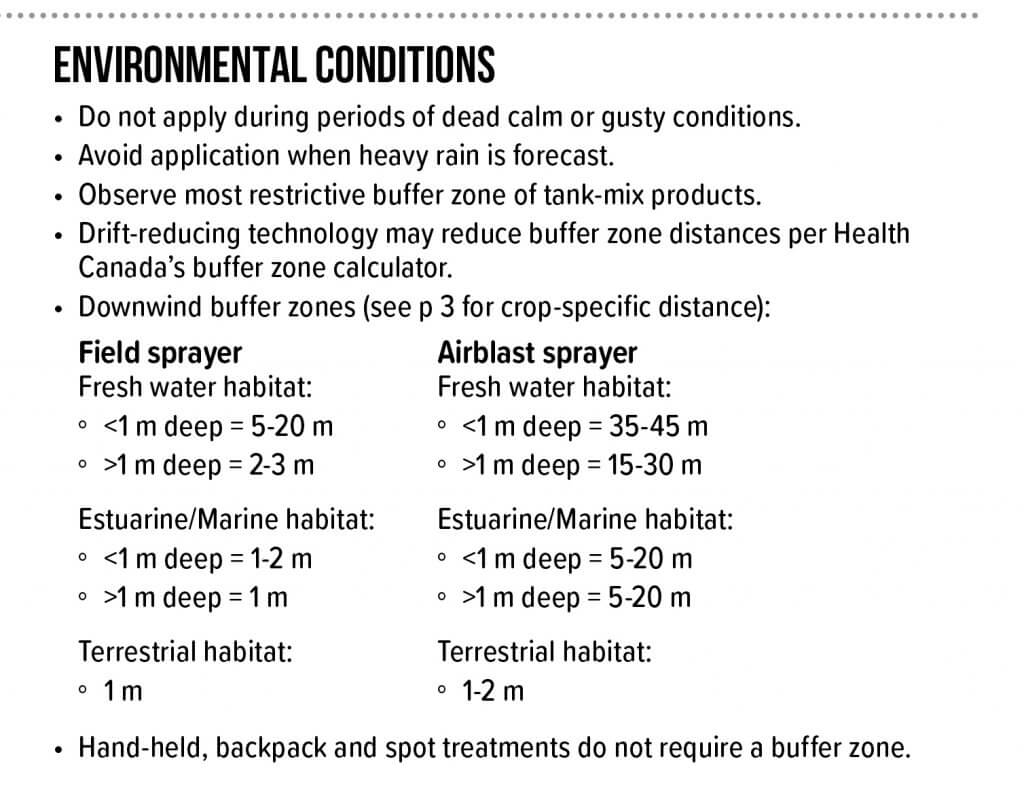
3. Environmental Conditions
Any restrictions regarding weather conditions during or after application are noted here. This includes set-backs or buffer zones that reflect method of application and the nature of the adjacent or downwind area in question.
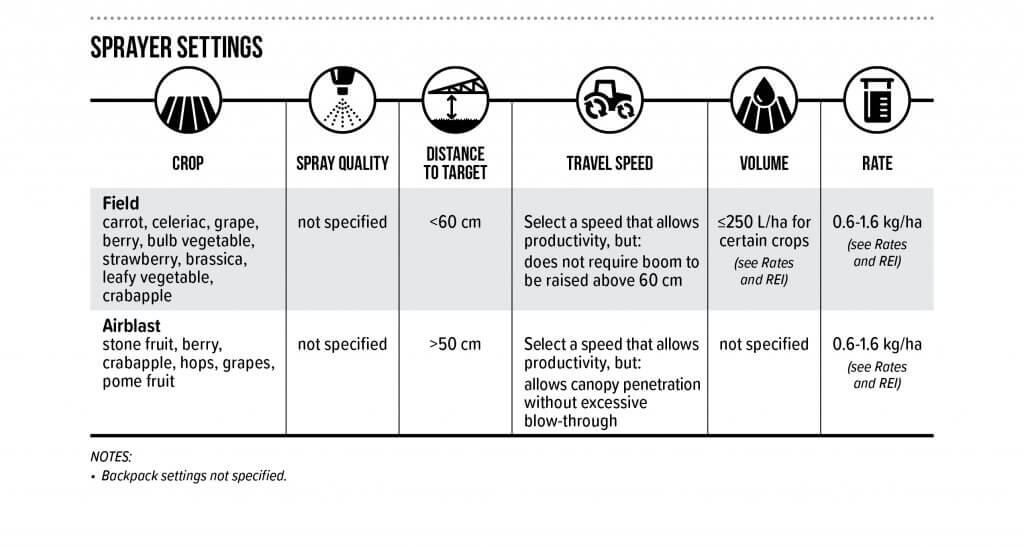
4. Sprayer Settings
This section includes the six most commonly asked questions an applicator has when calibrating or adjusting their sprayer prior to use. It is organized by target crop and method of application. When the label provides a high level of detail, the user is referred to the correct page. Note the use of graphics to quickly direct the reader to the information they need. Any additional qualifications found in the label relating to sprayer settings are indicated in the notes beneath the table.
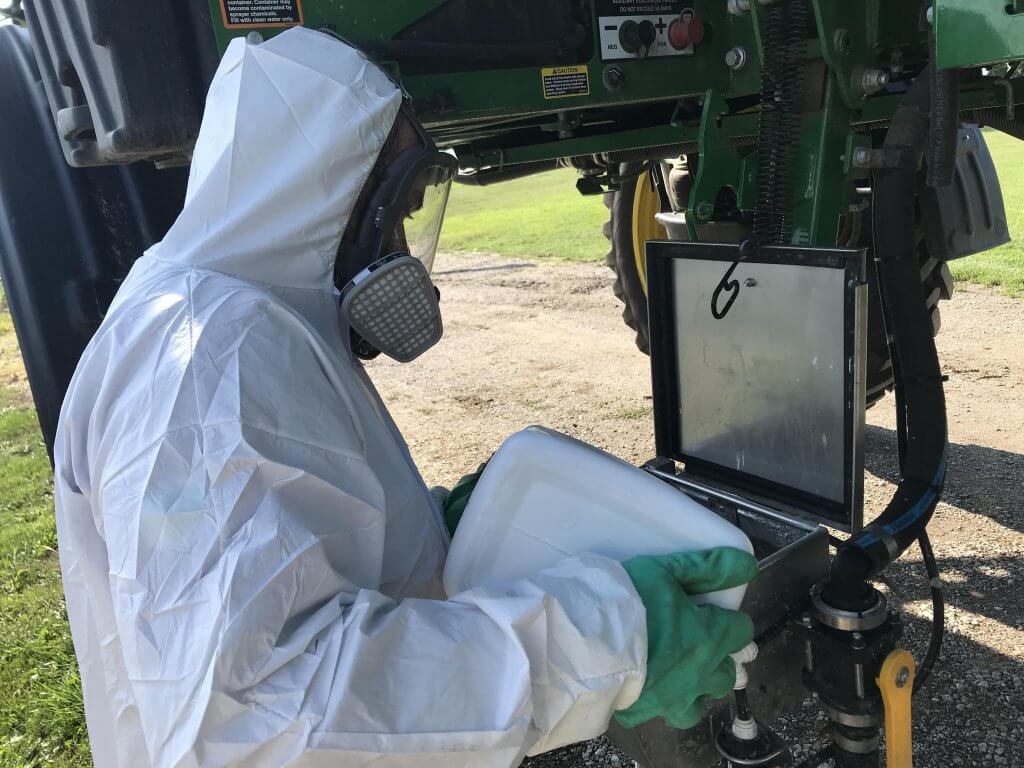
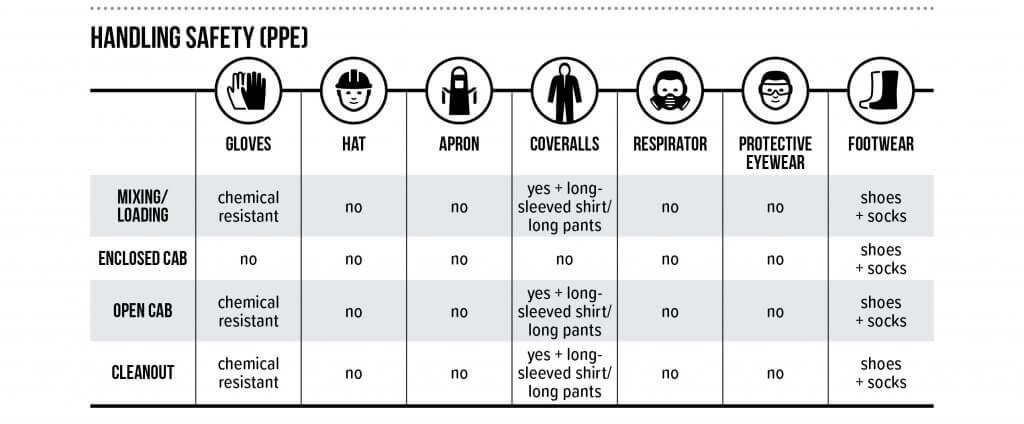
5. Handling Safety (PPE)
The concept for this simple and graphic table originated in France, and was communicated to us by Dr. Carol Black of Washington State University. This unambiguous format encourages the use of PPE while ensuring the handler uses the appropriate level of protection for each activity.
6. Mixing
As operators tank mix more products to curtail resistance, improve efficacy or improve productivity, there is a greater chance of chemical or physical incompatibility. This section summarizes any restrictions noted in the label. Learn more by downloading Purdue Universities’ publication “Avoid Tank Mixing Errors“.
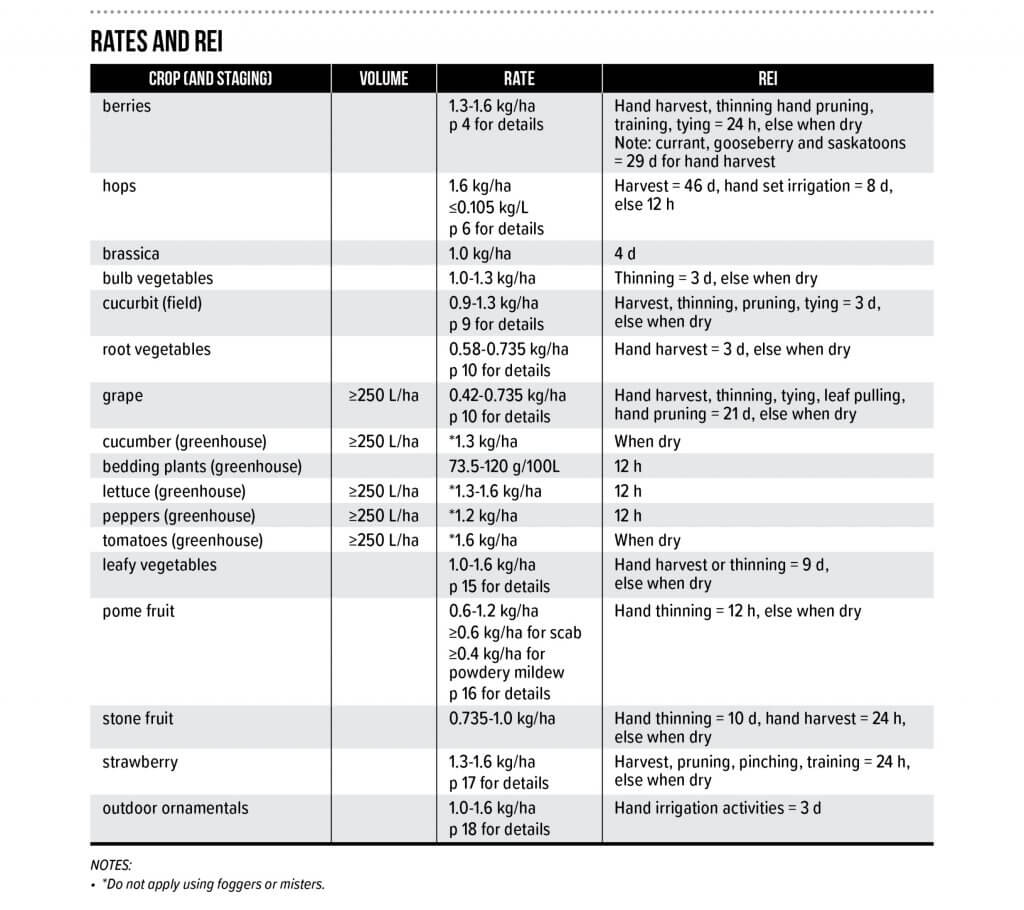
7. Rates and Restricted Entry Intervals
This table can be quite complicated depending on the pesticide label. It summarizes the rates, volumes and restricted entry intervals by crop. It reflects the broadest range of product rates listed in the label. Restricted entry duration is affected by the post application activity, and this is captured in the REI column. If more detail is required, the user is referred to the appropriate page(s) of the label. Any additional qualifications found in the label relating to rates, volumes or REI are indicated in the notes beneath the table.
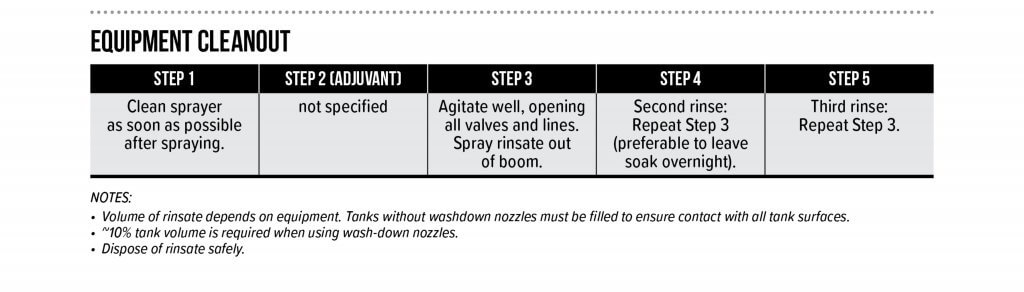
8. Equipment Cleanout
Finally, equipment cleanout is summarized (where possible) in a sequence of steps. When the pesticide label is silent on the cleanout procedure, the user is provided with the triple rinse protocol, which is generally held to be the industry best-practice.
Adoption
To date, this proposal has been made to Croplife Canada, the American Society of Agricultural and Biological Engineers (ASABE), an International Organization for Standardization (ISO) mirror committee (Equipment for crop protection) and more than 1,400 growers and stakeholders across Canada.
Our suggestion for adoption of the LSS (in its current form or something similar) is that regulatory agencies commission a working group comprised of representatives from grower groups, industry and government to oversee the process. The working group would support registrants as they populate (or update) the LSS template when a new product is submitted for registration, or as part of the natural review cycle.
Should the registrant encounter duplicate, missing or contradictory information while completing the LSS, it should be considered an opportunity to remedy the problem on the pesticide label. This will clarify the safest and most effective use of the pesticide for the applicator, who is currently forced to selectively ignore or interpret such errors. To our minds, this was the intent of the original labelling system, and the inclusion of the LSS is a simple and effective way to achieve that goal.
The Confusicol Sketch
In 2018 we participated in Real Agriculture’s TechTour Live event that toured four major cities in Western Canada in four days. We presented the “Confusicol sketch” as a light-hearted way to open a discussion with the audience on the strengths and weaknesses of Canadian pesticide labels and how the Label Summary Sheet might be a viable supplement. Here’s one of the live takes, warts and all. Turns out live sketch comedy is tricky…
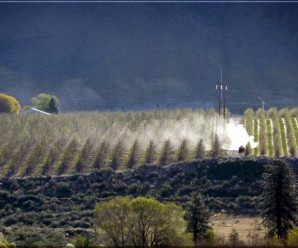
In 2014 one of our OMAFRA summer students designed a short-and-gritty demonstration using a backpack sprayer, a variable-speed fan and some water-sensitive paper positioned downwind at 1.5 metre intervals. The intent was to illustrate how sprayer operators could reduce the potential for off-target drift by recognizing and accounting for three factors:
Apparent wind speed (i.e. the sum of wind speed and travel speed)
Boom height (i.e. release height)
Droplet size (i.e. nozzle spray quality)
Apparent Wind Speed
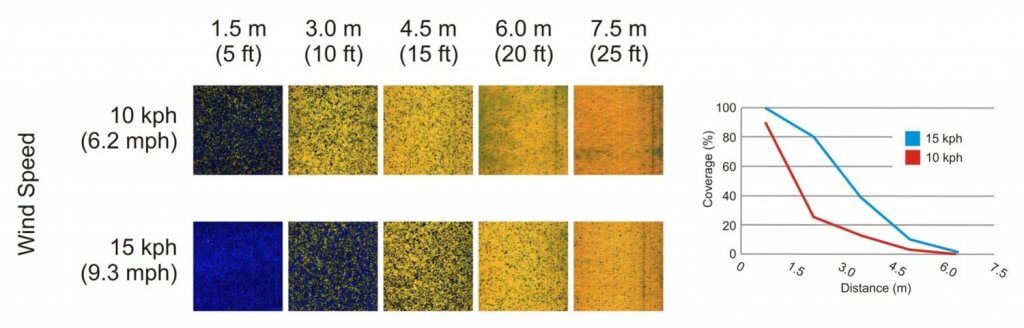
Spray operators know they should not spray when the air is calm or when the wind is too high, but they often forget that the nozzles experience “apparent wind speed” which means driving 10 km/h into a 10 km/h headwind is essentially spraying in a 20 km/h wind.
The result of spraying with a Medium spray quality in 10 km/h and 15 km/h wind: water-sensitive papers indicated that there is more downwind drift in higher winds.
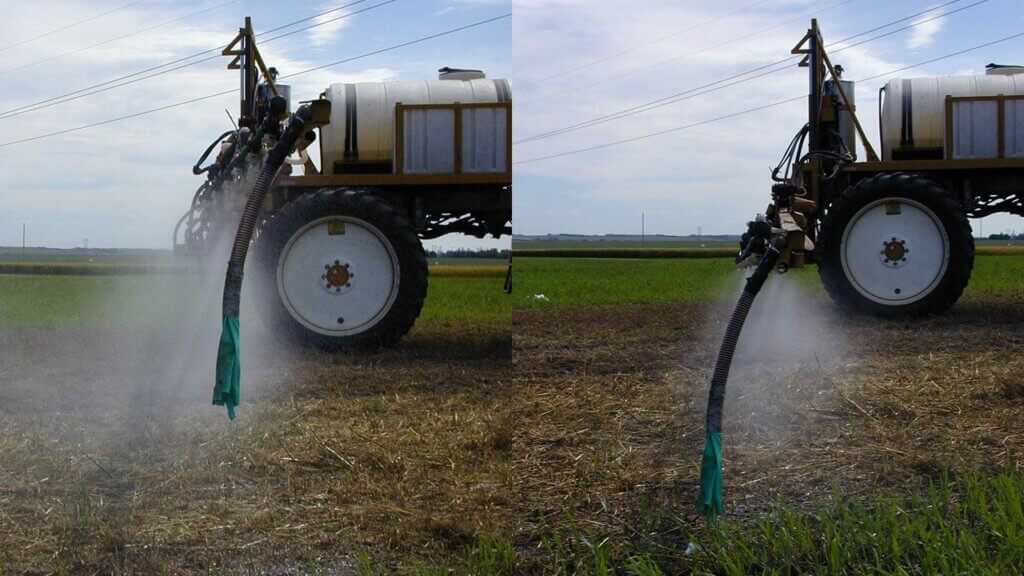
Boom Height
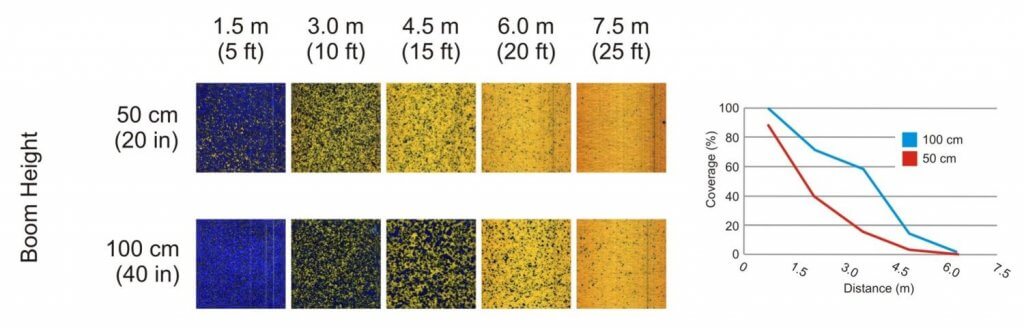
Spray operators raise their booms to ensure their nozzles clear the crops, but this contributes to off target drift and greatly reduces coverage – particularly when using twin-fan style tips. Dr. Tom Wolf explains how to set your boom height here, or you could watch one of our Exploding Sprayer Myths videos on the subject.
The result of spraying with a Medium spray quality in a 10 km/h wind at 50 cm and 100 cm from the ground: water-sensitive papers indicated that downwind drift increases as the boom gets higher.
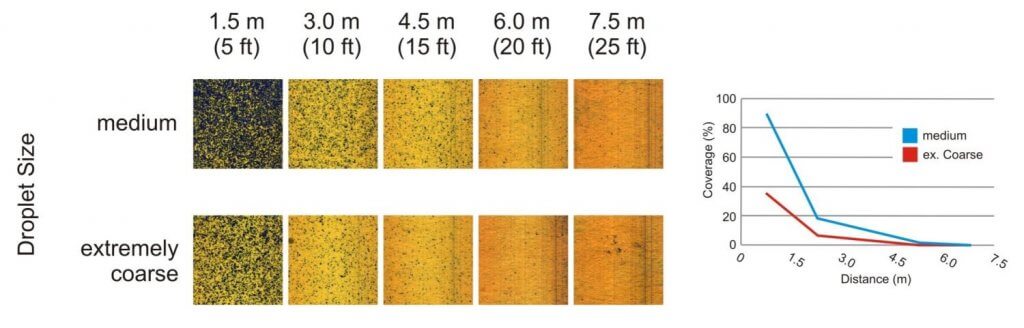
Droplet Size
The coarser the spray quality, the less likely the spray will drift off target. Remember, for a given volume, shifting to larger droplets means fewer droplets. Application volumes may have to increase to compensate for potentially reduced coverage.
The result of spraying with a Medium spray quality versus spraying with an Extremely Coarse spray quality: water-sensitive papers indicated that there is more downwind drift from smaller droplets.
Take-Home
This demo used percent coverage as a metric, which is convenient but greatly underestimates drift. So even when the spray window is small and the spray has to go on, take a moment to drop the boom, use a coarser droplet size and if it’s too windy, just don’t spray.
WUR Drift Calculator
There are many drift calculators available for home use. Some require more expertise than others to get a reliable result. This free downloadable calculator from Wageningen University & Research was made available in 2021. It can quantify spray drift deposits onto surface waters and non-target terrestrial areas near a sprayed field or orchard
The calculator uses statistically obtained regression curves to calculate spray deposition next to the sprayed field. The spray drift curves are based on the latest experimental data for field crops, fruit orchards and avenue tree nurseries.
Authors: T M Wolf, B C Caldwell and J L Pederson. Originally published in Aspects of Applied Biology 71, 2004, in expanded form.
Abstract
Spray drift deposition into water bodies may pose environmental and health hazards, and buffer zones have been suggested as a means of mitigating water contamination. Field trials were conducted to determine the effect of nozzle type and riparian vegetation on spray drift deposition into wetlands. Three riparian vegetative types, minimal vegetation (grass), low vegetation (willow shrubs), and high vegetation (aspen trees) were compared with open field conditions. Spray was released upwind of wetlands with these riparian characteristics with conventional and air-induced low-drift nozzles. Low-drift nozzles reduced drift deposits by about 75% in the absence of any vegetation, and by 88 to 99% when vegetation was present. Dense willow shrubs resulted in anomalous downwind deposits, possibly because of air turbulence caused by low porosity characteristics. By considering vegetation effects, a 15-m buffer zone could be reduced to 5 to 7 m for conventional, and 1 to 4 m for low-drift nozzles without increasing deposits at the edge of the sensitive habitat. Both variables should be considered by regulatory bodies in their risk assessment procedures.
Introduction
Airborne transport is an important vector for movement of pesticides from agricultural land to receiving waters. In an effort to maintain low pesticide levels in water bodies in accordance with risk assessment protocols, the Pest Management Regulatory Agency (PMRA) is mandating minimum setback distances (buffer zones) from water bodies during a spray operation. Several additional variables can complement buffer zones in preventing spray drift, including low-drift sprays and riparian vegetation. Germany and the United Kingdom already account for these characteristics in their buffer zone regulations (Kappel and Taylor, 2002).
Vegetation has been shown to be effective at mitigating droplet spray drift in several recent studies and reviews (Richardson et al., 2002, Hewitt, 2001, Ucar and Hall, 2001) by reducing wind velocities and intercepting spray. The documented magnitude of the spray drift deposit reduction in these studies ranges from 50 to >95%, dependent on variables that include vegetation height, porosity and orientation relative to wind direction, and wind speed.
We studied the integrated effect of buffer zones, vegetative barriers, and low-drift sprays to determine the overall impact of spray drift deposition onto downwind water bodies.
Materials and Methods
Overview and Site Description
The study was conducted in 2001 on a farm field near Aberdeen, SK. Sprays were applied upwind of a water body, and drift deposits were collected on petri-plates placed near ground level. Experimental sites were chosen to represent different vegetation heights and types around the water body in question: low (uncut grass), intermediate (willow shrubs), and tall (aspen trees). These were compared to nearby open-field conditions. Two sprayer nozzle types were used in the study: conventional flat fan nozzles and venturi-type low-drift nozzles.
The grass barrier was comprised of a mix of grasses dominated by bromegrass (Bromus spp.) growing to a height of 75 cm. Willows (Salix spp.) were approximately 3 m tall with a density of about 0.15 m-2 and presented a fully foliated barrier for their full height. Willows extended for a width of about 7 m toward the edge of the water body. Trembling aspen (Populus tremuloides Michx.) were approximately 8 m tall, with foliation beginning 1.5 m above ground. Trees were present at a density of about 0.25 m-2 and extended for 8 m toward the water edge.
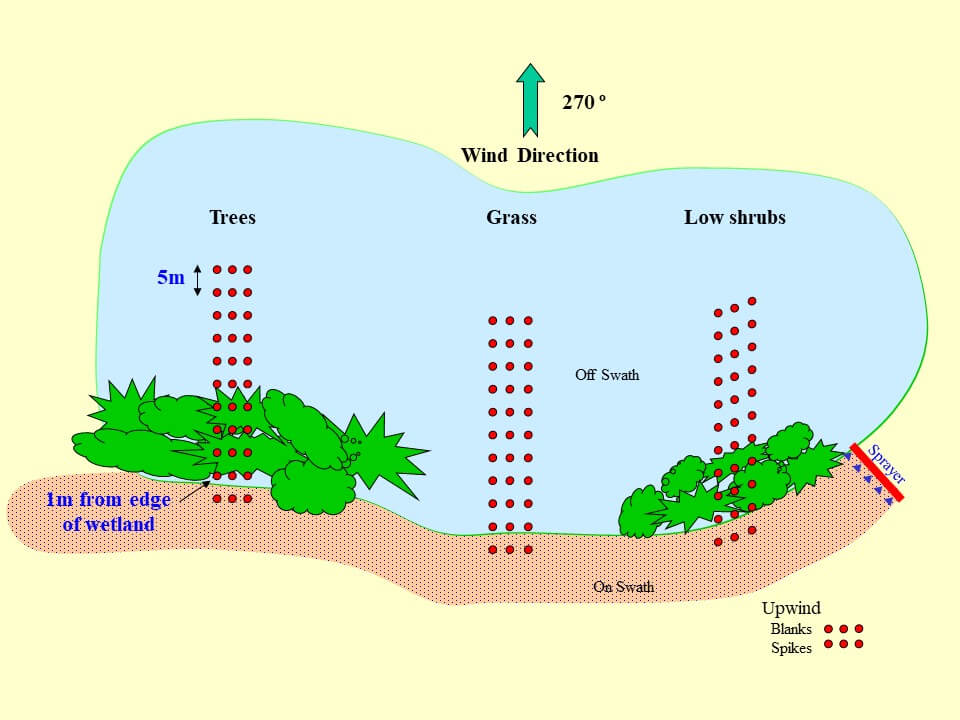
Figure 1: Site and sampler layout
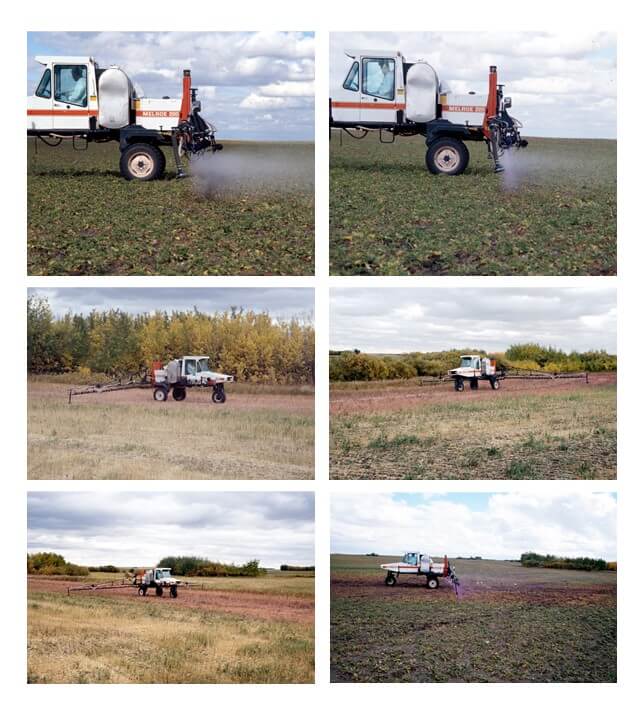
Spray Equipment and Application Method
A Melroe Spra-Coupe 220 was used to make the applications. This sprayer was equipped with conventional flat fan nozzles (XR8003) and air-induced low-drift nozzles (TD11003) at 275 kPa, producing ASABE Fine and Coarse sprays, respectively. The spray boom was 10 m wide and nozzles were 75 cm above ground. Sprayer travel speed was 12.9 km h-1, at which the application volume was 100 L ha-1.
The sprayer tank contained a mixture of 2,4-D amine4 (4 g L-1) and Rhodamine WT5 (2 mL L-1), a fluorescent tracer dye which would be used to quantify the deposits. 2,4‑D acted to photostabilize the dye, and also provided a spray formulation with physico-chemical properties representative of agricultural pesticides.
Top row: Fine and Coarse sprays used in study Middle row: Tall and medium vegetation Bottom row: Short vegetation and open field
Application was made in a direction approximately perpendicular to the prevailing wind, with the downwind edge of the spray boom at the edge of the wetland’s riparian vegetation. This was usually about 15 m upwind of the edge of the water body (due to severe drought conditions, the wetland did not contain any water at the time of the trials). Three consecutive passes were made along the same swath in a 10-min period to obtain average meteorological conditions for all three vegetation types. Wind speed and direction, temperature and relative humidity were monitored during application using a portable micrometeorological station.
Sampler Layout
Downwind of the spray swath there were 3 parallel lines of eleven 15-cm diameter glass petri-plate samplers starting underneath the sprayer boom and extending 46 m downwind from the edge of the spray swath (Figure 1). Samplers were separated by 5 m within the line, and lines were about 2 m apart.
The deposition profile was also assessed under open field conditions, using the same sampler layout but on crop land with no riparian vegetation. These are referred to as ‘bare soil, or ‘reference’ samplers in this report and served as a baseline to determine the impact of the riparian vegetation.
Sample Collection and Analysis
Sample collection began 5 minutes after spray application was complete (See Table 2 for trial times). Beginning with the furthest downwind locations, petri-plates were covered with a plastic lid, and placed into dark boxes. Spray deposits on the samplers were washed off in the laboratory using 95% ethanol in three 15-mL washes. Final samples were made up to 50 mL. and two 20-mL sub-samples were collected in borosilicate vials and stored in the dark.
Within 24 h, subsamples were analyzed using a fluorescence spectrophotometer with excitation and emission wavelengths of 545 and 570 nm, respectively (Shimadzu Model RF-1501 spectrofluorometer equipped with Model ASC-5 auto-sampler). Instrument readings were converted to µg L-1 using standard curves and expressed as a percent of the applied dosage under the field sprayer.
The fluorescence spectrophotometer data were averaged over the three replicate sampling lines, adjusted for photolysis, and expressed as a percentage of the amount applied on-swath. Relationships of spray drift deposits with downwind distance were first visualized by plotting all data points, and then mathematically related through appropriate regression techniques.
Results
Meteorological Conditions
Weather conditions were favourable during the trials. Wind speed and direction were appropriate for the sampler layout and the experimental objectives. Mean wind direction varied by up to 44º from the ideal (270º) in 6 out of 12 trials, and was within 30º for the remaining 6 trials (Table 1). Mean wind velocities were consistently between about 17 and 21 km h-1 in all but one trial. Air temperature and relative humidity fluctuated between 14 to 22º C and 31 to 80%, respectively, on the trial dates.
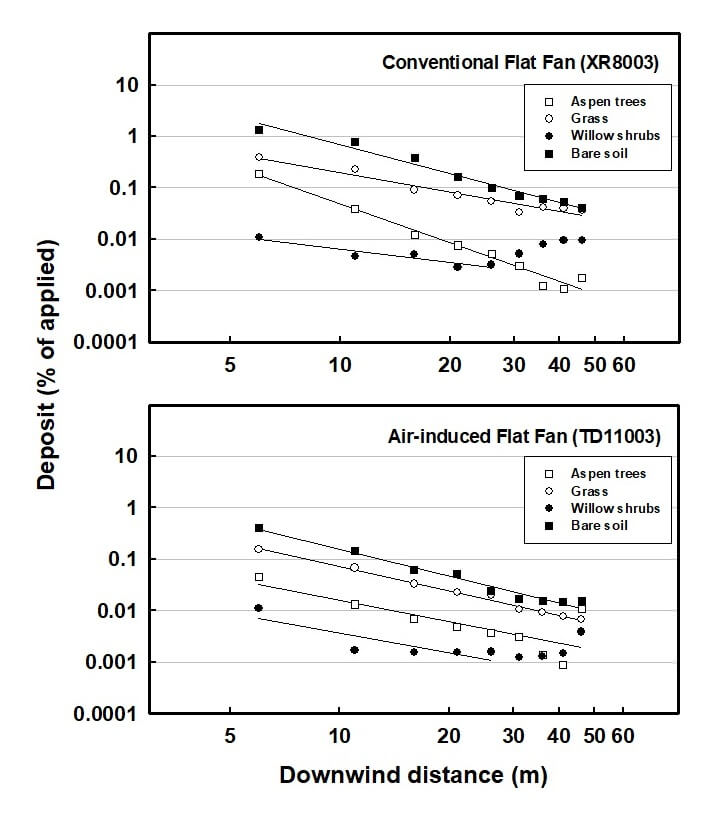
Deposition Profiles
A visual review of the raw data suggested that a linear regression of the log of deposit amount and log of downwind distance would be appropriate. It was noted that for willow, the deposit profile tailed upwards after the 26 m mark. Based on a survey of the site, it was concluded that this tail was probably caused by the length of the spray pass exceeding the length of protection offered by vegetation. In other words, beyond the 26 m sample, drift had not been attenuated by a vegetative barrier. It is also possible that the airflow was deflected up over the low, non-porous barrier and returned to ground level beyond the 26 m distance (Carter et al., 2001).
Figure 2: Spray deposit profiles from Fine (top) and Coarse (bottom) sprays. The deposition data for the willow were regressed from 6 to 26 m, all others were taken to 46 m (see text for explanation).
As a result of the questionable data for this vegetation type, it was decided that it would be misleading to include the furthest downwind data points. Implications of this observation will be discussed later in the manuscript. All regressions were statistically significant, explaining between 61 and 99% of the observed variation. In 5 of 8 trials, more than 90% of variation was explained.
Drift Mitigation by Riparian Vegetation and Application Method
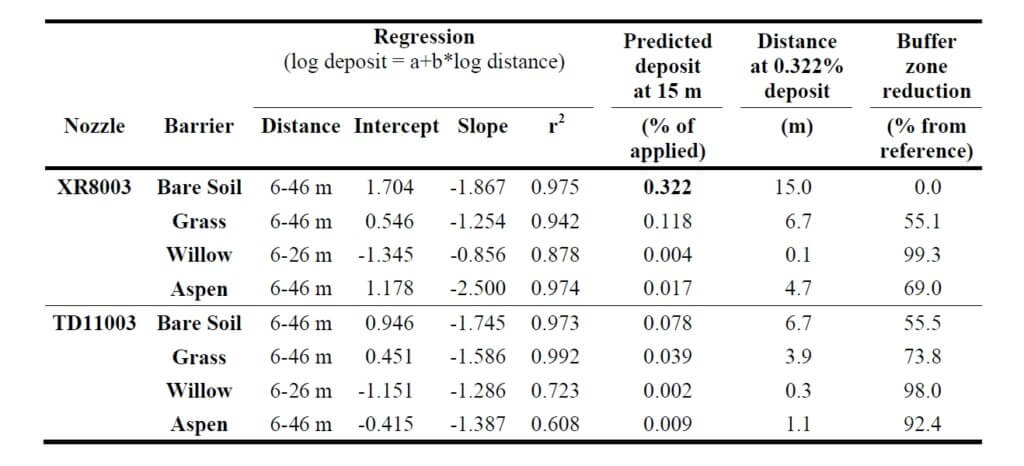
The predicted drift deposit at 15 m was calculated for all trials based on the regression parameters (Table 3). For the conventional sprayer on bare soil, the deposit amount was 0.322% of the applied dose. The distance at which this specific deposit amount would be achieved was then calculated for all other trials. This value is the buffer zone distance at which equivalent protection to the reference system was offered. Buffer zones could therefore be reduced by 55% (grass), 99% (willow) and 69% (aspen) using the conventional nozzle and 56% (bare soil), 74% (grass), 98% (willow) and 92% (aspen) for the low-drift nozzle.
Table 1: Buffer zone distances based on observed drift, calculated from regression.
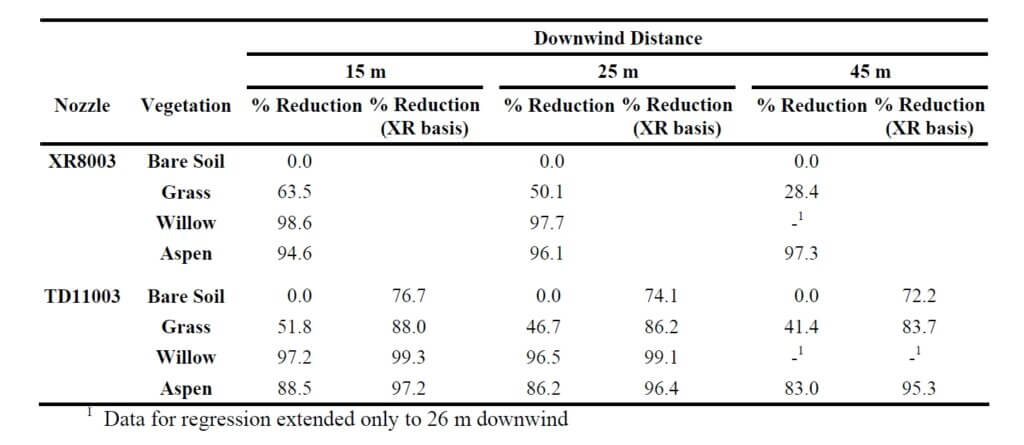
The calculated buffer zone reductions were not equivalent to the observed drift reductions due to the unique regression slopes of each deposition line. For example, expected drift deposits at 15 m downwind on bare soil were reduced by 77% when the air-induced low-drift nozzles were used (Table 4), whereas buffer zone distances could only be reduced by 56% (Table 3). Furthermore, the effectiveness of the grass vegetation diminished with distance, reducing drift by 64, 50, and 28% at distances of 15, 25, and 45 m, respectively. Therefore, a complete deposition profile will be required for each vegetation scenario to accurately adjust buffer zones.
Table 2: Drift deposits expressed as a percent of the reference deposition line for two application methods, four vegetation types, and three downwind distances. All numbers are the mean of three separate experiments on the same location.
Riparian vegetation was typically more effective than low-drift nozzles in protecting water bodies from drift deposition. While grass reduced deposition by 28 to 64% from the conventional nozzle (depending on the downwind distance), willow and aspen reduced deposition by between 95 and 99% (Table 4). The willow was not considered at further distances since the data used for the regression were truncated at 26 m. Low-drift sprays provided some additional protection in all cases except for trees at the 45 m distance, where deposits increased slightly relative to the conventional spray.
Discussion
The aerodynamics of vegetative barriers are a complex phenomenon. Wind, upon reaching a solid barrier, is diverted up and over giving strongly turbulent conditions on the leeward side and a rapid return to free wind speed. For a permeable barrier like a hedge, the return to free wind speed is more gradual since some air filters through, reducing the pressure differential and allowing for less turbulence (Davis et al., 1994). Wind speed reduction is most pronounced for a distance of 5 H upwind and 30 H downwind at the 1 H height, where H is the height of the barrier (Rider, 1951). Nonetheless, there may still be an upward diversion of air (and spray drift) which may simply delay, not eliminate, sedimentation (Hewitt, 2001, Ucar and Hall, 2001), particularly for dense hedges (Carter et al., 2001). Richardson et al. (2002) did not, however, notice such a deflection up to 10 m height.
The reduction in drift deposition by riparian vegetation in this study is clearly significant, but is subject to some interpretation. These data were generated at a single site, and while this site was carefully selected to be representative and trials were repeated three times, it does not necessarily constitute an average result. There are clearly any number of possible arrangements of trees, shrubs and grass, plus any additional vegetative or landscape features which would influence drift deposition behaviour. However, due to the consistent nature of the data of this study, some confidence is attained in that the numbers are at least reliable for the given set of conditions. In this study, three spray passes were made along the same swath at the edge of the water body. Results could have been different had adjacent spray swaths been used, owing to the possible change in contribution of upwind swaths with the altered airflows under vegetated conditions.
Since the water body was dry, additional grass vegetation which had grown up could have made an effective collector of spray drift, possibly reducing deposit values beyond those that would have occurred in a water body. It is recommended that efforts be made to repeat these studies when water is present at normal values.
The mitigating effect of vegetation depends on the aerodynamic features of the vegetation, as well as the collection efficiency of their leaves, twigs, etc. This poses some difficulties because there are no absolute measures of these features. Permeability, for example, varies with wind speed owing to the movement of leaves, and winds speed itself varies with height (Davis et al., 1994). Collection efficiency of the vegetation varies similarly with target size, its movement, wind speed, and droplet size spectrum (Hewitt, 2001). However, there are opportunities for improved characterization with specialized equipment, such as that used by Richardson et al. (2002). Their LIDAR instrument was able to help calculate tree height and width, mean area index and mean area density. Work to further characterize vegetation will prove useful in future efforts to understand its mitigating potential.
Low vegetation such as grass has not received the recent attention of hedges and trees but has also been documented to reduce spray drift significantly. A study by Miller et al. (2000) documented significant reductions in airborne drift concentrations above uncut grass canopies, even at low plant densities. Bache (1980) documented similar reductions in spray drift when sprays were applied over a mature wheat crop compared to bare soil. Therefore the filtering effects of “low” canopies may be very significant and should be the subject of further study.
Riparian areas are regions of high biological activity and diversity, not only protecting adjacent water from outside influence, but also providing food and shelter for many species of wildlife. These areas must themselves be protected from harmful effects, which can include pesticides. Their efficient capture of sprays suggests some risk from pesticides capable of controlling perennial vegetation. Likewise, pesticide residues in this vegetation have the potential to be ingested by wildlife or be washed off with precipitation, resulting in movement into the water body. These effects must be considered when using vegetation to mitigate airborne drift.
Conclusions and Recommendations
Vegetative barriers reduced spray drift deposition from conventional or low-drift nozzles into water bodies by 24 to 99%.
Low-drift sprays reduced deposition by about 75%.
Of the vegetation types, shrubs and trees had similar effects, reducing deposition from open-field conditions by an average of more than 95%. Low-drift sprays improved on this reduction.
Calculated buffer zone reductions were less than drift deposit reductions. Accurate determination of buffer zone distances requires that the entire deposition profile be characterized.
It is suggested that both riparian vegetation and sprayer technologies are important components of water body protection. Both should be considered in BMP and regulation development whenever the impact of pesticide applications near water bodies is to be estimated or mitigated.
Acknowledgements
The technical assistance of Glenda Howarth, Jill Clark, Rachel Buhler, Murray Nelson, Trevor Linford, and Pam Reynolds is greatly appreciated. Financial assistance was provided by the Rural Quality Program of the Agri-Food Innovation Fund, administered by the PFRA. The authors wish to thank Darrell Corkal and Clint Hilliard of PFRA for their enthusiasm, support and guidance directed towards this project, and Raymond Malko for making his land available for the trials.
Citations
Bache, D. H. 1980. Transport and capture processes within plant canopies. Spraying Systems for the 1980’s. BCPC Monograph No. 24, 127-132.
Carter, M. H., R. B. Brown, K. A. Bennett, M. Leunissen, V. S. Kallidumbil, and G. R. Stephenson. 2000. Methods for reducing buffer zone requirements for pesticide spraying adjacent to wetland environments. Sainte-Anne-de-Bellevue, Quebec: Proc. 2000 National Meeting, Expert Committee on Weeds / Comité d’experts en malherbologie [on-line: http://www.cwss-scm.ca/pdf/ECW2000Proceedings.pdf].
Davis, B. N. K, M. J. Brown, A. J. Frost, T. J. Yates, and R. A. Plant. 1994. The effects of hedges on spray deposition and on the biological impact of pesticide spray drift. Ecotoxicology and Environmental Safety 27:281-293.
Hewitt, A. J. 2001. Drift Filtration by natural and artificial collectors: a literature review. Special publication by Spray Drift Task Force, 12 pp. [on-line: http://www.agdrift.com]
Kappel, D. and W. A. Taylor. 2002. Buffer zones and “low drift” equipment. Hardi International Discussuion Paper, available from Hardi International A/S Helgeshøj Allé 38 DK-2630 Taastrup.
Miller, P. C. H, A. G. Lane, P. J. Walklate, and G. M. Richardson. 2000. The effect of plant structure on the drift of pesticides at field boundaries. Aspects of Applied Biology 57:75-82.
Richardson, G. M., P. J. Walklate, and D. E. Baker. 2002. Drift reduction characteristics of windbreaks. Aspects of Applied Biology 66:201-208.
Rider, N. E. 1951. The effect of a hedge on the flow of air. Quarterly Journal of the Royal Meteorological Society 78:97-101.
Ucar, T. and F. R. Hall. 2001. Windbreaks as a pesticide drift mitigation strategy: a review. Pest Management Science 57:663-675.
Wolf, T. M. 2000. Low-drift nozzle efficacy with respect to herbicide mode of action. Aspects of Applied Biology 57:29-34.
Choosing the right time to spray can be tricky. Our gut tells us that spraying when it’s windy is wrong. The experts tell us that spraying when it’s calm is wrong. So when can you actually spray?
I’ve always advised my clients to spray in some wind, because it has a few advantages. The main one is that wind helps disperse the spray upward and downward, diluting the spray cloud fairly rapidly. Another advantage is that winds tend to be reasonably steady in their direction and velocity (or at least that can be forecast), so downwind areas can be identified and potential impacts are known or predictable. It helps if it’s sunny, because that improves the dispersion of the cloud even more.
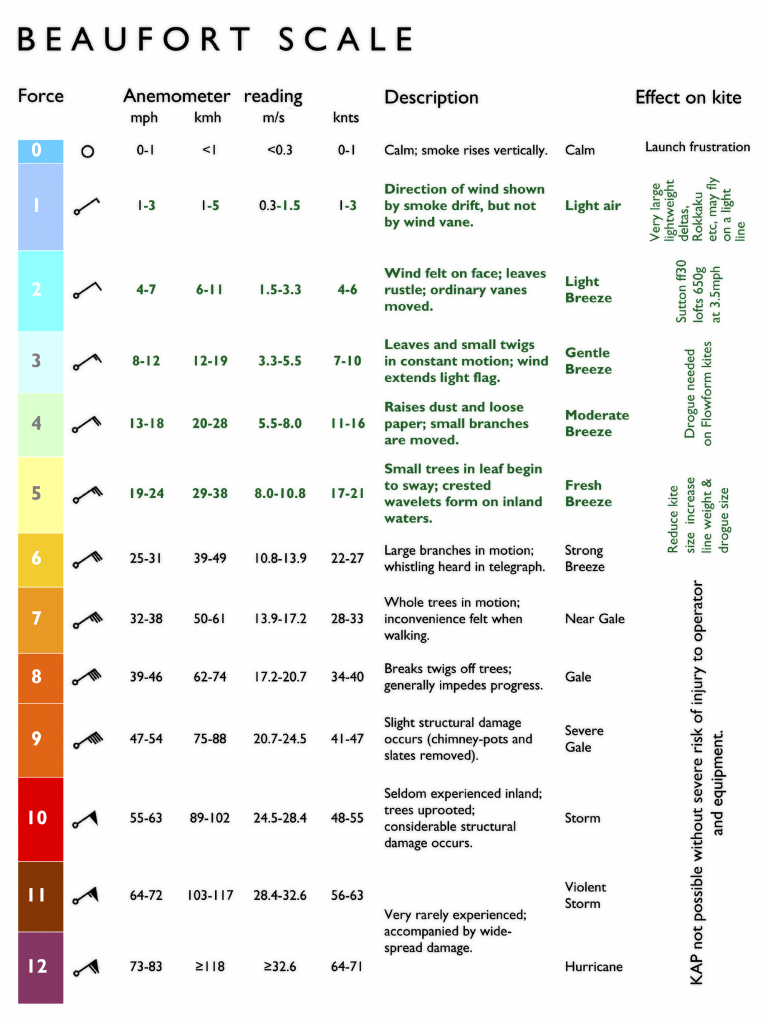
First, let’s define “windy”. The classic wind scale is the Beaufort Scale, intended for the sea, but also used on land. The upper limit for spraying is probably Force 3 or Force 4, with upper limits of 20 – 25 km/h or so. The Beaufort Scale calls these “Gentle or Moderate Breezes” (they had to save the alarming words for hurricanes), and the scale provides good visual clues such as what wind does to flags, leaves, or dust.
Spraying under breezy conditions can be done fairly safely if you follow specific steps. The idea is to understand what the risks are and to manage them.
The cornerstone is to use a low-drift spray and match it to a pesticide that will work well with larger droplets. But there are other important aspects to consider. Below are the top ten to think about:
Choose a herbicide that can handle large droplets. Glyphosate products are well suited to coarse droplets. But glyphosate commonly has contact actives in the mix, members of Group 6, 14, and 15, and these are less likely to perform well with big droplets than those that contain Group 2 and 4 mixes. Actives with soil activity also have more tolerance for larger droplets.
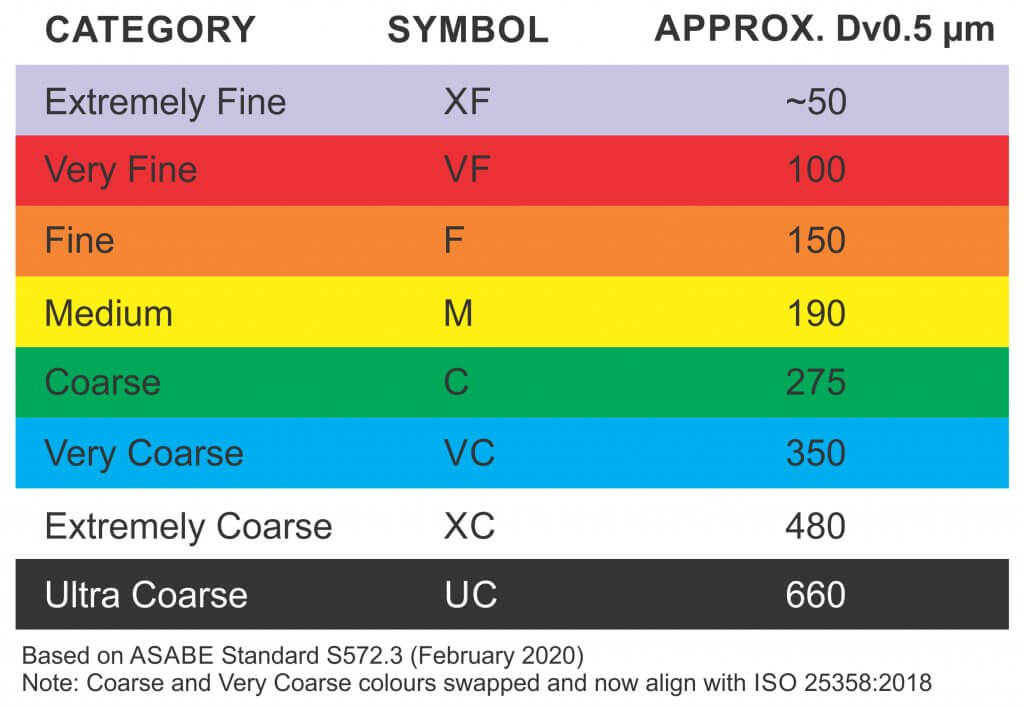
Use a low-drift nozzle and operate it so it produces a Coarse (C) to Very Coarse (VC) spray quality, as described by the manufacturer. Dicamba labels call for Extremely Coarse (XC) to Ultra-Coarse (UC) sprays, and Enlist requires at least Coarse. To achieve these you may need to purchase new nozzles. Low-pressure air-induced nozzles operated at about 50 – 60 psi will generally be very low-drift, but lower drift models are available. If you need a finer spray, produce it either by increasing the pressure or moving to a finer tip. Do this when the weather improves, for contact modes of action.
The name, symbol and range of droplet sizes used to describe the median droplet diameter produced by nozzles according to ASABE S572.3
Keep your boom low. Lowering the boom ranks as the second-most effective way to reduce drift, after coarser sprays. But there’s a limit. For low-drift sprays, you need at least 100% overlap (more for PWM), which is for the edge of one nozzle pattern to spray into the centre of the adjacent pattern. In other words, the spray pattern should be twice as wide as your nozzle spacing at target height. For most nozzles, a boom height of close to 20 inches is enough to achieve this overlap. That’s pretty low by current standards from suspended booms on self-propelled sprayers, so being too low for a good pattern will only happen due to boom sway.
Maintain reasonably slow travel speeds. These reduce the amount of fine droplets that hang behind the spray boom, reduce turbulence from sprayer wheels, and they also make low booms more practical. An added bonus is less dust generation.
Know what’s downwind and what harms it. Survey the fields on all sides of the parcel you’re treating. When you have a choice, avoid spraying fields that have sensitive areas downwind such as water, shelterbelts, pastures, people, etc. If you can’t avoid being upwind of these areas, make sure you check and obey the buffer zone restrictions on the label. These will also give you an idea if the product can cause harm in water or on land, or both.
Let the weather help you.
Take the wind from the side if you can. Going straight into the wind creates a lot of extra drift.
Consider a dicamba tip for special situations, even if you don’t use dicamba. If you’re in a situation where quitting and waiting is a poor option, these tips allow you to finish the job with minimal drift risk and with only slight reductions in product performance due to poor coverage.
Use a low-drift adjuvant. Specific products such as Interlock or Valid have been shown to reduce driftable fines (<150 microns) by between 40 – 60%, without adding significant volume in coarser droplets. The response will depend on the nozzle and the tank mix, but can be very noticeable.
Study drift and how it forms and moves. It’s about more than wind speed and droplet size. Knowledge in this area can help you work out the best strategies.
Invest in productivity. You may not need it every day, but on occasions when you have a small window to avoid bad weather, it pays dividends.
If you feel that drift is unavoidable and someone might be impacted by it, talk to those people first. It’s one of the most important things you can do.
Keeping pesticide sprays on target continues to be one of our top responsibilities.