The year 1989 marked my first spray drift trial under the watchful eye of Dr. Raj Grover and John Maybank. We evaluated the performance of several spray shrouds, Flexi-Coil, AgShield, Brandt, and Rogers, and wanted to measure just how effective they were. But in my heart I wasn’t interested in drift. I wanted to study herbicide efficacy. Anyway, I thought, we’ll do this trial and I’m pretty sure we won’t have to revisit the topic.
It’s now thirty-two years later and spray drift has interwoven itself into all my projects, remains one of the most powerful drivers of regulatory activity, is likely the most visible consequence of poor stewardship, and will stay as one of the dominant creators of public opinion around modern agricultural practice.
Drift has not gone away. And yet our understanding of it is far from complete.
Spray drift is defined as the wind-induced movement of the spray cloud away from the treated swath. Droplet drift can occur for all sprays, and it happens within minutes of the spray pass. Its cousin, vapour drift, is limited to active ingredients that are volatile, that is, they can evaporate from dry deposits after application. Vapour drift happens after the spray application is complete and can last several days.
Droplet Drift
Droplet drift can be divided into two phases that are separated by about 1 second and that are measured differently. “Initial drift” happens first and refers to the product that leaves the treated area immediately after atomization. It is airborne and can be measured by placing air-samplers (any device that can capture droplets in air) close to the downwind edge of the spray swath.
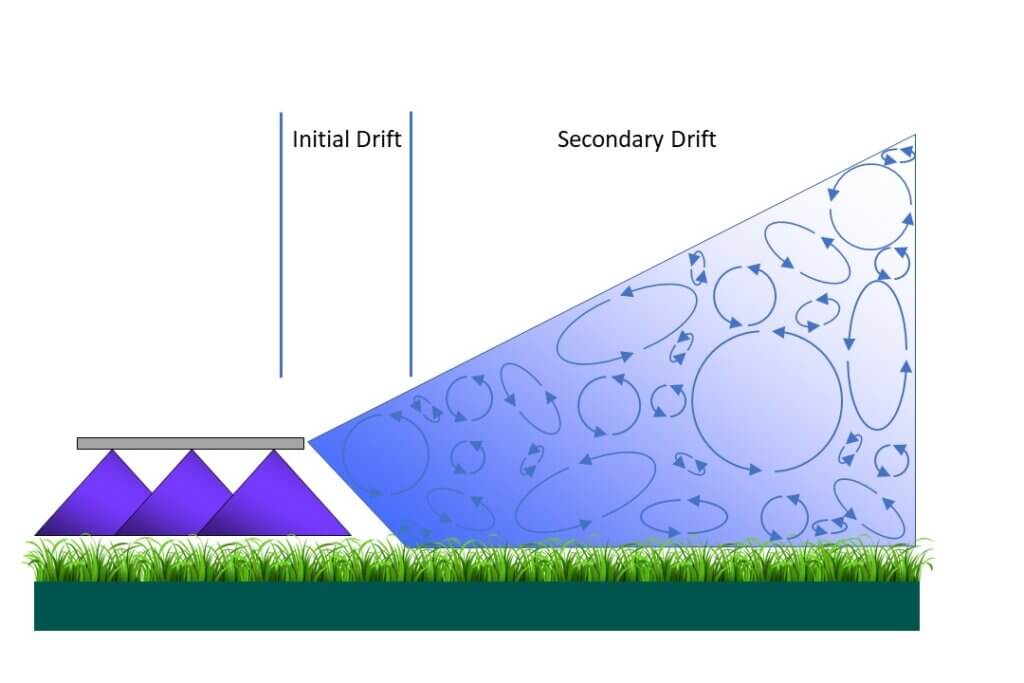
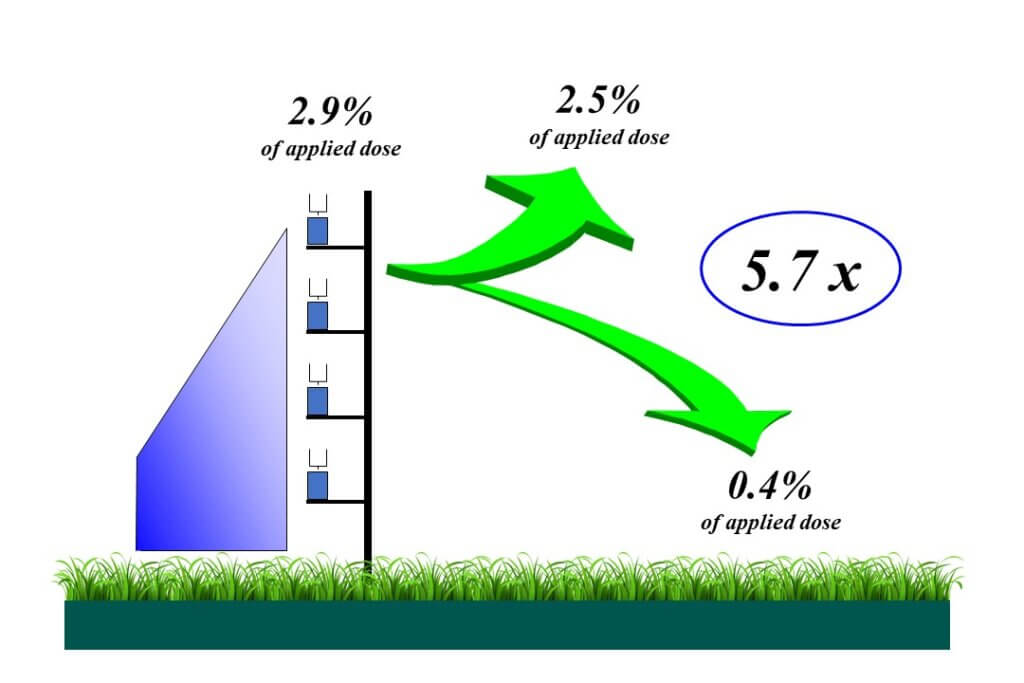
Figure 1: Initial vs Secondary drift. Once the drift cloud leaves the treated swath, the relative strengths of turbulence and sedimentation determine the amount that remains airborne and the amount that lands downwind.
Secondary drift describes the airborne spray cloud that continues to move downwind from the swath edge, where it either remains aloft or deposits on the surface below it. It is typically measured using samplers placed on the ground that capture sedimenting spray droplets. The difference in method is important because it goes to the heart of the problem of understanding spray drift.
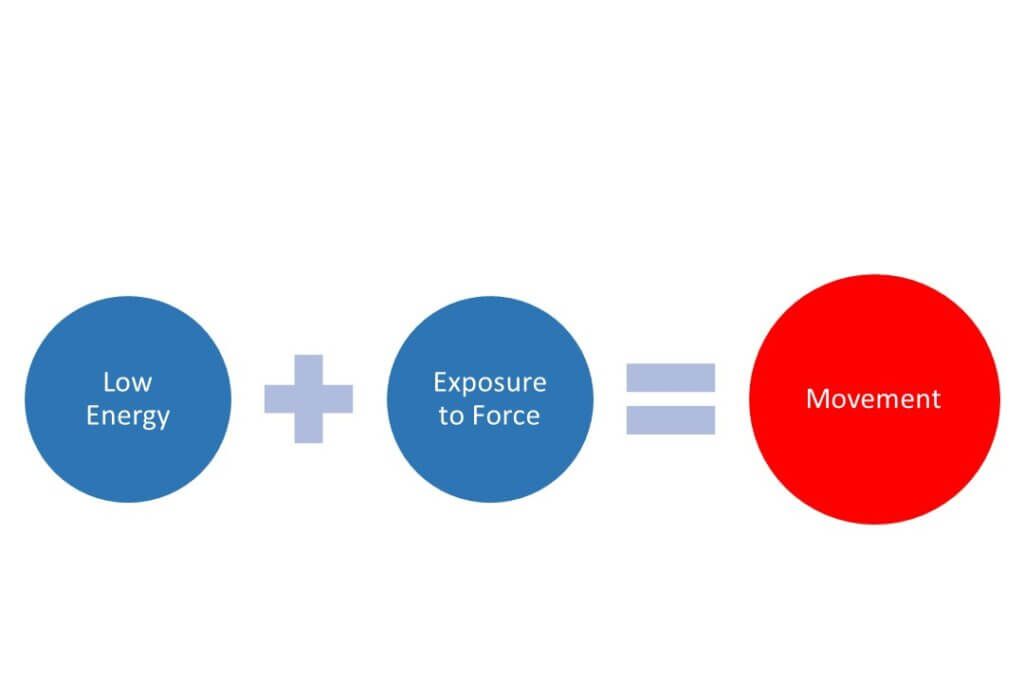
Initial drift is actually quite easy to understand because its creation is intuitive. The displacement of droplets from the spray plume is a function of balancing two types of energy. The first, droplet energy, is the product of droplet diameter and velocity. The more energy in the droplets, the more difficult they are to displace, and that’s why larger, heavier droplets or fast-moving air assist are useful drift reducing tools. The second, displacement energy, comes from relative air movement, either from forward travel speed or wind and the associated turbulence. More wind or turbulence means more power to displace.
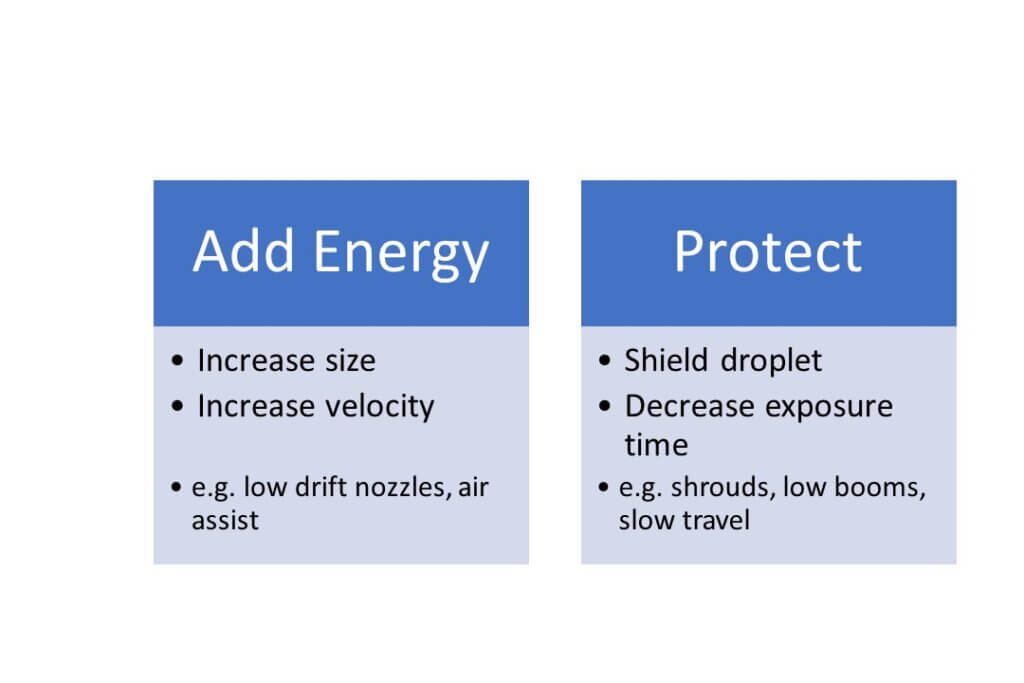
Because initial drift is easier to understand, our most common advice for reducing drift is based on maximizing droplet energy and minimizing displacement energy. Lower booms, larger droplets, slower travel speeds, shrouds, or properly implemented air assist all help reduce initial drift. It makes sense that creating less initial drift will also reduce downwind deposition arising from secondary drift.
Downwind Deposition
After leaving the spray swath, the moving secondary drift cloud has two main options. It can deposit or it can remain airborne. Basic physics suggest that all objects eventually fall to the ground, and since smaller objects need more time, they drift further. But when atmospheric turbulence and topography are considered, it’s not quite that simple. These two complicating factors control what proportion of the drift cloud remains airborne, and what proportion deposits.
Drift trials show that about 20% of the initial drift amount returns to the surface within the first 100 m or so of the sprayer. The rest remains and rises in the atmosphere where it evaporates and gets mixed further.
It happens quickly. Just 5 m downwind of the spray swath, the cloud is already 4 m tall. At 100 m downwind, we’ve measured its height to be 30 m.
The proportion of the spray that remains airborne depends on the spray quality and the nature of the atmosphere. If it’s windy and sunny, or if the spray is finer, turbulence sends more into the air. If it’s cloudy and the wind is low, we have little atmospheric mixing. As a result, a smaller proportion will remain airborne and more will sediment, and overall, we may actually have more potential to damage downwind areas.
When we graph spray drift deposit data from a windy day, the deposit amount decreases exponentially with downwind distance. Usually, drift damage follows the same pattern. The larger droplets that contain the majority of the dose deposit first. The smaller droplets go further and are more likely to mix in the atmosphere and rise with thermals.
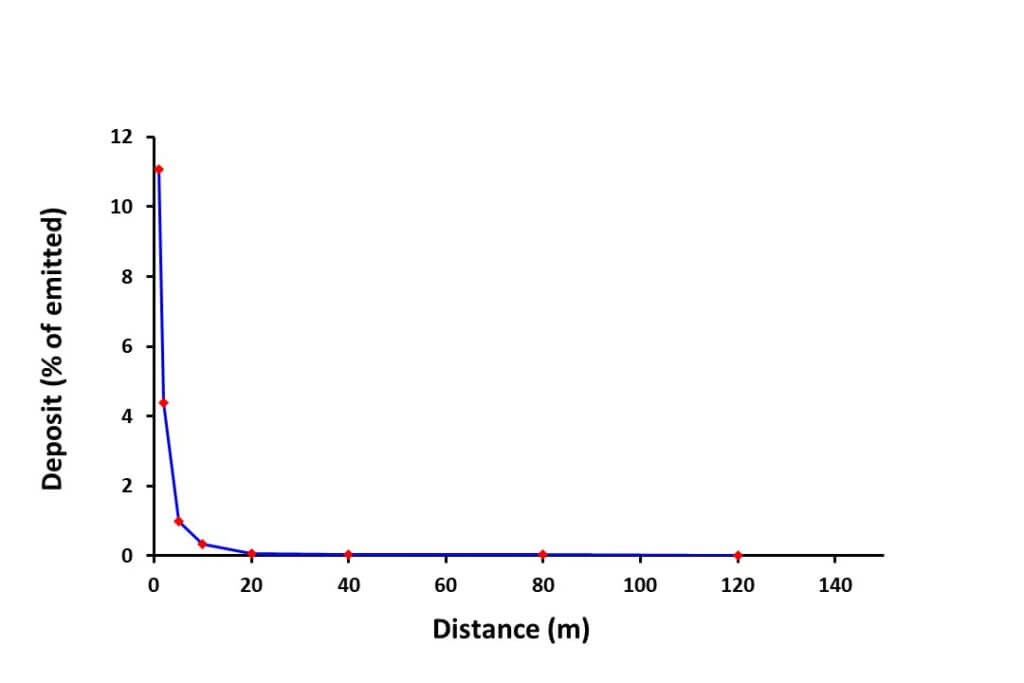
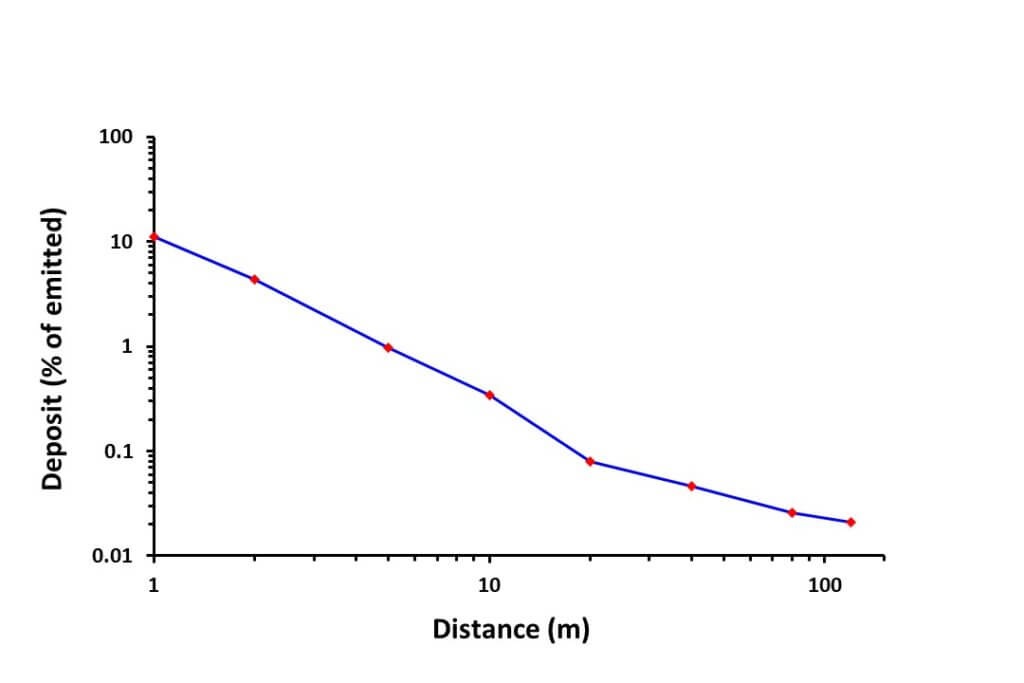
Under temperature inversion conditions that are common on calm summer evenings, overnight, and early mornings, the damage from the drift cloud does not decrease the same way. The cloud containing the buoyant mist lingers over a large area. Without atmospheric mixing and its resulting dilution with time and distance, large areas can be damaged.
The Effect of Turbulence on Deposition
We’ve established that the more atmospheric mixing we have, the less spray will deposit on the ground, at least in the short term. How does this affect our thinking on the role of wind?
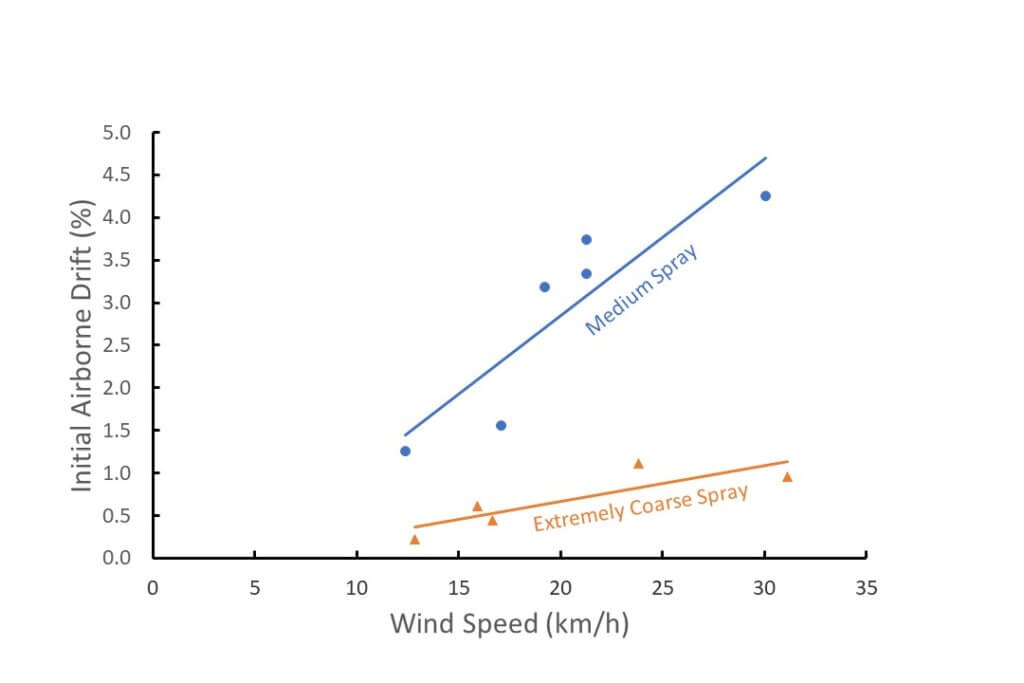
When we evaluated drift data from a number of trials, we always saw more initial drift with higher wind speeds, as expected. However, the downwind deposit did not usually increase significantly. We attributed this observation to turbulence generated by wind which lifted more of the initial drift higher into the atmosphere. To be clear, deposited drift did not go down with higher wind. It just didn’t rise as fast as initial drift.
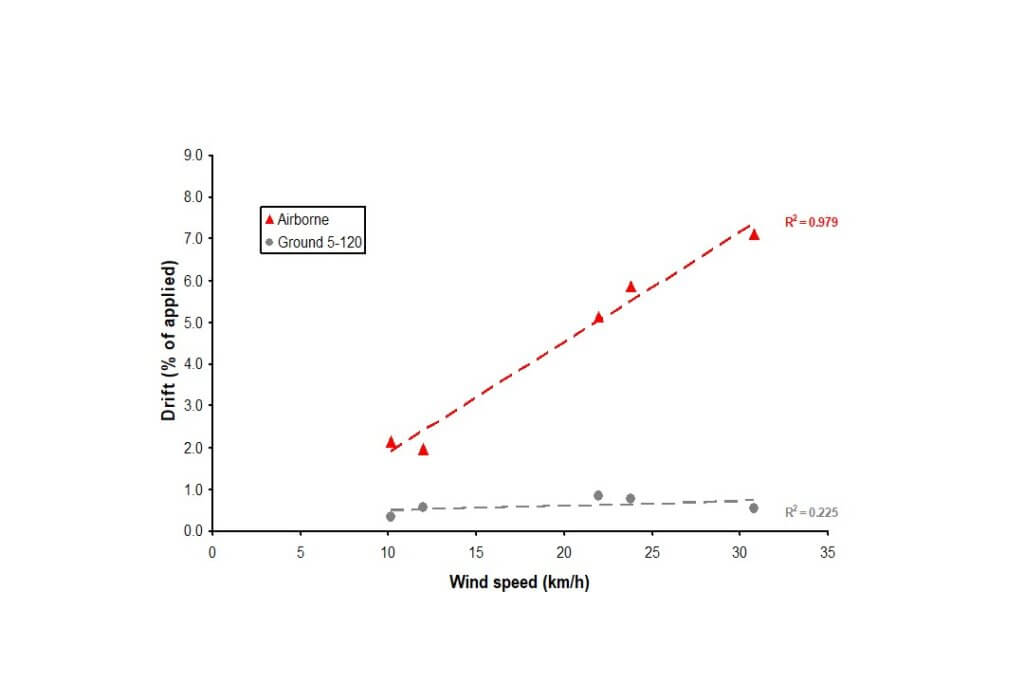
The effect of turbulence can be viewed as a good thing because it protects downwind objects. Rapid dilution reduces immediate drift damage. We can use turbulence to protect objects on the ground. It’s certainly better than the alternative, emitting sprays when the atmosphere can’t dilute them, such as in an inversion. In that case, downwind areas remain at risk for a long distance, and for a long time.
But we have to also consider what happens to airborne spray droplets. Some pesticides degrade in sunlight and stop being a problem. But others are more stable and may persist in the atmosphere for days or longer. During that time, they may move significant distances, ultimately returning to the earth’s surface in precipitation or in dust. Even though the atmosphere has diluted them, these deposits are measurable, and will show up in environmental monitoring of air, soil, and water. We may not be able to find out where they originate, but the public knows who to blame. Agriculture.
Vapour Drift
Vapour drift is another issue altogether. It occurs hours and days after application, as long as the volatile product remains on a surface and conditions that allow formation of vapours persist. Vapour pressure is related to surface temperature, and losses increase with warmer surfaces. Some products enter the vapour phase when in contact with water, and release vapour after a rainfall.
In situations where vapour is released for several days after application, it becomes impossible to control its subsequent movement. For droplet drift, if we know the wind direction at the time of spraying, we know where the impact is likely to be. But vapour movement depends on conditions that may occur between now and three days from now, and these could include high temperatures, various wind directions, and even inversions in which vapours accumulate. Ultimately, the best way to avoid off-target vapour movement is to avoid using volatile products.
The Public Good
Spray drift is one of agriculture’s most important stewardship challenges, and our industry needs to continue to improve its track record. Sprayers have a difficult task of converting a relatively small volume of liquid into a spray that offers good target coverage yet doesn’t move off the treated area. Favourable weather combined with droplet size management are at the heart of making this system work, but there isn’t a lot of wiggle room. Once again, an emphasis on sprayer productivity is one of the most fruitful areas to invest in, as this makes the best of the sometimes rare conditions in which spraying conditions are optimal.