Tag: turbulence

  • Fundamentals of Spray Drift

    Fundamentals of Spray Drift

    The year 1989 marked my first spray drift trial under the watchful eye of Dr. Raj Grover and John Maybank. We evaluated the performance of several spray shrouds, Flexi-Coil, AgShield, Brandt, and Rogers, and wanted to measure just how effective they were. But in my heart I wasn’t interested in drift. I wanted to study herbicide efficacy. Anyway, I thought, we’ll do this trial and I’m pretty sure we won’t have to revisit the topic.

    It’s now thirty-two years later and spray drift has interwoven itself into all my projects, remains one of the most powerful drivers of regulatory activity, is likely the most visible consequence of poor stewardship, and will stay as one of the dominant creators of public opinion around modern agricultural practice.

    Drift has not gone away. And yet our understanding of it is far from complete.

    Spray drift is defined as the wind-induced movement of the spray cloud away from the treated swath. Droplet drift can occur for all sprays, and it happens within minutes of the spray pass. Its cousin, vapour drift, is limited to active ingredients that are volatile, that is, they can evaporate from dry deposits after application. Vapour drift happens after the spray application is complete and can last several days.

    Droplet Drift

    Droplet drift can be divided into two phases that are separated by about 1 second and that are measured differently. “Initial drift” happens first and refers to the product that leaves the treated area immediately after atomization. It is airborne and can be measured by placing air-samplers (any device that can capture droplets in air) close to the downwind edge of the spray swath.

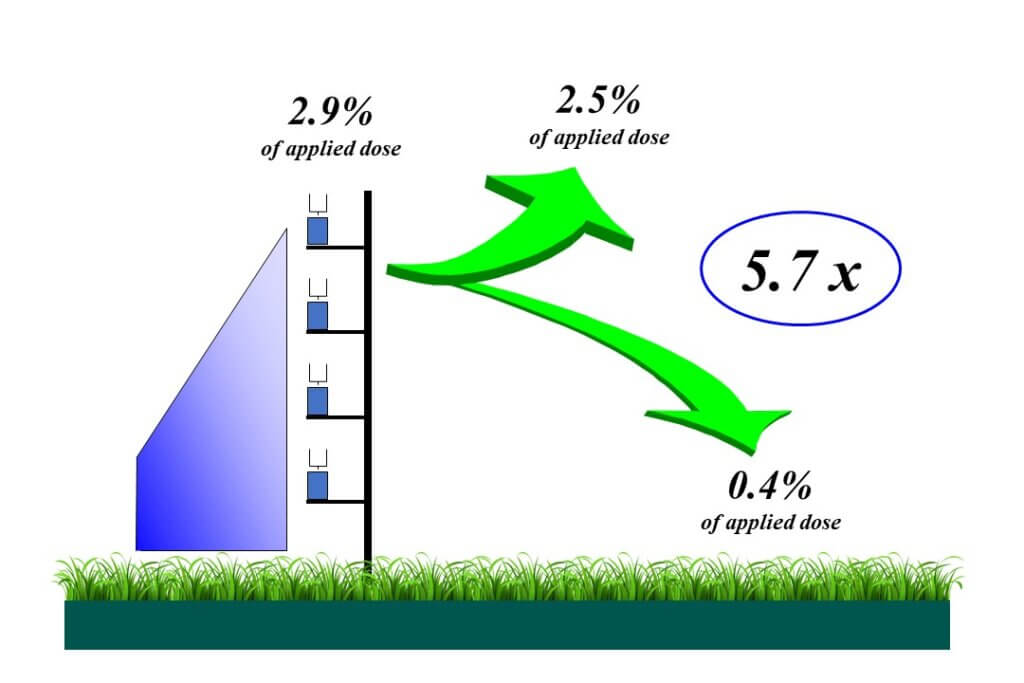
    Figure 1: Initial vs Secondary drift. Once the drift cloud leaves the treated swath, the relative strengths of turbulence and sedimentation determine the amount that remains airborne and the amount that lands downwind.

    Secondary drift describes the airborne spray cloud that continues to move downwind from the swath edge, where it either remains aloft or deposits on the surface below it. It is typically measured using samplers placed on the ground that capture sedimenting spray droplets. The difference in method is important because it goes to the heart of the problem of understanding spray drift.

    Figure 2: Droplet drift occurs when displacement energy exceeds droplet energy. The droplet’s combination of mass and velocity cannot withstand the energy presented by moving air.

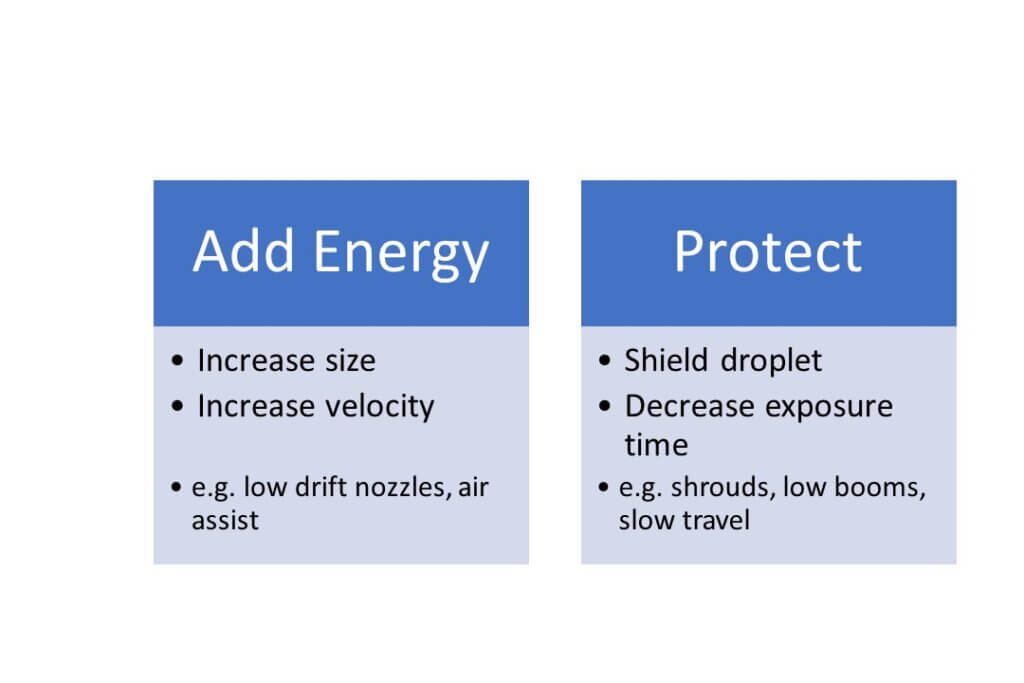
    Initial drift is actually quite easy to understand because its creation is intuitive. The displacement of droplets from the spray plume is a function of balancing two types of energy. The first, droplet energy, is the product of droplet diameter and velocity. The more energy in the droplets, the more difficult they are to displace, and that’s why larger, heavier droplets or fast-moving air assist are useful drift reducing tools.  The second, displacement energy, comes from relative air movement, either from forward travel speed or wind and the associated turbulence. More wind or turbulence means more power to displace.

     Figure 3: Initial drift follows an expected response to greater wind speeds and coarser sprays. Data from a pull-type sprayer travelling 13 km/h with 60 cm boom height.

    Because initial drift is easier to understand, our most common advice for reducing drift is based on maximizing droplet energy and minimizing displacement energy. Lower booms, larger droplets, slower travel speeds, shrouds, or properly implemented air assist all help reduce initial drift. It makes sense that creating less initial drift will also reduce downwind deposition arising from secondary drift.

    Figure 4: Management of initial drift is intuitive. We reduce drift by adding energy to the droplet and by protecting the droplet from exposure to moving air.

    Downwind Deposition

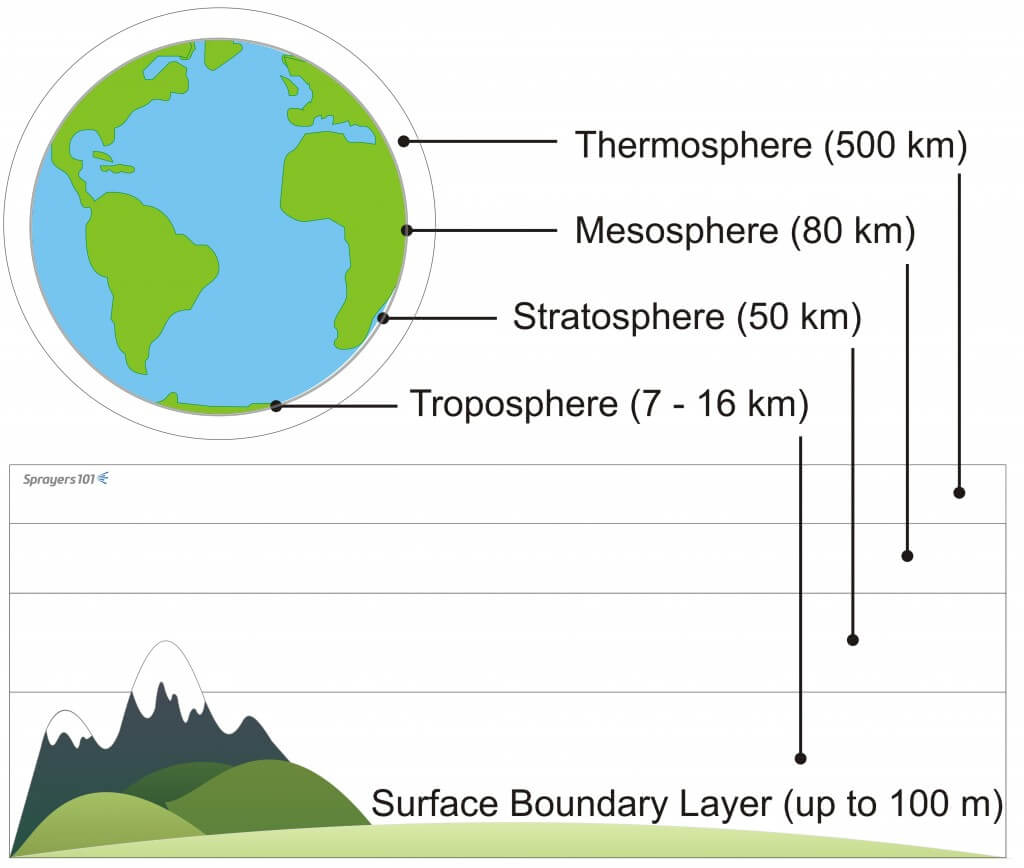
    After leaving the spray swath, the moving secondary drift cloud has two main options. It can deposit or it can remain airborne. Basic physics suggest that all objects eventually fall to the ground, and since smaller objects need more time, they drift further. But when atmospheric turbulence and topography are considered, it’s not quite that simple. These two complicating factors control what proportion of the drift cloud remains airborne, and what proportion deposits.

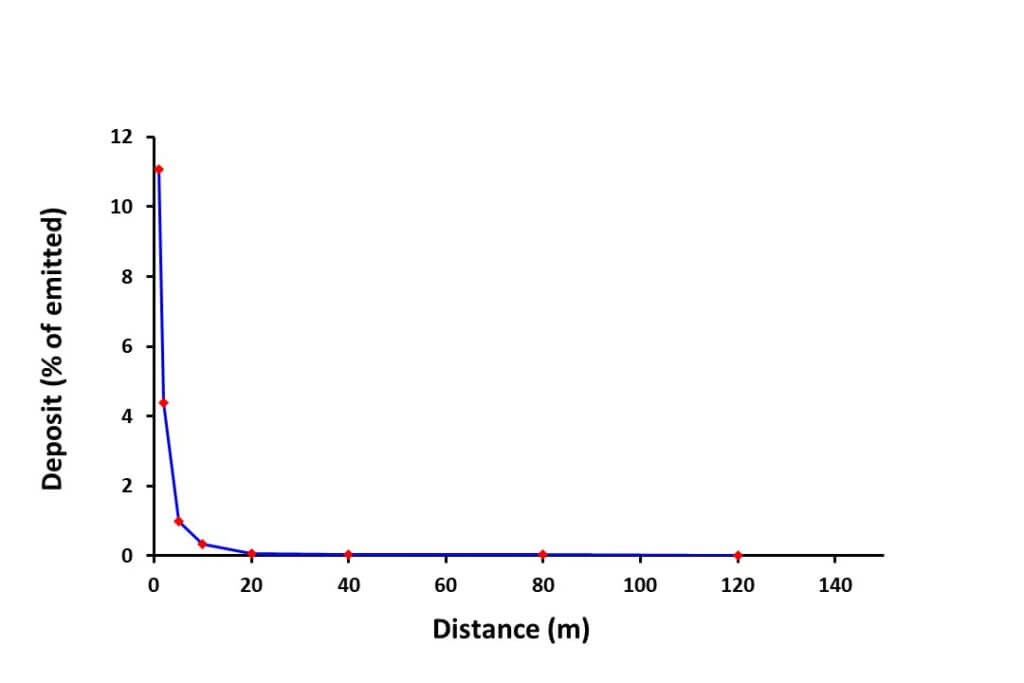
    Drift trials show that about 20% of the initial drift amount returns to the surface within the first 100 m or so of the sprayer. The rest remains and rises in the atmosphere where it evaporates and gets mixed further.

    Figure 5: The majority of secondary drift remains airborne. Data are for Medium spray quality from a pull-type sprayer with 60 cm boom height and 13 km/h travel speed

    It happens quickly. Just 5 m downwind of the spray swath, the cloud is already 4 m tall. At 100 m downwind, we’ve measured its height to be 30 m.

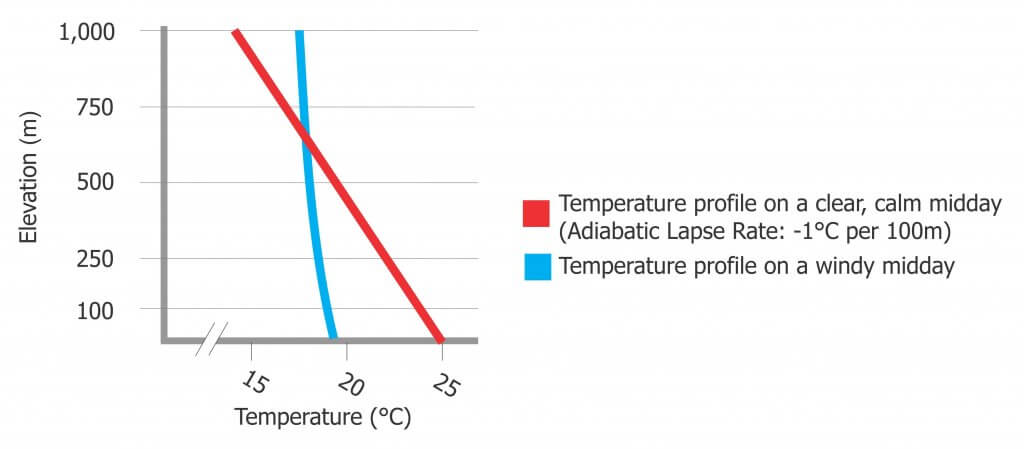
    The proportion of the spray that remains airborne depends on the spray quality and the nature of the atmosphere. If it’s windy and sunny, or if the spray is finer, turbulence sends more into the air. If it’s cloudy and the wind is low, we have little atmospheric mixing. As a result, a smaller proportion will remain airborne and more will sediment, and overall, we may actually have more potential to damage downwind areas.

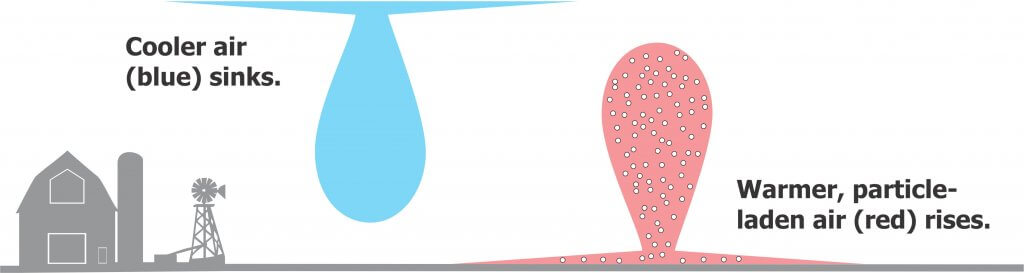
    When we graph spray drift deposit data from a windy day, the deposit amount decreases exponentially with downwind distance. Usually, drift damage follows the same pattern. The larger droplets that contain the majority of the dose deposit first. The smaller droplets go further and are more likely to mix in the atmosphere and rise with thermals.

    Figure 6: Deposited drift decreases logarithmically with distance. Top, linear axes. Bottom, log axes.

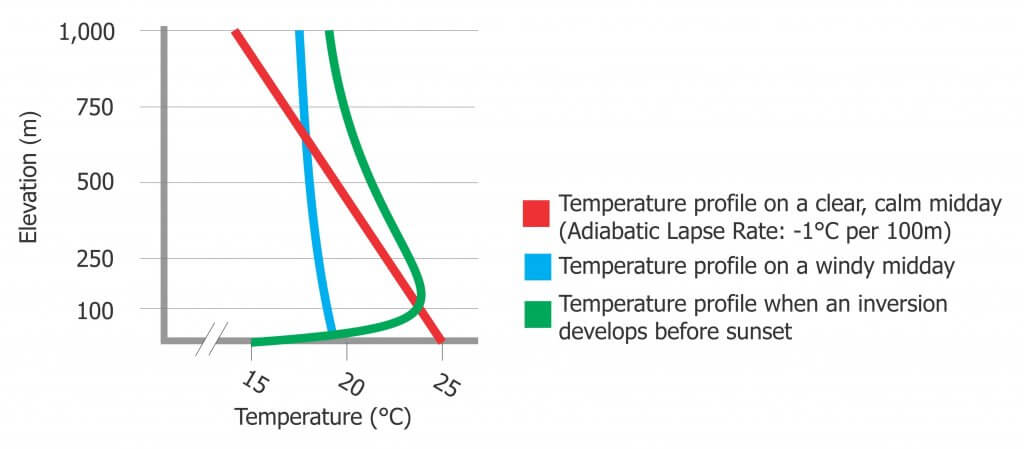
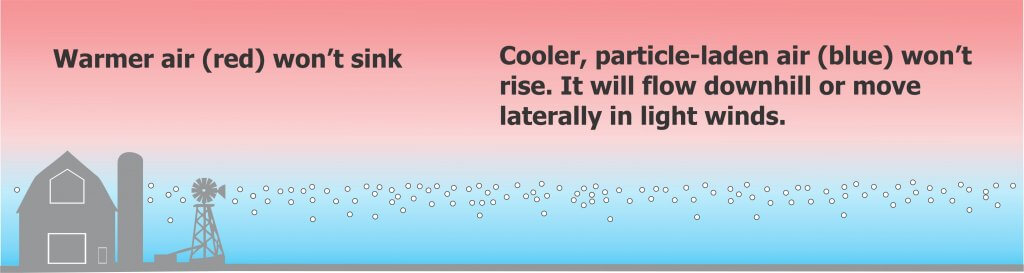
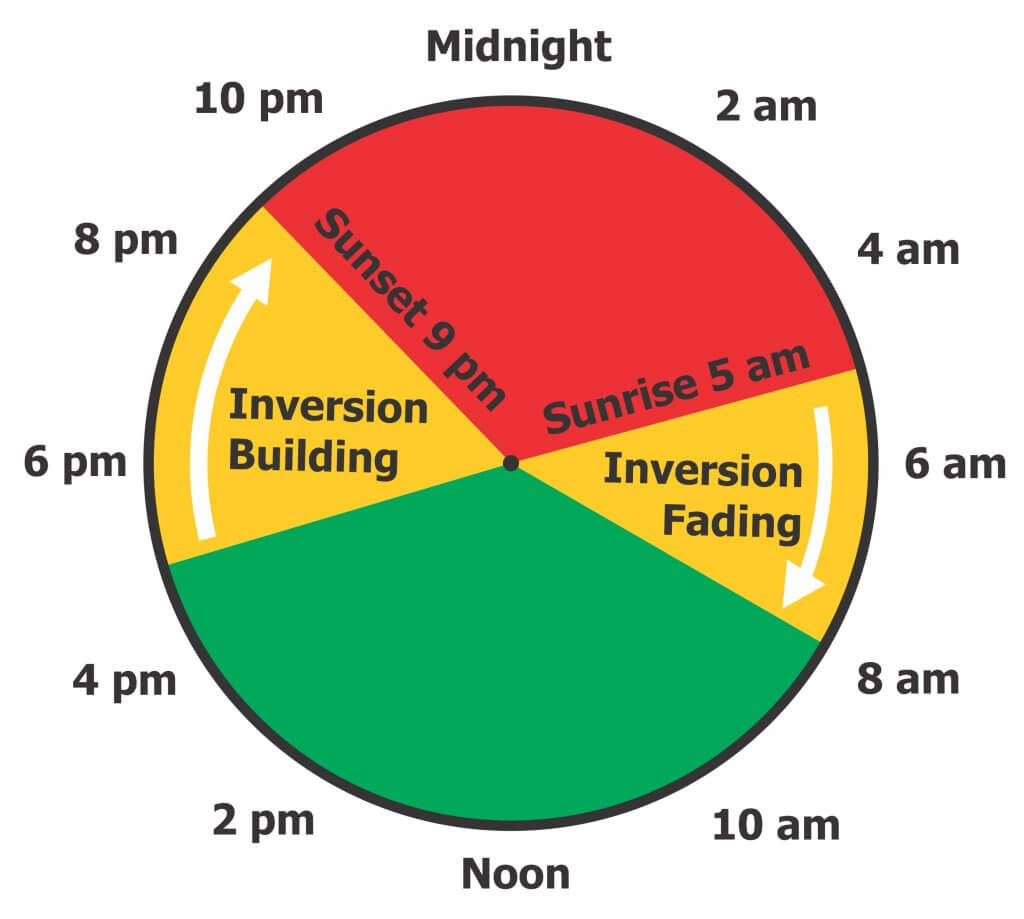
    Under temperature inversion conditions that are common on calm summer evenings, overnight, and early mornings, the damage from the drift cloud does not decrease the same way. The cloud containing the buoyant mist lingers over a large area. Without atmospheric mixing and its resulting dilution with time and distance, large areas can be damaged.

    The Effect of Turbulence on Deposition

    We’ve established that the more atmospheric mixing we have, the less spray will deposit on the ground, at least in the short term. How does this affect our thinking on the role of wind?

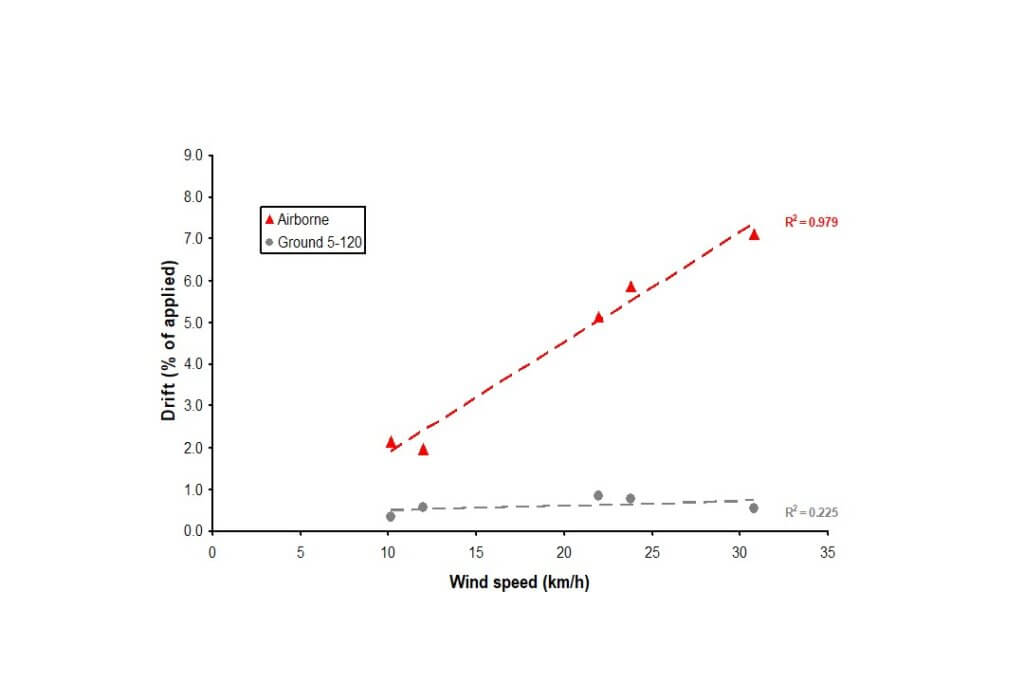
    When we evaluated drift data from a number of trials, we always saw more initial drift with higher wind speeds, as expected. However, the downwind deposit did not usually increase significantly. We attributed this observation to turbulence generated by wind which lifted more of the initial drift higher into the atmosphere. To be clear, deposited drift did not go down with higher wind. It just didn’t rise as fast as initial drift.

    Figure 7: The effect of wind speed on airborne drift (top line) vs deposited drift (bottom line) from a high clearance sprayer travelling 23 km/h and emitting a Very Coarse spray.

    The effect of turbulence can be viewed as a good thing because it protects downwind objects. Rapid dilution reduces immediate drift damage. We can use turbulence to protect objects on the ground. It’s certainly better than the alternative, emitting sprays when the atmosphere can’t dilute them, such as in an inversion. In that case, downwind areas remain at risk for a long distance, and for a long time.

    But we have to also consider what happens to airborne spray droplets. Some pesticides degrade in sunlight and stop being a problem. But others are more stable and may persist in the atmosphere for days or longer. During that time, they may move significant distances, ultimately returning to the earth’s surface in precipitation or in dust. Even though the atmosphere has diluted them, these deposits are measurable, and will show up in environmental monitoring of air, soil, and water.  We may not be able to find out where they originate, but the public knows who to blame. Agriculture.

    Vapour Drift

    Vapour drift is another issue altogether. It occurs hours and days after application, as long as the volatile product remains on a surface and conditions that allow formation of vapours persist. Vapour pressure is related to surface temperature, and losses increase with warmer surfaces. Some products enter the vapour phase when in contact with water, and release vapour after a rainfall.

    In situations where vapour is released for several days after application, it becomes impossible to control its subsequent movement. For droplet drift, if we know the wind direction at the time of spraying, we know where the impact is likely to be. But vapour movement depends on conditions that may occur between now and three days from now, and these could include high temperatures, various wind directions, and even inversions in which vapours accumulate. Ultimately, the best way to avoid off-target vapour movement is to avoid using volatile products.

    The Public Good

    Spray drift is one of agriculture’s most important stewardship challenges, and our industry needs to continue to improve its track record. Sprayers have a difficult task of converting a relatively small volume of liquid into a spray that offers good target coverage yet doesn’t move off the treated area. Favourable weather combined with droplet size management are at the heart of making this system work, but there isn’t a lot of wiggle room. Once again, an emphasis on sprayer productivity is one of the most fruitful areas to invest in, as this makes the best of the sometimes rare conditions in which spraying conditions are optimal.

  • Thermal Inversions for Sprayer Operators

    Thermal Inversions for Sprayer Operators

    In April 2014, NDSU extension published an excellent factsheet explaining what thermal inversions are, how to detect them and how they affect pesticide spray drift. That factsheet inspired this article.

    The Atmosphere

    The Earth is surrounded by a layer of air called the atmosphere. Think of it as a sheet of liquid percolating and flowing over the Earth’s surface. Seems a bit precarious, doesn’t it?

    We define “layers” of atmosphere based on their distance from the Earth’s surface (see image below). We’ll focus on the lowest part of the Earth’s atmosphere: the Surface Boundary Layer. As it drags along the Earth’s surface it experiences rapid changes in wind speed, temperature and humidity (on a time scale of an hour or less).

    The Earth’s Atmosphere. The illustration of the Earth is to scale, but the landscape is not. Our focus in on the Surface Boundary Layer.
    The Earth’s Atmosphere. The illustration of the Earth is to scale, but obviously the landscape is not. Our focus in on the Surface Boundary Layer.

    Atmospheric temperature

    In relatively calm, clear and dry conditions (e.g. a nice afternoon), air cools with elevation at a rate of about 1°C per 100m. This change is called the Adiabatic Lapse Rate and it’s caused by pressure changing with elevation. If your ears have popped when driving down a steep hill, you’ve experienced pressure change with elevation; there is more atmosphere overhead and the weight pushes down.

    With higher elevation, there is less atmosphere overhead. Less weight means less pressure and this gives air room to expand. Expansion takes work and work costs energy, which creates a cooling effect. See how simple thermodynamics are?

    In the graph below, the red line shows the Adiabatic Lapse Rate of air cooling with elevation. The blue line indicates wind stirring and homogenizing the atmosphere, reducing the degree of temperature change with elevation (more on that later).

    Day and night

    When we add the effect of daytime solar heating and nighttime cooling, the rate of temperature change is affected. Let’s consider how this works on a clear, relatively calm day:

    Early morning

    The morning sun emits short wave radiation, which is absorbed by the Earth’s surface. The surface conducts some of this energy deeper into the ground and also heats the air near the surface. This creates a temperature gradient wherein the surface is warmest and the air gets relatively cooler with elevation (remember the red line in the graph above).

    As the air near the surface warms, that energy causes air molecules to vibrate and push away from one another. Parcels of air become less dense and rise just like the gloop in a lava lamp. The cooler air around it falls to fill in the space left behind, and air begins to circulate in a Convection Cell. The rising parcel of air will eventually cool and shrink as it rises through the relatively cooler air above it.

    These convection cells create Thermal Turbulence, which is a very effective way for airborne particles, such as pesticide vapour, to be rapidly diluted. This is also how the atmosphere disperses pollution. More on the process of dispersion, later.

    Mid to late afternoon

    As the sun passes over and the wind starts to rise, the convection cells get disrupted by the wind and experience mechanical turbulence (remember the blue line in the graph above). So, mechanical turbulence also mixes warmer air near the ground with cooler air above it, but suppresses thermal turbulence.

    Mid-afternoon to night

    As the energy from the sun lessens, the soil begins to cool and so does the air next to it. Once the air cools enough to be colder than the air above it, we have the beginning of a Radiation Inversion, which is a specific kind of Thermal Inversion (see the green line in the graph below). It is called that because we now have the reverse of the typical day-time temperature profile. The height of the inversion (the ceiling) grows with time, and can reach a maximum of about 100m by sunrise. Within the inversion layer (before the green line bends back at 100m), turbulence is suppressed. We have a stable air mass. More on that below.

    How inversions affect dispersion

    The rising portion of a convection cell carries whatever particles are in the air with it. Suspended particles become much less concentrated at ground level thanks to the thermal turbulence.

    Thermal Turbulence allows particle-laden warm air to rise and clean cool air to fall. This disperses air-borne particles like dust or pollution.

    Now let’s imagine we are in a thermal inversion. The cooler, particle laden air near the ground cannot rise and the cleaner air above, which is now relatively warmer, cannot sink. Thermal turbulence is suppressed, and so is any vertical dispersion.

    Thermal Turbulence is suppressed during a Temperature Inversion. Particle-laden cool air at the surface cannot rise, and warm, clean air cannot fall. No dispersion occurs, and the concentrated, particle-laden air tends to move downhill or laterally with light winds.

    When spraying, the smallest spray droplets fall slowest, staying airborne for long periods of time. If spraying occurs during an inversion, those particles accumulate beneath the inversion layer. Remember we said our atmosphere behaves like a liquid? The colder, denser (pesticide-laden) air drains downhill into low-lying areas. It can also move laterally over great distances, in unpredictable directions, when light winds begin.

    Clouds

    If the morning were overcast instead of clear, the clouds would intercept much of the sun’s short-wave radiation, absorbing or reflecting it back into space. The Earth’s surface would still warm, but more slowly, suppressing thermal turbulence. As an aside, if clouds form in the evening, they reflect long-wave radiation from the Earth’s surface back down. This Greenhouse Effect is why overcast nights are warmer than clear ones.

    Therefore, extended periods of mostly clear skies in the evening or night means a high probability of strong temperature inversions. Conversely, cloud cover usually means a near-neutral atmosphere, so no strong inversion.

    Wind

    Inversions are only mildly affected by light wind (e.g. 6 to 8 km/h), but as the wind increases and mechanical turbulence mixes the air, the strength of the inversion will be reduced and the atmosphere will approach a neutral condition (see the blue line). In this condition, airborne particles are not dispersed by thermal turbulence, but some mixing will occur. So, there may not be a thermal inversion, but spraying would still be inadvisable if the wind got too high.

    Humidity

    Inversions form more rapidly when there is less water vapour in the air to absorb radiation. Once humid air has cooled to the dew point, water condensation gives off energy and warms the air a little. This slows the formation of the inversion. Be aware that inversion conditions can exist long before fog, dew or frost forms, so they are not a good indicator for the beginning of an inversion – you’re already in one!

    If you see fog, dew or frost, you’re already in an inversion. The air has become cold enough to condense or even freeze water.
    If you see fog, dew or frost, you’re already in an inversion. The air has become cold enough to condense or even freeze water.

    Soil conditions and topography

    This is a complex issue, but soil conditions that make inversions more intense include low soil moisture, freshly tilled soils, coarse soils, heavy residue and closed crop canopies. Topography matters, too. We’re discussing radiation inversions in arable regions, and the kind that form on mountains or deep valleys. Nevertheless, inversions in shaded areas (e.g., behind windbreaks) start sooner, and last longer. See the NDSU factsheet for more detail.

    Spray timing

    Inversions, once formed, persist until the sun rises and warms the Earth’s surface, or until winds increase and mix the stationary layers of air together, re-establishing a more neutral temperature profile.

    Sunset is not a good indicator of the beginning of an inversion – it can start a few hours before. Therefore, evening spraying may be just as risky as night spraying. Very early mornings (e.g. around sunrise) are not much better. Remember, at sunrise, the inversion will be at its maximum height.

    The rising sun will warm the earth and create turbulent conditions, starting near its surface (e.g. a few metres). Most inversions will have dissipated two hours after sunrise, which may be the best choice for spraying.

    Detecting an inversion

    The only sure way to know if you are in an inversion is to take two air temperature readings: one near the ground and one about three metres higher. If the surface air temperature is cooler, you are in an inversion. The magnitude of the difference indicates how strong the inversion is.

    Accurate measurements are difficult to manage with conventional thermometers, but SpotOn now makes a hand-held detection unit. If you have one, be sure to let it acclimate before you use it. Leaving it in a hot, or cold, truck or sprayer cab prior to use means it may give a false reading.

    Inversion forecasting is getting better, but it’s still location-specific and not entirely reliable. Sprayer operators should learn to watch for the following environmental cues:

    • Large temperature swings between daytime and the previous night.
    • Calm (e.g. less than 3 km/h wind) and clear conditions when the sun is low.
    • Intense high pressure systems (usually associated with clear skies) and low humidity where you intend to spray.
    • Dew or frost indicating cooler air near the ground (fog may be too late).
    • Smoke or dust hanging in the air or moving laterally.
    • Odours travelling large distances and seeming more intense.
    • Daytime cumulus clouds collapse toward the evening.
    • Overnight cloud cover is 25% or less.

    Note: If you suspect a temperature inversion, don’t spray.

    For more information on how weather affects drift, download this pamphlet from the Australian Government Bureau of Meteorology.