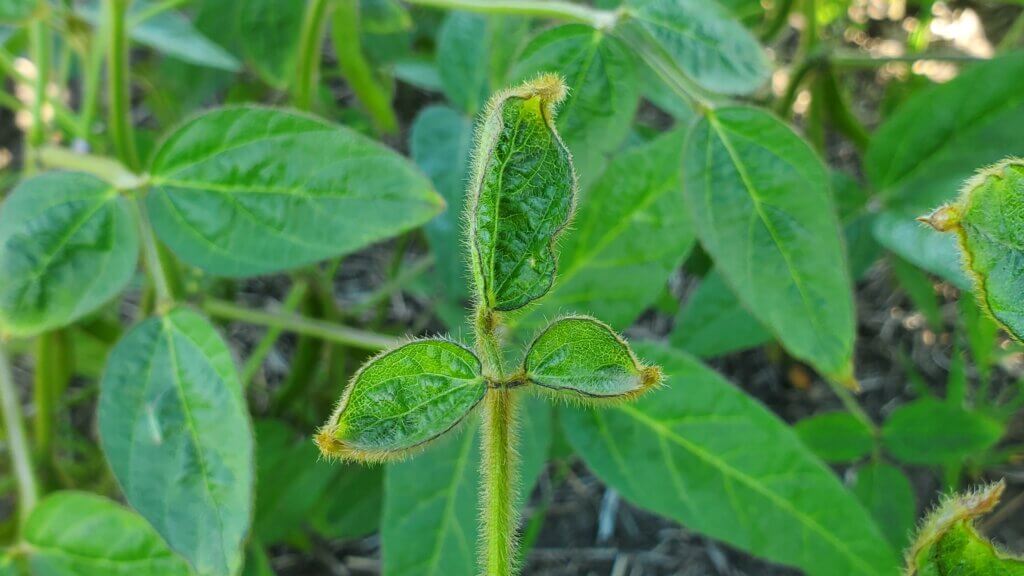
The decision on which application method is best for herbicides boils down to two main factors: (a) target type and (b) mode of action. In general, it’s easier for sprays to stick to broadleaf plants on account of their comparatively larger leaf size and better wettability compared to grassy plants. There are exceptions, of course – at the cotyledon stage, broadleaf plants can be very small and a finer spray with tighter droplet spacing may be needed. Water sensitive paper is a very useful tool to make that assessment. Imagine if a tiny cotyledon could fit between deposits – that could be a miss!
Some weeds are also more difficult to wet, and those may also need a finer spray or a better surfactant for proper leaf contact. An easy test is to apply plain water to the leaf with a spray bottle. If the water beads off or the droplets remain perched on top in discrete spheres, the surface is considered hard to wet. Most grassy weeds are hard to wet, while most broadleaf weeds are easy to wet.
Grassy weeds are an especially difficult target because they have smaller, more vertically oriented leaves, and almost without exception are more difficult to wet than broadleaf species. All these factors call for finer sprays for effective targeting and spray retention.
Broadleaf weeds usually have more horizontally oriented leaves which also happen to be larger. As a result, they can intercept larger droplets quite efficiently.
There are about thirty mode of action (MOA) groups among the herbicides with about ten accounting for the majority in Canadian prairie agriculture. It’s probably an over-simplification to categorize them into just two groups – systemic and contact. But that grouping goes a long way to making an application decision.
Contact products (MOA Group 5, 6, 10, 14, 22, 27) must form a deposit that provides good coverage. Good coverage is an ambiguous term that basically means that droplets need to be closely spaced and cover a significant proportion of the surface area because their physiological effects occur under the droplet, and don’t spread far from there. One way to generate more droplets is to reduce droplet diameter, another is to add more water. A reasonable combination of both is ideal because simply making droplets smaller creates issues with evaporation and drift.
Systemic products (MOA Group 1, 2, 4, 9) will translocate within the plant to their site of action after uptake. As a result, coverage is less important as long as sufficient dose is presented to the plant. In practice, this means coarser sprays and/or less water may be acceptable.
When two factors are combined, either in a tank mix or a weed spectrum, the more limiting factor rules. Application of a tank mix or product that is active on both broadleaf and grass plants will be governed by the limitation placed on grass targets. A tank mix comprised of both systemic and contact products is governed by the limitations placed on contact products.
A factor we should also consider is soil activity and the presence of residue. Studies have shown that soil-active products are relatively insensitive to droplet size. But if they have to travel through a layer of trash to get to the soil surface, more application volume is the best tool.
Below are some recommended spray qualities and water volumes for use in Canada. The spray qualities listed in the table can be matched to a specific nozzle by referring to nozzle manufacturer catalogues, websites, or apps. Note that Wilger also offers traditional VMD measurements on their site, allowing users to be a bit more specific if necessary.
We’ve had dire warnings about possible pesticide shortages and price hikes for 2022. Price hikes are one thing. But if the products we need simply won’t be available, we have a tougher challenge. It’s time to plan pesticide conservation.
But first, what’s behind the product shortage?
Emily Unglesby of dtnpf.com provided an excellent overview of the issue here and here. She said the reasons for the shortage are many-fold and came together in a perfect storm. Starting about 2017 or so, pesticide manufacturers tried to reduce the overall inventory of products to improve logistical efficiencies. That effort was rewarded in 2019 when a wet spring in the US dramatically reduced seeded area to a low of 165 M acres. The resulting lower demand again provided incentives to reduce inventories. At the same time, US trade sanctions against China in the form of tariffs impacted production and shipment of many active ingredients to US markets. When Covid-19 happened, it affected both production and shipping of many goods, including pesticides. Container shipment costs increased sharply, and the ability to move them to and from ports was hampered. This then coincided with record seeded area in the US of 180 M acres in 2021, creating higher than usual demand. By that time, very little buffer remained in the system. The growth of Enlist E3 and Xtend Flex has placed additional pressure on glufosinate.
Then two further events occurred. Hurricane Ida forced a shutdown of Bayer’s Louisiana glyphosate plant. And China, in late 2021, legislated a temporary 90% reduction of yellow phosphorus production in Yunnan Province in anticipation of the 2022 Olympic Winter Games. With phosphorus as a fundamental ingredient in glyphosate, glufosinate, and some fertilizers, this loss of production places significant strain on many products. The usual habit of returning unused pesticides to the retailer also became less common amidst shortage news, adding difficulty to planning inventories and demand.
Shortages of popular herbicides like glyphosate, glufosinate, and clethodim will put demand on alternatives. Spreading out risk by implementing pre-emergent products where possible will pay dividends. But the ability to ramp up production of minor products is just as dependent on the supply chain, and these alternatives may therefore not offer reprieve if ordering is left to the bitter end. Planning ahead and staying in touch with retailers about your plans and your own inventory will assist the entire system in managing production and redistributing existing stocks.
Safe to say products will be more expensive, and possibly impossible to obtain. Here are some things to consider to minimize the impact.
1.Grow crops that require less pesticides. Crops which have good genetic resistance to insects and disease will be more likely to cope without a protective spray. Some crops are inherently competitive early on and give less time and space for weeds to become established. Remember that the relative time of emergence is important for crop yield loss from weeds. If crops emerge before weeds, they have the upper hand and will maintain higher yield potential. Crops that can be seeded early will prevent weeds from occupying that niche.
A competitive crop is the best herbicide.
2. The most powerful herbicide is a competitive crop. Use agronomic tools that favour good seedling establishment. The usual advice of seeding into a warm, firm, moist seedbed, should we be fortunate enough for the weather to cooperate, applies here. There is value in higher seeding rates to help outcompete weeds. Use fertilizer placement that favours crops, not weeds, such as side banding.
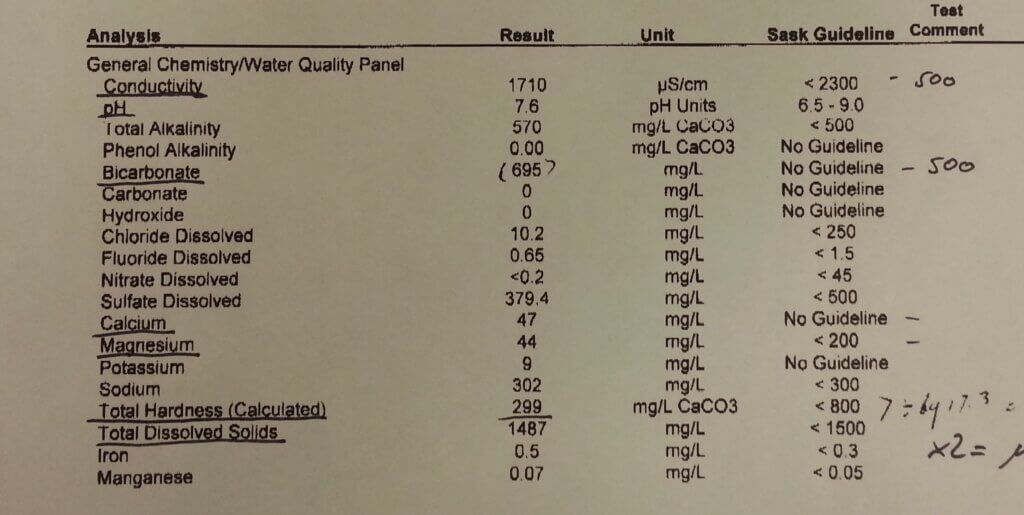
3. Sample the spray water source and have it professionally tested. After a record drought in western North America, aquifers are low and surface waters have receded. Water quality will probably not be the same it has historically been. Use water conditioners to reduce effect of hard cations and bicarbonates. Ammonium Sulphate (21-0-0-24) at 1% w/v is a general treatment, harder water may require up to 3%.
Conduct a water test in 2022 and condition spray water if necessary.
4. Do not use untested mixes of pesticides with specialty foliar fertilizers. These may impact herbicide performance, or worse, result in an incompatible mix.
5. Use the lowest label rate of product that is relevant for the pest you’re trying to control. Many products have a range of rates depending on the weed species and stage. Scout your fields and take advantage of the lower rate option if you can.
Invest in logistics and be prepared to respond to a good spray day to get the timing right.
6. Spray herbicides early. It’s been shown that crop plants can sense the presence of weeds before they compete for resources, causing a physiological adjustment that results in irreversible yield loss. The shorter the time that weeds and crops co-exist, the better. Also, smaller weeds are easier to control. Weeds that escape this early application will need to compete with an established crop and won’t thrive or impact yield as much.
Smaller weeds are easier to control and may allow a lower label rate.
7. It’s not advisable to reduce product rates from the one recommended on the label. Although label rates contain a margin for poor conditions, the risk of selecting for polygenic resistance exists. Polygenic resistance occurs when some weeds happen to be slightly more tolerant to the herbicide than the rest of their cohort. These weeds may survive a lower rate, and go on to produce seeds. If these outcross with other survivors, their more tolerant offspring will increase in relative abundance. With further such selections in subsequent generations, weeds become even more tolerant and eventually dominate.
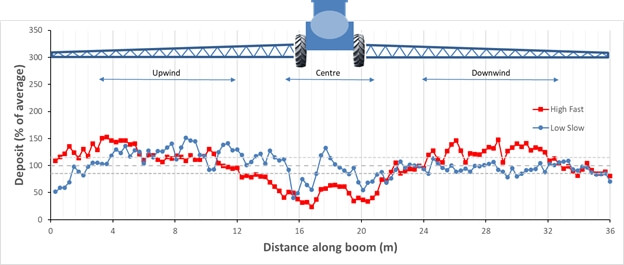
8. Apply the spray as uniformly as possible. Make sure the spray nozzles are within a 5% flow rate tolerance along the entire boom. If the set is older, consider a wholesale replacement. But the biggest enemy of uniform deposition seems to be turbulence created by wind and driving speed around the tractor unit. Slower wind and travel speeds help somewhat. Variable deposition means that some regions receive up to 50% more than intended, and others receive 50% less. This means weeds in the lower deposit regions may survive the application. The more variable the application, the higher the rate that is needed for acceptable control.
Slower travel speed reduces variability of the spray deposit, limiting escapes.
9. Use finer sprays whenever the tank mix contains a contact mode of action product (e.g., Group 1, 6, 10, 14, 15, 22, 27) or targets grassy weeds. Both situations require smaller droplets for best performance. The use of finer sprays may mean fewer hours in the day when drift is acceptable, and as a result, investment in efficient tendering and cleaning as well as overall time management pays dividends.
10. Make efficient use of the product in the tank, preventing waste. The amount of product being discarded can range to over 10% of the total needed to treat a field, but this can be reduced to 3% with the proper steps. The following are areas where improvement is possible:
(a) Prime the boom efficiently using sectional shutoffs or better yet, a recirculating boom. These can be primed without any spray leaving the nozzle or boom ends.
Conserve product by eliminating priming waste with a recirculating boom.
(b) Measure the spray mix of the last tank accurately, minimizing leftover. Consider the AccuVolume system that weighs the tank contents to the closest gallon. Tanks can be filled with the exact amount, and rates can be adjusted as the leftover becomes apparent on the last passes.
Accurate measurement of tank volumes prevents leftovers.
(c) Invest in individual nozzle shutoffs to improve sectional control resolution. These are part of any Pulse Width Modulation system but can also be obtained as air-actuated valves that are very affordable. Such capability is necessary for recirculating booms.
Nozzle sectional control can save 4 to 5% product use.
14. Consider an optical spot spray system such as the WEEDit Quadro, the Trimble WeedSeeker, or the John Deere See & Spray Select, available for 2022. These systems are “Green on Brown”, meaning they selectively spray just weeds in a burnoff or chem-fallow. This can save about 70% of the spray depending on weed density. More such systems are on the way, some even offering “Green on Green” that selectively identifies weeds among a crop. The return on investment of these systems is directly related to the pesticide cost, meaning in a year with high pesticide prices they pay off faster. If shortages of product become a reality, a spot sprayer may be the only way that some fields get treated at all.
Pesticide shortages will not be fun. Unfortunately, their appearance coincides with higher fertilizer prices, meaning crop establishment will need to overcome that factor as well. But there are tools to minimize the impact if we’re willing to implement them. Just as necessity is the mother of invention, scarcity is the father of conservation.
Today’s sprayer has to excel at a lot of things. It has to have capacity and low weight. It has to go fast but be comfortable. It needs wide booms that stay level over complex terrain. It has to deliver the right spray volume at the right spray quality for the job. It has to be easy to fill and easy to clean. And of course, it has to be reliable, affordable, and come with dealer support.
We’ve definitely made progress in many of these areas. But the overall package still leaves lots of room for improvement and doesn’t address some issues that are of importance to applicators. Is it time for a reset?
Let’s say cost is no object. Here’s where I think the industry could go.
Focus on spray delivery
Spraying is done to protect crops. We need to do it without harming the environment while being economical with the inputs. These three tenets make up the Application Triangle, sometimes known as the 3 Es of spraying: Efficacy, Environment, Efficiency. The triangle represents the need for balance. A gain in one or two areas often requires a loss in another. That’s why there has never been a so-called “silver bullet” in spraying.
Priority 1: Only spray when and where required. Site specific treatments and IPM have been slow to make their way to the spraying world partly because of the low cost of inputs, but also because of difficulties defining and mapping areas that require different rates or products. The machine learning revolution is changing that. Green on Brown or Green on Green sensing can do more than save inputs. They can generate maps that document the change of weed patches over time, identifying priority areas and threshold densities and flagging problems early.
Priority 2: Integrate air assist. Air carries small droplets towards the target, protecting them from displacement by travel-induced or ambient winds. Once there, air can improve target interception and retention. It has to be done right, though, as improper adjustment can result in the opposite outcome. The reason it’s high on this list is because it improves efficacy and environmental protection at a modest cost.
Priority 3: Improve droplet size control. Nozzle design has improved, but the overall range of spray qualities that is achievable for any specific nozzle remains narrow. Sprays can be made finer or coarser with spray pressure, but this has implications for pattern uniformity. Twin Fluid nozzles currently offer the widest range of spray qualities, allowing one nozzle to do it all. We simply need greater droplet size flexibility on the spray boom.
Priority 4: Use nozzle-specific rate control. At minimum, a sprayer needs a system that allows for individual nozzle rate control within a wide window, say 4:1. This allows consistent dosing over a wide speed range, turn compensation, or local adjustments to dose for specific (sensed) canopy conditions. By layering direct injection at the nozzle on top of this, the sprayer can change rate and volume independently. Being able to spray the right amount in the right spray quality at the right volume, where needed completes the opportunity created by pest and canopy sensing.
Create better infrastructure
The backbone of the sprayer, the frame, drivetrain, boom, tank, pump, and plumbing, are responsible for carrying and delivering the spray liquid. Poor management of these variables results in an unproductive, heavy machine.
Priority 1: Prepare booms for future. A limiting factor in sprayer performance is boom width and stability. Consistent and low boom heights are the cornerstone of good application, ensuring uniform distribution, reducing drift potential, and improving targeting within the canopy. But perhaps as importantly, stable booms are essential for accurate optical spot spraying and any other sensing tasks that will rise in importance. Set a standard for sway, say target height plus or minus 10 cm along the width of the boom, 90% of the time. Do the same for yaw. Accommodate brackets for sensors and wiring harnesses when designing the boom fold.
Priority 2: Improve plumbing. Poorly executed sprayer plumbing causes waste and decontamination headaches. Although rubber hoses attached to plastic fittings provide a very versatile and generic building block, they generate and hide countless niches in which pesticide mixtures or active ingredient residue can accumulate. A simplified design that incorporates more engineered stainless steel tubing, smooth directional and dimensional transitions, interior surfaces that don’t accumulate residues and generate more efficient flows – all these would improve many aspects of the spray operation. It needs to be goal oriented – i.e., zero waste in priming and cleaning, guaranteed decontaminated after a rinse cycle. Draining on the ground should not be necessary.
Priority 3: Save weight. Weight causes compaction and eats fuel. Advanced materials or techniques can save weight while preserving strength. Savings can be applied to capacity. We need to explore advanced materials and trussed or exoskeletal designs (see “Aerodynamics”).
Priority 4: Consider aerodynamics in chassis and boom design. Wind blowing past a tractor, tank or boom, or counter-rotating air from wheels creates turbulence that displaces small droplets within it, reducing uniformity. Cleaner air makes it easier to use smaller droplets, easier to implement air assist or any other drift-reducing technology. This is no small task, as air can come from any direction. But as units become larger and travel faster, this effect can’t be ignored. Monocoque designs that use aerodynamic exteriors to carry machine weight may provide an answer.
Provide quality control
Spraying can be a guessing game, hence the terms “Spray and Pray”. We don’t know the outcome for days or weeks, depending on the mode of action, and by the time the result is known, it is too late to do anything if it’s unsatisfactory. But we can do better in assuring some sort of standard.
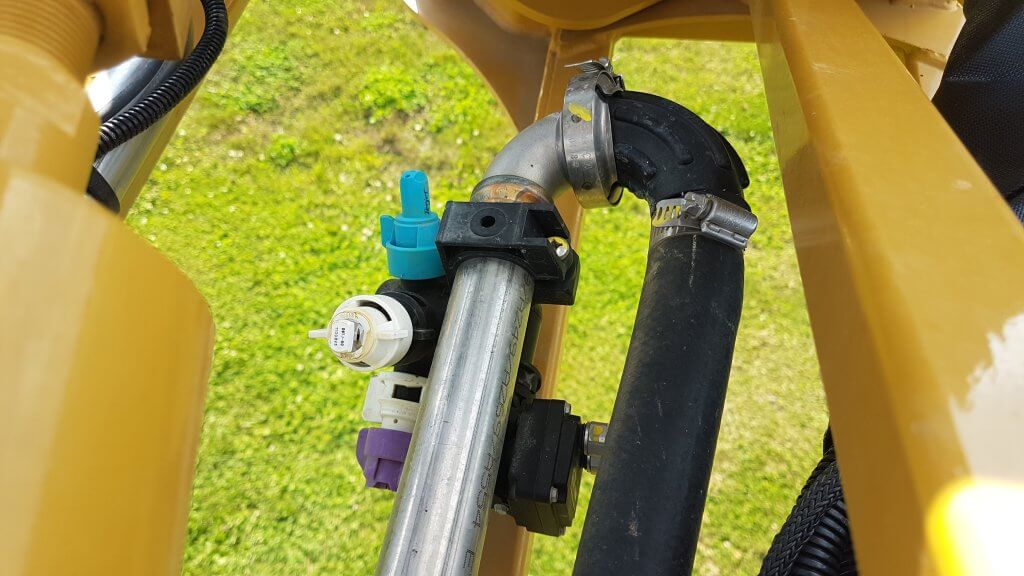
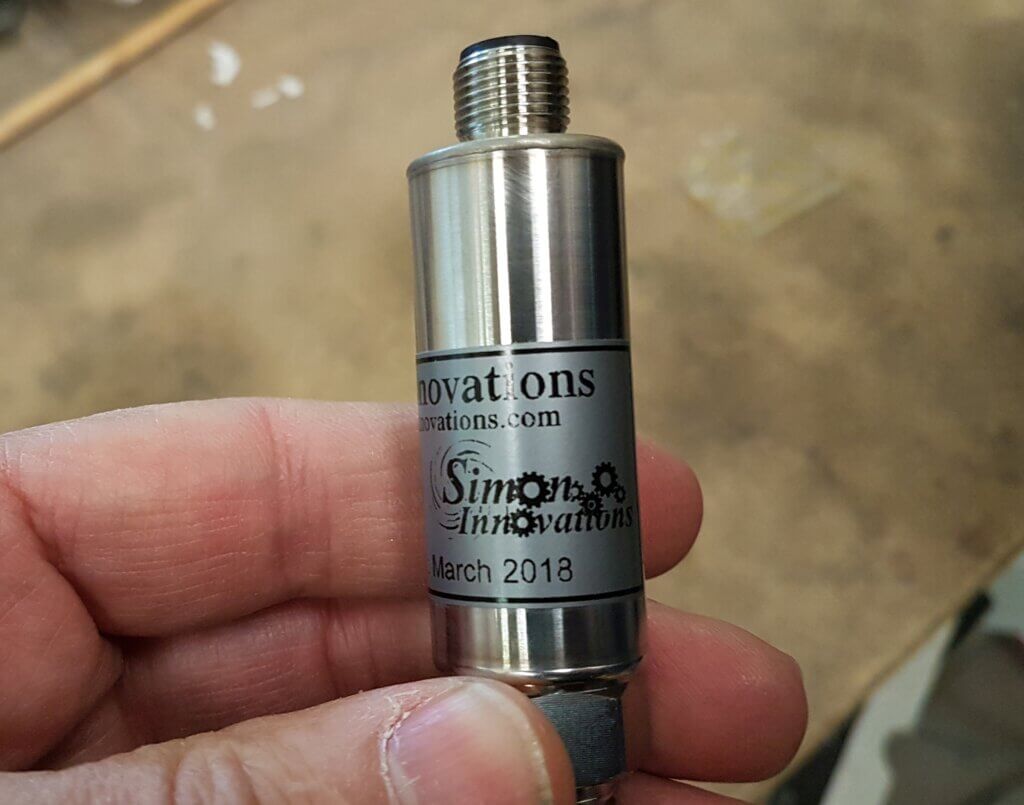
Priority 1: Confirm pressure, flow, and patterns at nozzles. The average sprayer has one flow- and one pressure-sensor. It can confirm the flow of the entire spray boom but cannot do that at the nozzle level. PWM has helped, by inferring flow from duty cycle. But actual liquid flow, and its pressure, remain unverified at the spray tip. A visual inspection of the pattern is necessary, and this is not only impractical but also wasteful and potentially hazardous.
Priority 2: Characterize canopy. If we knew the crop canopy was dense or sparse, we could adjust the water volume or rate of the product accordingly. LiDAR (Light Detection and Ranging) can characterize the physical structure of an object that would indicate density or porosity for which a dose (or droplet size, or air) adjustment may be necessary. This is not some future technology. The iPhone 12 Pro has it. Even RGB image processing could do something very similar.
Priority 3: Confirm coverage and drift. Say we’ve characterized the canopy and adjusted the atomization to suit. Is it having the intended impact? We will need a way to verify that the settings of the sprayer result in the required canopy penetration and coverage, even drift, on-the-go. We would need sprayer-mounted sensors that see spray deposits or an airborne spray cloud. The verification must be fast enough to make corrections during the spray operation. This kind of quality control provides the feedback loop to the first priority, spray delivery. It creates a perfect environment for machine learning and continuous improvement.
Priority 4: Improve user interface. The complexity of modern equipment monitors is great if you’re familiar with their features. But if you’re a new user or less comfortable with layers of screens and buttons and warning beepers, navigating the monitor can be a game stopper. Can we have beginner modes? Or a system where the monitor more actively engages with the user, asking questions or reminding a novice of key settings? The friendliness of the interface is a sleeper issue, it seems less important at first look but can over-ride many equipment features because of the power of a positive user experience.
I challenge sprayer manufacturers to conceptualize and show us the ideal sprayer they’re working towards. The perfect unit may never reach us, as this proposal is rife with technological and cost barriers. But it is nonetheless important to identify priorities and identify possible ways to meet them. As we creep towards the solution with incremental improvements, recall that its not the size of the step that matters, it’s the direction.
Authors: T M Wolf, B C Caldwell and J L Pederson. Originally published in Aspects of Applied Biology 71, 2004, in expanded form.
Abstract
Spray drift deposition into water bodies may pose environmental and health hazards, and buffer zones have been suggested as a means of mitigating water contamination. Field trials were conducted to determine the effect of nozzle type and riparian vegetation on spray drift deposition into wetlands. Three riparian vegetative types, minimal vegetation (grass), low vegetation (willow shrubs), and high vegetation (aspen trees) were compared with open field conditions. Spray was released upwind of wetlands with these riparian characteristics with conventional and air-induced low-drift nozzles. Low-drift nozzles reduced drift deposits by about 75% in the absence of any vegetation, and by 88 to 99% when vegetation was present. Dense willow shrubs resulted in anomalous downwind deposits, possibly because of air turbulence caused by low porosity characteristics. By considering vegetation effects, a 15-m buffer zone could be reduced to 5 to 7 m for conventional, and 1 to 4 m for low-drift nozzles without increasing deposits at the edge of the sensitive habitat. Both variables should be considered by regulatory bodies in their risk assessment procedures.
Introduction
Airborne transport is an important vector for movement of pesticides from agricultural land to receiving waters. In an effort to maintain low pesticide levels in water bodies in accordance with risk assessment protocols, the Pest Management Regulatory Agency (PMRA) is mandating minimum setback distances (buffer zones) from water bodies during a spray operation. Several additional variables can complement buffer zones in preventing spray drift, including low-drift sprays and riparian vegetation. Germany and the United Kingdom already account for these characteristics in their buffer zone regulations (Kappel and Taylor, 2002).
Vegetation has been shown to be effective at mitigating droplet spray drift in several recent studies and reviews (Richardson et al., 2002, Hewitt, 2001, Ucar and Hall, 2001) by reducing wind velocities and intercepting spray. The documented magnitude of the spray drift deposit reduction in these studies ranges from 50 to >95%, dependent on variables that include vegetation height, porosity and orientation relative to wind direction, and wind speed.
We studied the integrated effect of buffer zones, vegetative barriers, and low-drift sprays to determine the overall impact of spray drift deposition onto downwind water bodies.
Materials and Methods
Overview and Site Description
The study was conducted in 2001 on a farm field near Aberdeen, SK. Sprays were applied upwind of a water body, and drift deposits were collected on petri-plates placed near ground level. Experimental sites were chosen to represent different vegetation heights and types around the water body in question: low (uncut grass), intermediate (willow shrubs), and tall (aspen trees). These were compared to nearby open-field conditions. Two sprayer nozzle types were used in the study: conventional flat fan nozzles and venturi-type low-drift nozzles.
The grass barrier was comprised of a mix of grasses dominated by bromegrass (Bromus spp.) growing to a height of 75 cm. Willows (Salix spp.) were approximately 3 m tall with a density of about 0.15 m-2 and presented a fully foliated barrier for their full height. Willows extended for a width of about 7 m toward the edge of the water body. Trembling aspen (Populus tremuloides Michx.) were approximately 8 m tall, with foliation beginning 1.5 m above ground. Trees were present at a density of about 0.25 m-2 and extended for 8 m toward the water edge.
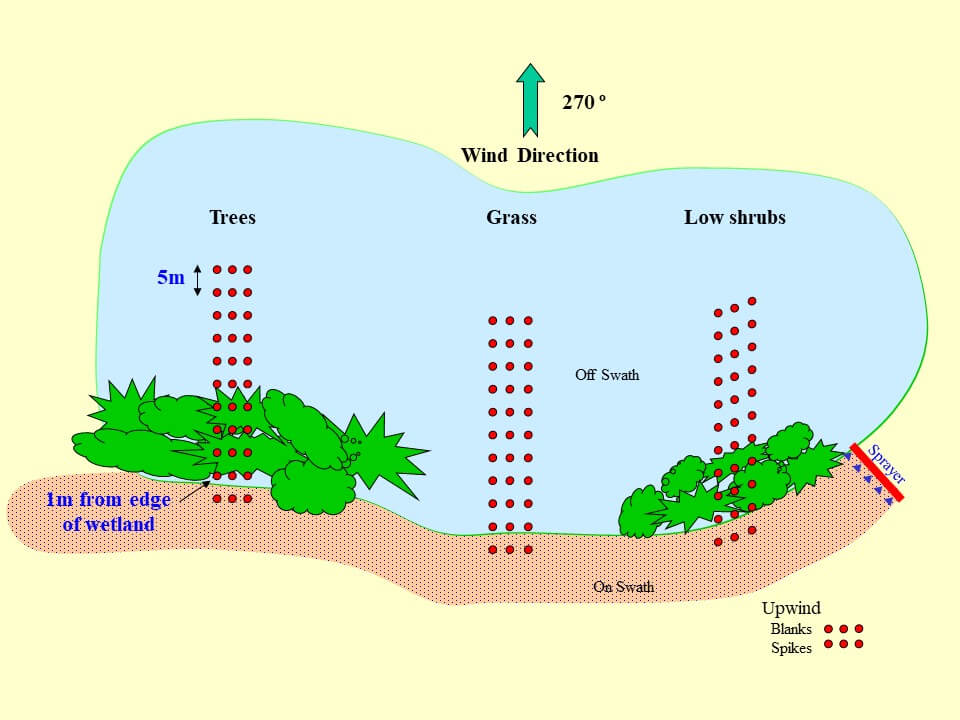
Figure 1: Site and sampler layout
Spray Equipment and Application Method
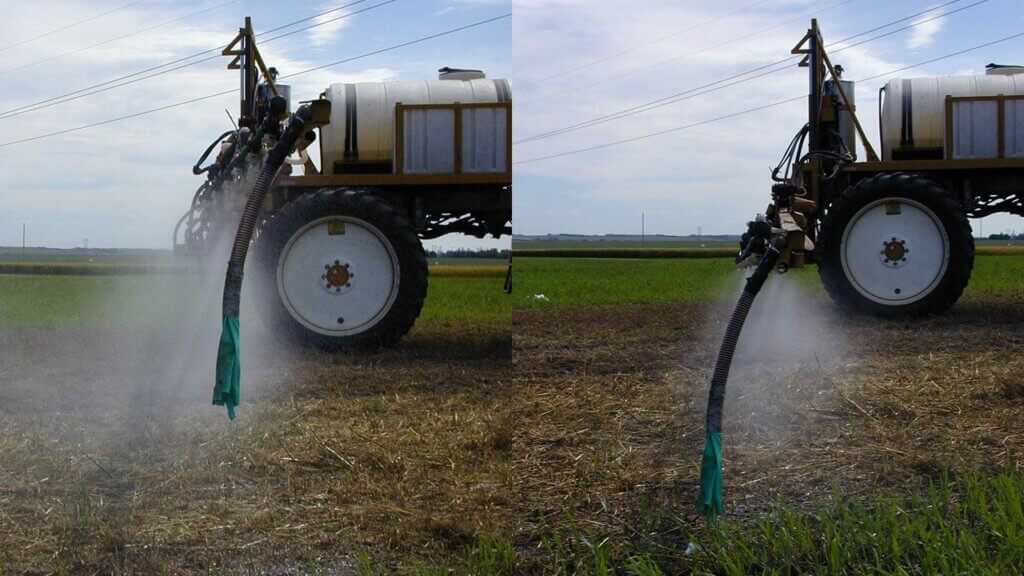
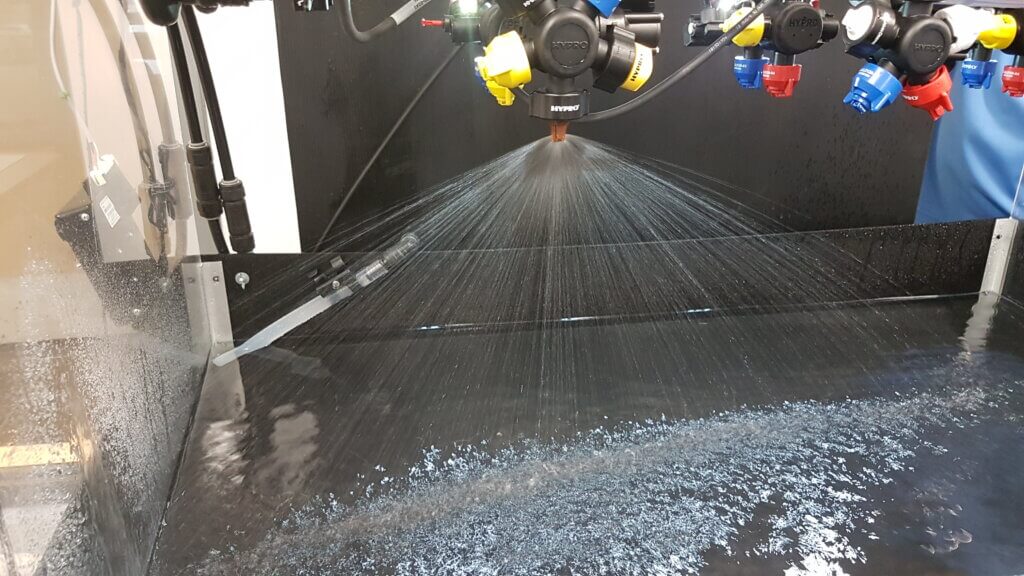
A Melroe Spra-Coupe 220 was used to make the applications. This sprayer was equipped with conventional flat fan nozzles (XR8003) and air-induced low-drift nozzles (TD11003) at 275 kPa, producing ASABE Fine and Coarse sprays, respectively. The spray boom was 10 m wide and nozzles were 75 cm above ground. Sprayer travel speed was 12.9 km h-1, at which the application volume was 100 L ha-1.
The sprayer tank contained a mixture of 2,4-D amine4 (4 g L-1) and Rhodamine WT5 (2 mL L-1), a fluorescent tracer dye which would be used to quantify the deposits. 2,4‑D acted to photostabilize the dye, and also provided a spray formulation with physico-chemical properties representative of agricultural pesticides.
Top row: Fine and Coarse sprays used in study Middle row: Tall and medium vegetation Bottom row: Short vegetation and open field
Application was made in a direction approximately perpendicular to the prevailing wind, with the downwind edge of the spray boom at the edge of the wetland’s riparian vegetation. This was usually about 15 m upwind of the edge of the water body (due to severe drought conditions, the wetland did not contain any water at the time of the trials). Three consecutive passes were made along the same swath in a 10-min period to obtain average meteorological conditions for all three vegetation types. Wind speed and direction, temperature and relative humidity were monitored during application using a portable micrometeorological station.
Sampler Layout
Downwind of the spray swath there were 3 parallel lines of eleven 15-cm diameter glass petri-plate samplers starting underneath the sprayer boom and extending 46 m downwind from the edge of the spray swath (Figure 1). Samplers were separated by 5 m within the line, and lines were about 2 m apart.
The deposition profile was also assessed under open field conditions, using the same sampler layout but on crop land with no riparian vegetation. These are referred to as ‘bare soil, or ‘reference’ samplers in this report and served as a baseline to determine the impact of the riparian vegetation.
Sample Collection and Analysis
Sample collection began 5 minutes after spray application was complete (See Table 2 for trial times). Beginning with the furthest downwind locations, petri-plates were covered with a plastic lid, and placed into dark boxes. Spray deposits on the samplers were washed off in the laboratory using 95% ethanol in three 15-mL washes. Final samples were made up to 50 mL. and two 20-mL sub-samples were collected in borosilicate vials and stored in the dark.
Within 24 h, subsamples were analyzed using a fluorescence spectrophotometer with excitation and emission wavelengths of 545 and 570 nm, respectively (Shimadzu Model RF-1501 spectrofluorometer equipped with Model ASC-5 auto-sampler). Instrument readings were converted to µg L-1 using standard curves and expressed as a percent of the applied dosage under the field sprayer.
The fluorescence spectrophotometer data were averaged over the three replicate sampling lines, adjusted for photolysis, and expressed as a percentage of the amount applied on-swath. Relationships of spray drift deposits with downwind distance were first visualized by plotting all data points, and then mathematically related through appropriate regression techniques.
Results
Meteorological Conditions
Weather conditions were favourable during the trials. Wind speed and direction were appropriate for the sampler layout and the experimental objectives. Mean wind direction varied by up to 44º from the ideal (270º) in 6 out of 12 trials, and was within 30º for the remaining 6 trials (Table 1). Mean wind velocities were consistently between about 17 and 21 km h-1 in all but one trial. Air temperature and relative humidity fluctuated between 14 to 22º C and 31 to 80%, respectively, on the trial dates.
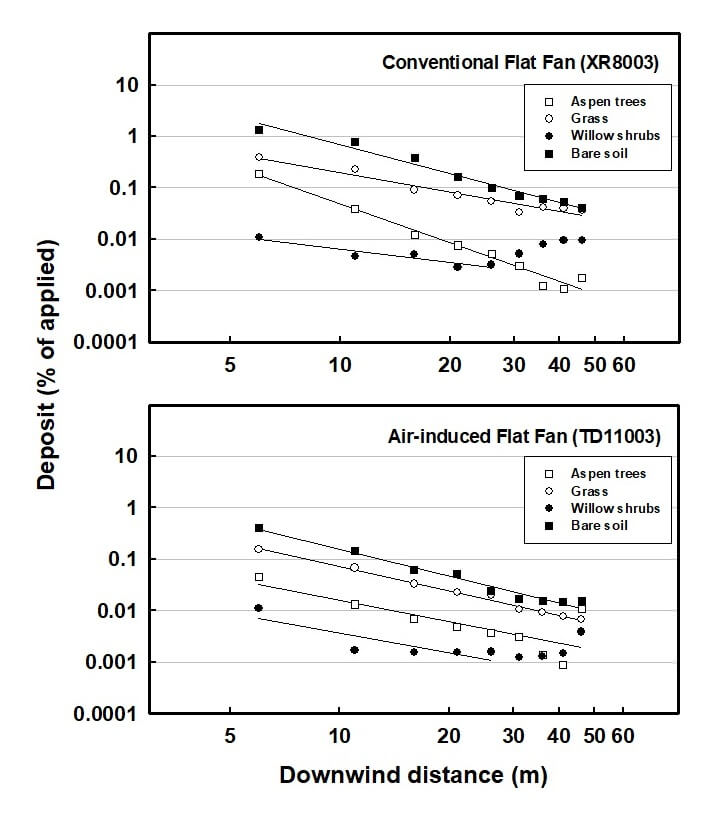
Deposition Profiles
A visual review of the raw data suggested that a linear regression of the log of deposit amount and log of downwind distance would be appropriate. It was noted that for willow, the deposit profile tailed upwards after the 26 m mark. Based on a survey of the site, it was concluded that this tail was probably caused by the length of the spray pass exceeding the length of protection offered by vegetation. In other words, beyond the 26 m sample, drift had not been attenuated by a vegetative barrier. It is also possible that the airflow was deflected up over the low, non-porous barrier and returned to ground level beyond the 26 m distance (Carter et al., 2001).
Figure 2: Spray deposit profiles from Fine (top) and Coarse (bottom) sprays. The deposition data for the willow were regressed from 6 to 26 m, all others were taken to 46 m (see text for explanation).
As a result of the questionable data for this vegetation type, it was decided that it would be misleading to include the furthest downwind data points. Implications of this observation will be discussed later in the manuscript. All regressions were statistically significant, explaining between 61 and 99% of the observed variation. In 5 of 8 trials, more than 90% of variation was explained.
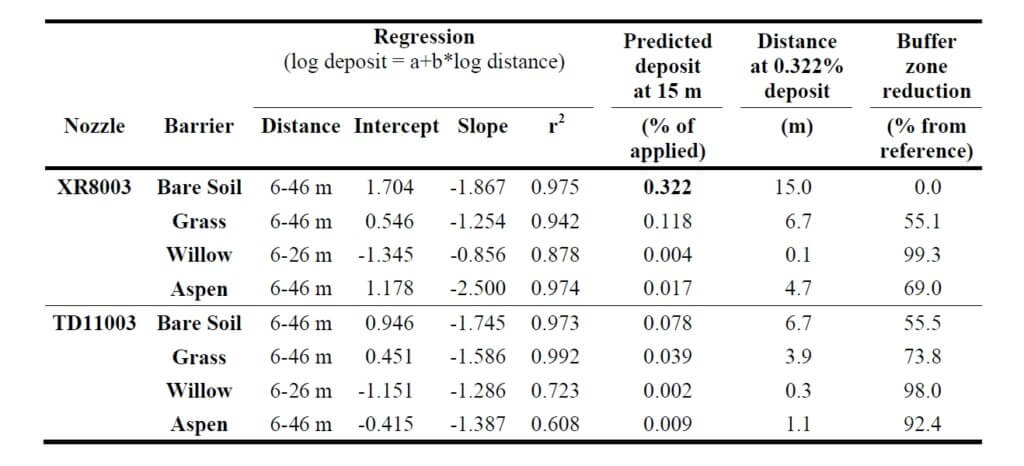
Drift Mitigation by Riparian Vegetation and Application Method
The predicted drift deposit at 15 m was calculated for all trials based on the regression parameters (Table 3). For the conventional sprayer on bare soil, the deposit amount was 0.322% of the applied dose. The distance at which this specific deposit amount would be achieved was then calculated for all other trials. This value is the buffer zone distance at which equivalent protection to the reference system was offered. Buffer zones could therefore be reduced by 55% (grass), 99% (willow) and 69% (aspen) using the conventional nozzle and 56% (bare soil), 74% (grass), 98% (willow) and 92% (aspen) for the low-drift nozzle.
Table 1: Buffer zone distances based on observed drift, calculated from regression.
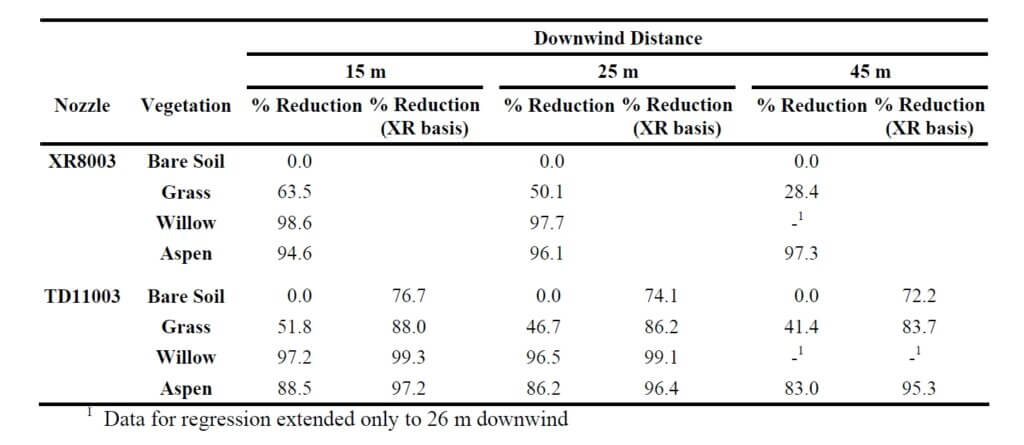
The calculated buffer zone reductions were not equivalent to the observed drift reductions due to the unique regression slopes of each deposition line. For example, expected drift deposits at 15 m downwind on bare soil were reduced by 77% when the air-induced low-drift nozzles were used (Table 4), whereas buffer zone distances could only be reduced by 56% (Table 3). Furthermore, the effectiveness of the grass vegetation diminished with distance, reducing drift by 64, 50, and 28% at distances of 15, 25, and 45 m, respectively. Therefore, a complete deposition profile will be required for each vegetation scenario to accurately adjust buffer zones.
Table 2: Drift deposits expressed as a percent of the reference deposition line for two application methods, four vegetation types, and three downwind distances. All numbers are the mean of three separate experiments on the same location.
Riparian vegetation was typically more effective than low-drift nozzles in protecting water bodies from drift deposition. While grass reduced deposition by 28 to 64% from the conventional nozzle (depending on the downwind distance), willow and aspen reduced deposition by between 95 and 99% (Table 4). The willow was not considered at further distances since the data used for the regression were truncated at 26 m. Low-drift sprays provided some additional protection in all cases except for trees at the 45 m distance, where deposits increased slightly relative to the conventional spray.
Discussion
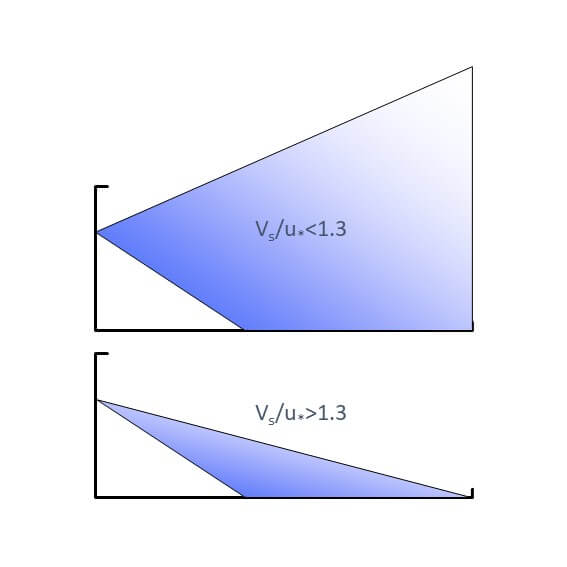
The aerodynamics of vegetative barriers are a complex phenomenon. Wind, upon reaching a solid barrier, is diverted up and over giving strongly turbulent conditions on the leeward side and a rapid return to free wind speed. For a permeable barrier like a hedge, the return to free wind speed is more gradual since some air filters through, reducing the pressure differential and allowing for less turbulence (Davis et al., 1994). Wind speed reduction is most pronounced for a distance of 5 H upwind and 30 H downwind at the 1 H height, where H is the height of the barrier (Rider, 1951). Nonetheless, there may still be an upward diversion of air (and spray drift) which may simply delay, not eliminate, sedimentation (Hewitt, 2001, Ucar and Hall, 2001), particularly for dense hedges (Carter et al., 2001). Richardson et al. (2002) did not, however, notice such a deflection up to 10 m height.
The reduction in drift deposition by riparian vegetation in this study is clearly significant, but is subject to some interpretation. These data were generated at a single site, and while this site was carefully selected to be representative and trials were repeated three times, it does not necessarily constitute an average result. There are clearly any number of possible arrangements of trees, shrubs and grass, plus any additional vegetative or landscape features which would influence drift deposition behaviour. However, due to the consistent nature of the data of this study, some confidence is attained in that the numbers are at least reliable for the given set of conditions. In this study, three spray passes were made along the same swath at the edge of the water body. Results could have been different had adjacent spray swaths been used, owing to the possible change in contribution of upwind swaths with the altered airflows under vegetated conditions.
Since the water body was dry, additional grass vegetation which had grown up could have made an effective collector of spray drift, possibly reducing deposit values beyond those that would have occurred in a water body. It is recommended that efforts be made to repeat these studies when water is present at normal values.
The mitigating effect of vegetation depends on the aerodynamic features of the vegetation, as well as the collection efficiency of their leaves, twigs, etc. This poses some difficulties because there are no absolute measures of these features. Permeability, for example, varies with wind speed owing to the movement of leaves, and winds speed itself varies with height (Davis et al., 1994). Collection efficiency of the vegetation varies similarly with target size, its movement, wind speed, and droplet size spectrum (Hewitt, 2001). However, there are opportunities for improved characterization with specialized equipment, such as that used by Richardson et al. (2002). Their LIDAR instrument was able to help calculate tree height and width, mean area index and mean area density. Work to further characterize vegetation will prove useful in future efforts to understand its mitigating potential.
Low vegetation such as grass has not received the recent attention of hedges and trees but has also been documented to reduce spray drift significantly. A study by Miller et al. (2000) documented significant reductions in airborne drift concentrations above uncut grass canopies, even at low plant densities. Bache (1980) documented similar reductions in spray drift when sprays were applied over a mature wheat crop compared to bare soil. Therefore the filtering effects of “low” canopies may be very significant and should be the subject of further study.
Riparian areas are regions of high biological activity and diversity, not only protecting adjacent water from outside influence, but also providing food and shelter for many species of wildlife. These areas must themselves be protected from harmful effects, which can include pesticides. Their efficient capture of sprays suggests some risk from pesticides capable of controlling perennial vegetation. Likewise, pesticide residues in this vegetation have the potential to be ingested by wildlife or be washed off with precipitation, resulting in movement into the water body. These effects must be considered when using vegetation to mitigate airborne drift.
Conclusions and Recommendations
Vegetative barriers reduced spray drift deposition from conventional or low-drift nozzles into water bodies by 24 to 99%.
Low-drift sprays reduced deposition by about 75%.
Of the vegetation types, shrubs and trees had similar effects, reducing deposition from open-field conditions by an average of more than 95%. Low-drift sprays improved on this reduction.
Calculated buffer zone reductions were less than drift deposit reductions. Accurate determination of buffer zone distances requires that the entire deposition profile be characterized.
It is suggested that both riparian vegetation and sprayer technologies are important components of water body protection. Both should be considered in BMP and regulation development whenever the impact of pesticide applications near water bodies is to be estimated or mitigated.
Acknowledgements
The technical assistance of Glenda Howarth, Jill Clark, Rachel Buhler, Murray Nelson, Trevor Linford, and Pam Reynolds is greatly appreciated. Financial assistance was provided by the Rural Quality Program of the Agri-Food Innovation Fund, administered by the PFRA. The authors wish to thank Darrell Corkal and Clint Hilliard of PFRA for their enthusiasm, support and guidance directed towards this project, and Raymond Malko for making his land available for the trials.
Citations
Bache, D. H. 1980. Transport and capture processes within plant canopies. Spraying Systems for the 1980’s. BCPC Monograph No. 24, 127-132.
Carter, M. H., R. B. Brown, K. A. Bennett, M. Leunissen, V. S. Kallidumbil, and G. R. Stephenson. 2000. Methods for reducing buffer zone requirements for pesticide spraying adjacent to wetland environments. Sainte-Anne-de-Bellevue, Quebec: Proc. 2000 National Meeting, Expert Committee on Weeds / Comité d’experts en malherbologie [on-line: http://www.cwss-scm.ca/pdf/ECW2000Proceedings.pdf].
Davis, B. N. K, M. J. Brown, A. J. Frost, T. J. Yates, and R. A. Plant. 1994. The effects of hedges on spray deposition and on the biological impact of pesticide spray drift. Ecotoxicology and Environmental Safety 27:281-293.
Hewitt, A. J. 2001. Drift Filtration by natural and artificial collectors: a literature review. Special publication by Spray Drift Task Force, 12 pp. [on-line: http://www.agdrift.com]
Kappel, D. and W. A. Taylor. 2002. Buffer zones and “low drift” equipment. Hardi International Discussuion Paper, available from Hardi International A/S Helgeshøj Allé 38 DK-2630 Taastrup.
Miller, P. C. H, A. G. Lane, P. J. Walklate, and G. M. Richardson. 2000. The effect of plant structure on the drift of pesticides at field boundaries. Aspects of Applied Biology 57:75-82.
Richardson, G. M., P. J. Walklate, and D. E. Baker. 2002. Drift reduction characteristics of windbreaks. Aspects of Applied Biology 66:201-208.
Rider, N. E. 1951. The effect of a hedge on the flow of air. Quarterly Journal of the Royal Meteorological Society 78:97-101.
Ucar, T. and F. R. Hall. 2001. Windbreaks as a pesticide drift mitigation strategy: a review. Pest Management Science 57:663-675.
Wolf, T. M. 2000. Low-drift nozzle efficacy with respect to herbicide mode of action. Aspects of Applied Biology 57:29-34.
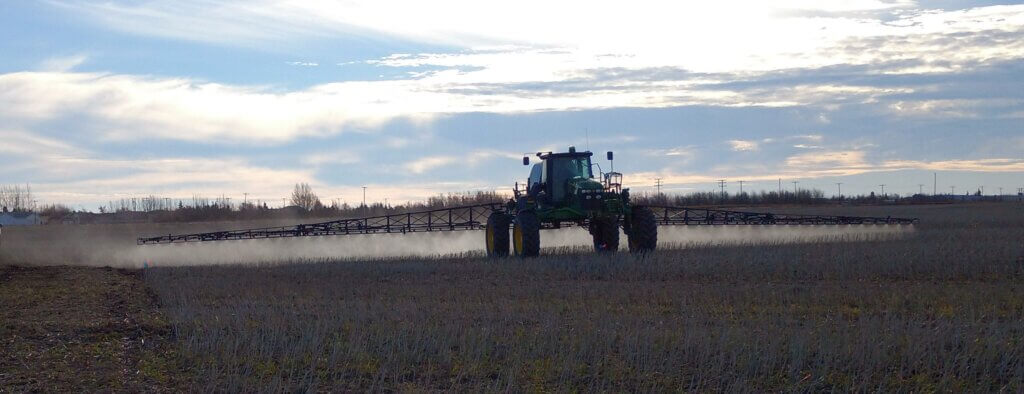
Choosing the right time to spray can be tricky. Our gut tells us that spraying when it’s windy is wrong. The experts tell us that spraying when it’s calm is wrong. So when can you actually spray?
I’ve always advised my clients to spray in some wind, because it has a few advantages. The main one is that wind helps disperse the spray upward and downward, diluting the spray cloud fairly rapidly. Another advantage is that winds tend to be reasonably steady in their direction and velocity (or at least that can be forecast), so downwind areas can be identified and potential impacts are known or predictable. It helps if it’s sunny, because that improves the dispersion of the cloud even more.
First, let’s define “windy”. The classic wind scale is the Beaufort Scale, intended for the sea, but also used on land. The upper limit for spraying is probably Force 3 or Force 4, with upper limits of 20 – 25 km/h or so. The Beaufort Scale calls these “Gentle or Moderate Breezes” (they had to save the alarming words for hurricanes), and the scale provides good visual clues such as what wind does to flags, leaves, or dust.
Spraying under breezy conditions can be done fairly safely if you follow specific steps. The idea is to understand what the risks are and to manage them.
The cornerstone is to use a low-drift spray and match it to a pesticide that will work well with larger droplets. But there are other important aspects to consider. Below are the top ten to think about:
Choose a herbicide that can handle large droplets. Glyphosate products are well suited to coarse droplets. But glyphosate commonly has contact actives in the mix, members of Group 6, 14, and 15, and these are less likely to perform well with big droplets than those that contain Group 2 and 4 mixes. Actives with soil activity also have more tolerance for larger droplets.
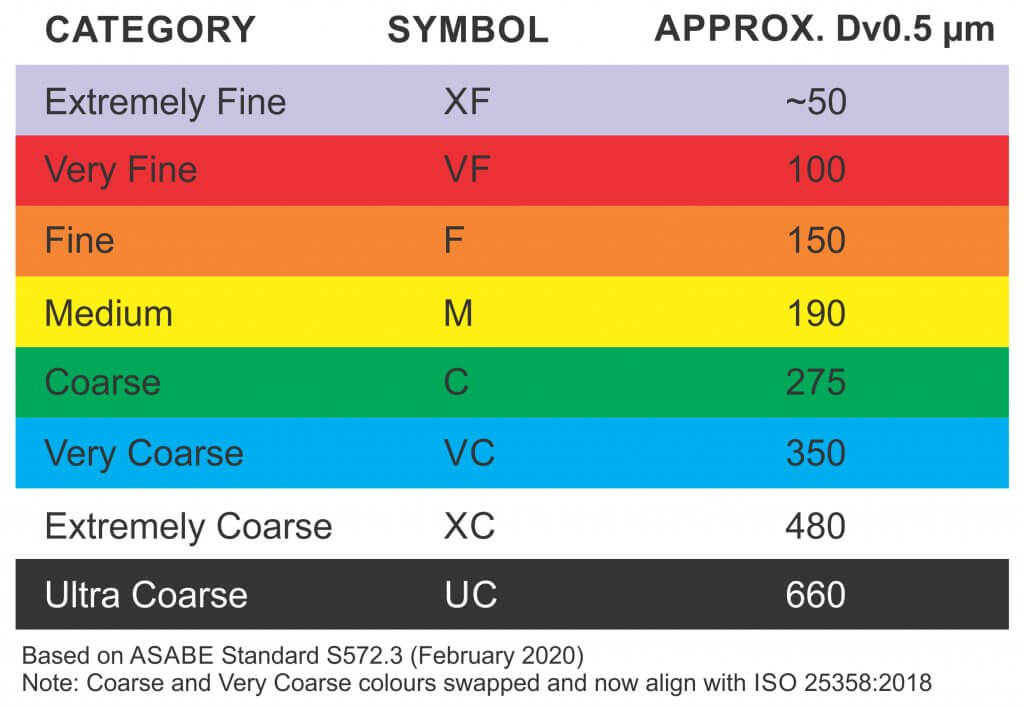
Use a low-drift nozzle and operate it so it produces a Coarse (C) to Very Coarse (VC) spray quality, as described by the manufacturer. Dicamba labels call for Extremely Coarse (XC) to Ultra-Coarse (UC) sprays, and Enlist requires at least Coarse. To achieve these you may need to purchase new nozzles. Low-pressure air-induced nozzles operated at about 50 – 60 psi will generally be very low-drift, but lower drift models are available. If you need a finer spray, produce it either by increasing the pressure or moving to a finer tip. Do this when the weather improves, for contact modes of action.
The name, symbol and range of droplet sizes used to describe the median droplet diameter produced by nozzles according to ASABE S572.3
Keep your boom low. Lowering the boom ranks as the second-most effective way to reduce drift, after coarser sprays. But there’s a limit. For low-drift sprays, you need at least 100% overlap (more for PWM), which is for the edge of one nozzle pattern to spray into the centre of the adjacent pattern. In other words, the spray pattern should be twice as wide as your nozzle spacing at target height. For most nozzles, a boom height of close to 20 inches is enough to achieve this overlap. That’s pretty low by current standards from suspended booms on self-propelled sprayers, so being too low for a good pattern will only happen due to boom sway.
Maintain reasonably slow travel speeds. These reduce the amount of fine droplets that hang behind the spray boom, reduce turbulence from sprayer wheels, and they also make low booms more practical. An added bonus is less dust generation.
Know what’s downwind and what harms it. Survey the fields on all sides of the parcel you’re treating. When you have a choice, avoid spraying fields that have sensitive areas downwind such as water, shelterbelts, pastures, people, etc. If you can’t avoid being upwind of these areas, make sure you check and obey the buffer zone restrictions on the label. These will also give you an idea if the product can cause harm in water or on land, or both.
Let the weather help you.
Take the wind from the side if you can. Going straight into the wind creates a lot of extra drift.
Consider a dicamba tip for special situations, even if you don’t use dicamba. If you’re in a situation where quitting and waiting is a poor option, these tips allow you to finish the job with minimal drift risk and with only slight reductions in product performance due to poor coverage.
Use a low-drift adjuvant. Specific products such as Interlock or Valid have been shown to reduce driftable fines (<150 microns) by between 40 – 60%, without adding significant volume in coarser droplets. The response will depend on the nozzle and the tank mix, but can be very noticeable.
Study drift and how it forms and moves. It’s about more than wind speed and droplet size. Knowledge in this area can help you work out the best strategies.
Invest in productivity. You may not need it every day, but on occasions when you have a small window to avoid bad weather, it pays dividends.
If you feel that drift is unavoidable and someone might be impacted by it, talk to those people first. It’s one of the most important things you can do.
Keeping pesticide sprays on target continues to be one of our top responsibilities.