Tag: optical spot spray

  • Green-on-Green in Ontario: A Custom Operator’s Experience with See & Spray Premium

    Green-on-Green in Ontario: A Custom Operator’s Experience with See & Spray Premium

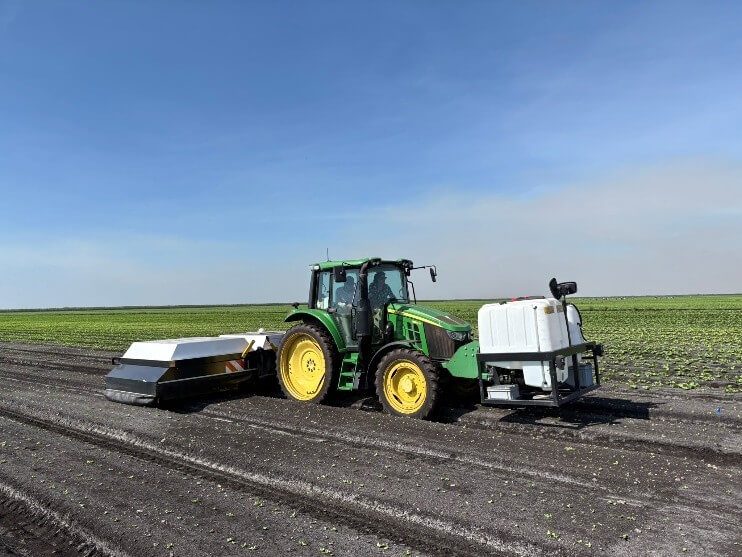
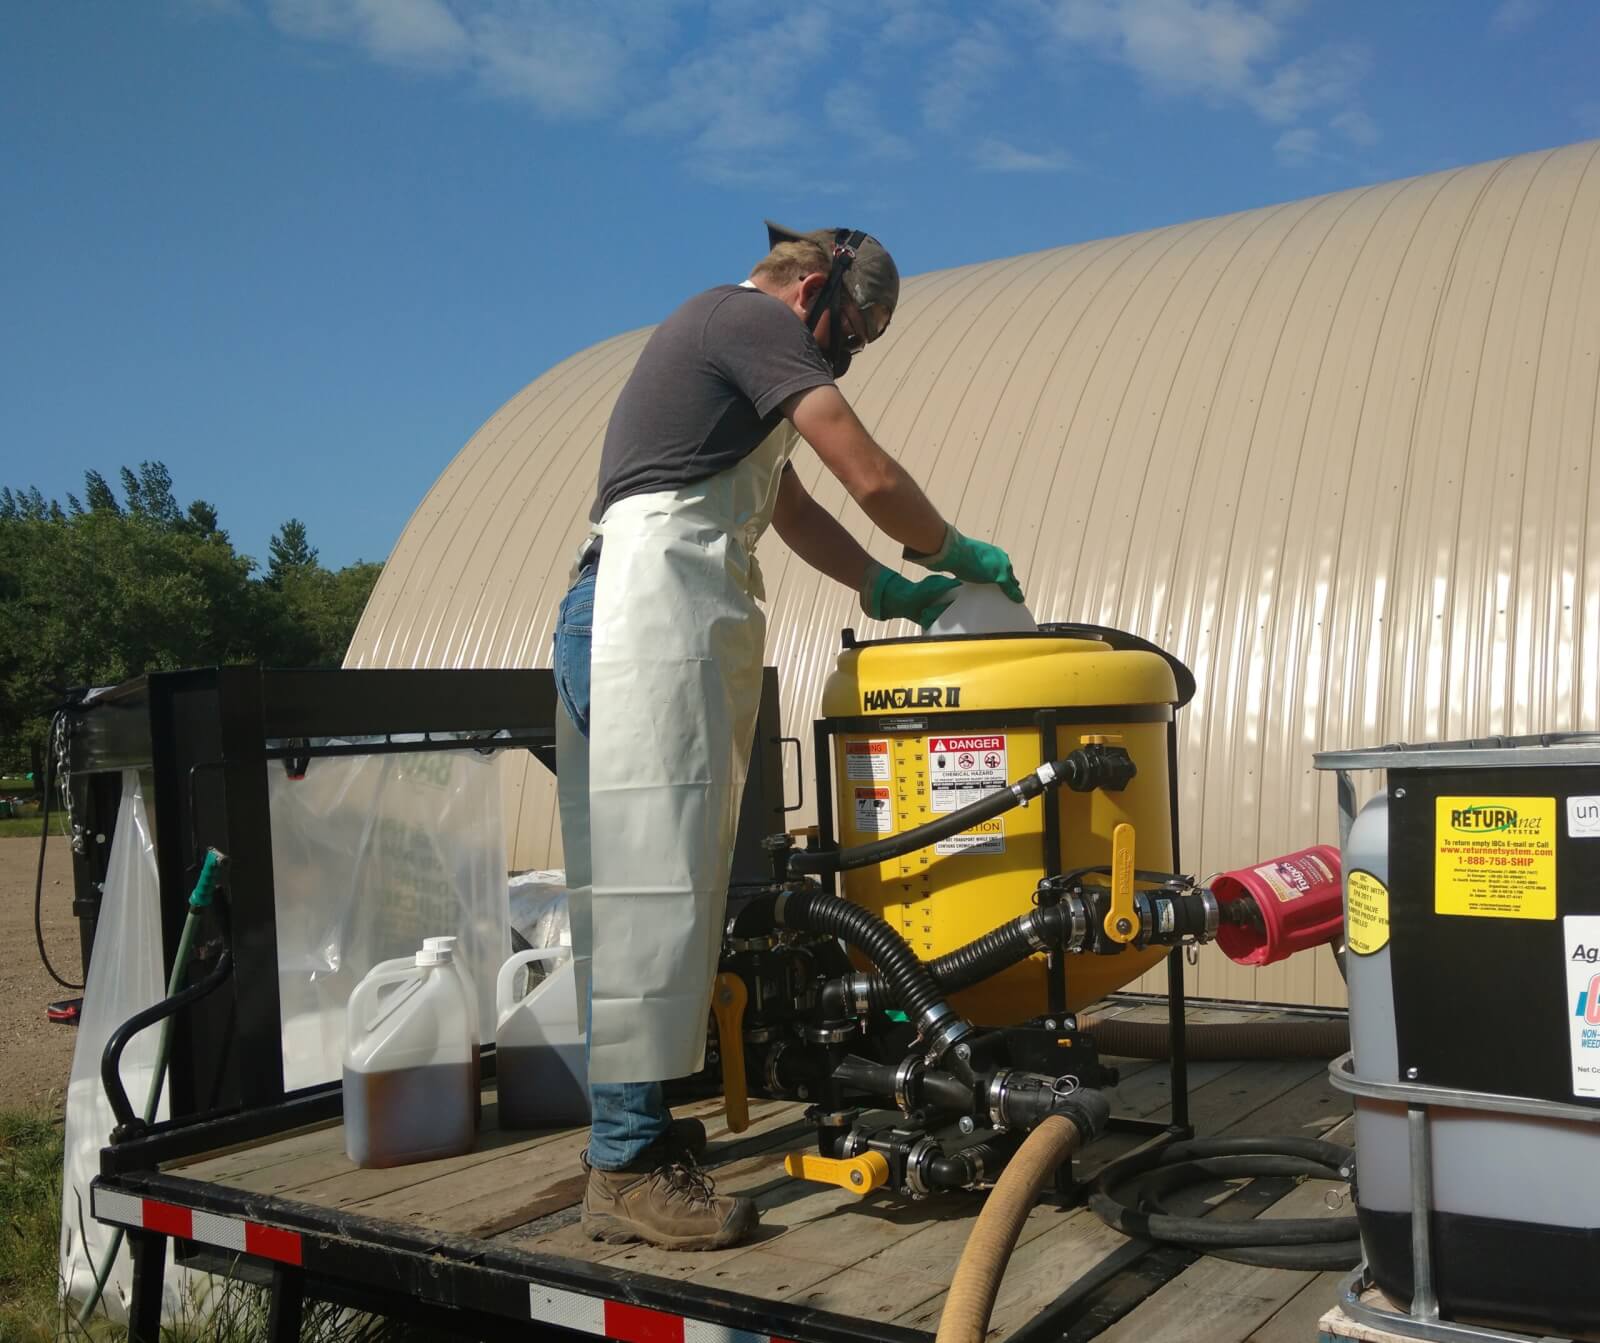
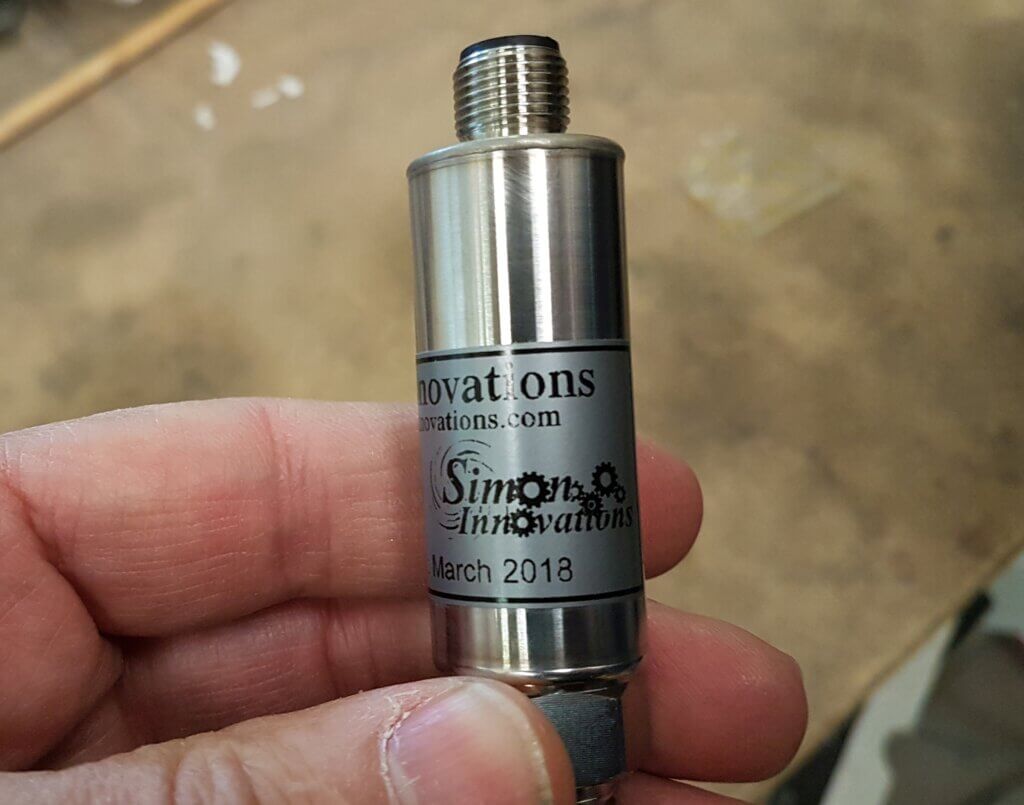
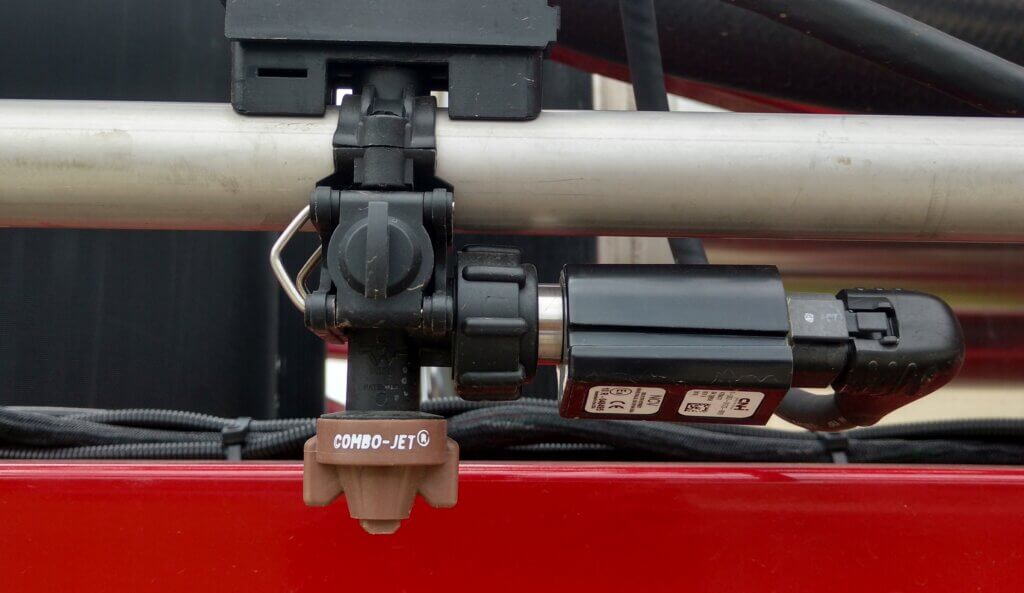
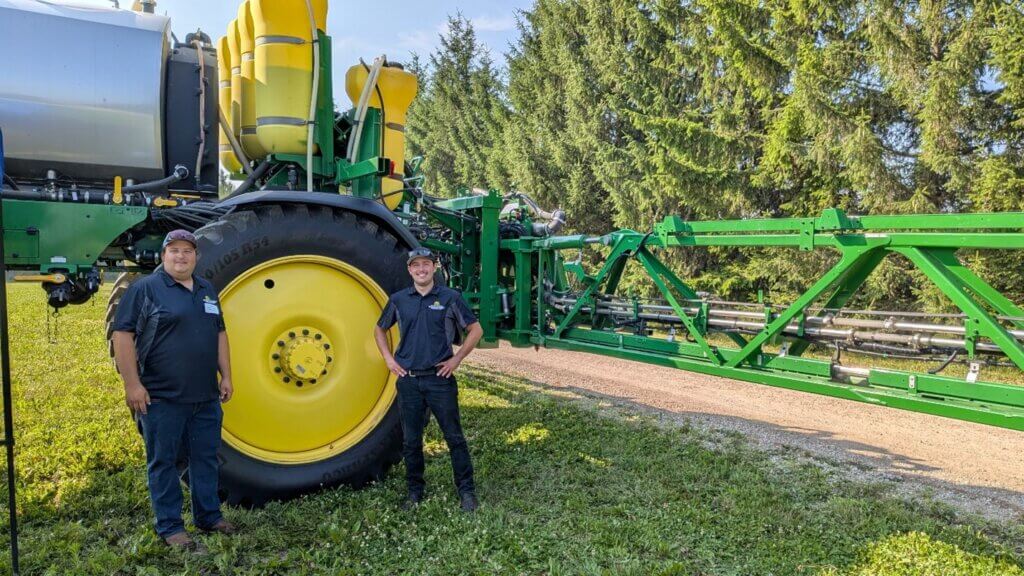
    In the summer of 2025, Todd Frey of Clean Field Services (Drayton, Ontario) and I participated in the Elora Weeds Tour. We discussed his new John Deere See & Spray Premium and the practical considerations for implementing green‑on‑green spraying in Ontario (Figure 1). With that first season squarely in the rearview mirror, I reached out to Todd to ask about his experience.

    To be clear, we had a lot of questions then and we still have questions now… but we’re optimistic. This article summarizes the original topics from the Weeds Tour, Todd’s 2025 learnings, and considerations for the year ahead.

    Figure 1 – JD See and Spray Premium at the 2025 Elora Weed Tour. Todd Frey (left) and Brendan Bishop

    Challenges Identified in 2025

    Label Language and MRL Constraints

    Optical spraying introduces uncertainties when interpreting pesticide labels written for broadcast applications. For example, an operator might elect to concentrate a herbicide beyond the common broadacre rate while technically adhering to the label. Depending on the active, this risks excessive residue levels that can cause crop replant issues. A few Canadian labels already address this grey area by specifying water-to-product ratios in addition to per‑hectare limits. Most do not.

    Australia’s experience offers a possible way forward: optical systems in Australia are commonly calibrated at 100 L/ha (~10 gal/ac), and labels specify whether they permit higher concentrations for spot and patch spraying. Additionally, most labels state the operator must revert to a conventional broadcast application when fields have more than 30% weed cover.

    Tendering and Mixing Logistics

    Estimating product and water needs is, perhaps, one of the most difficult operational challenges. Traditional field scouting cannot accurately predict how much spray solution an optical sprayer will apply. This leads to logistics issues, increased risk of unnecessary leftovers, and subsequent disposal/clean out problems.

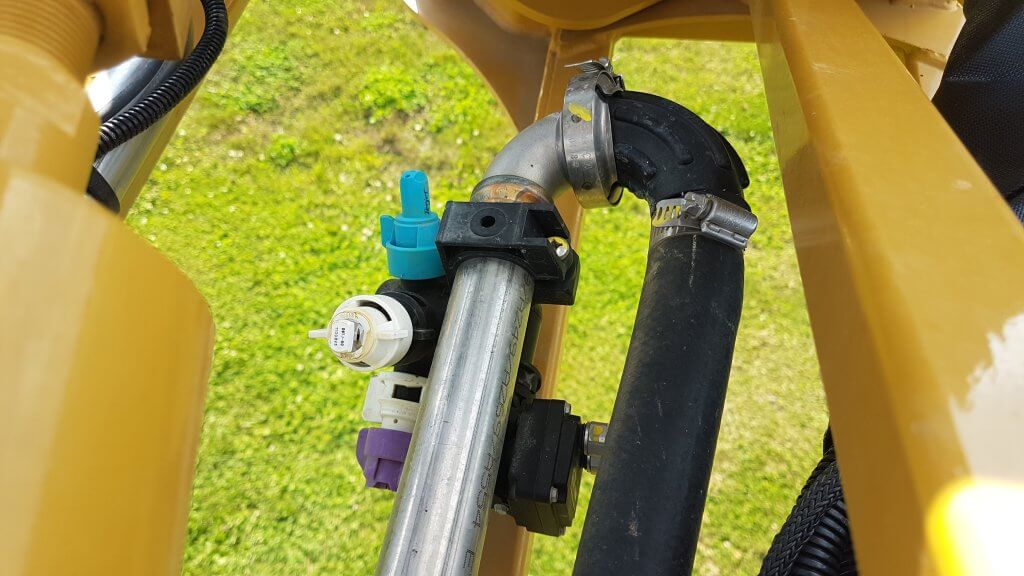
    Nozzle Availability and Performance

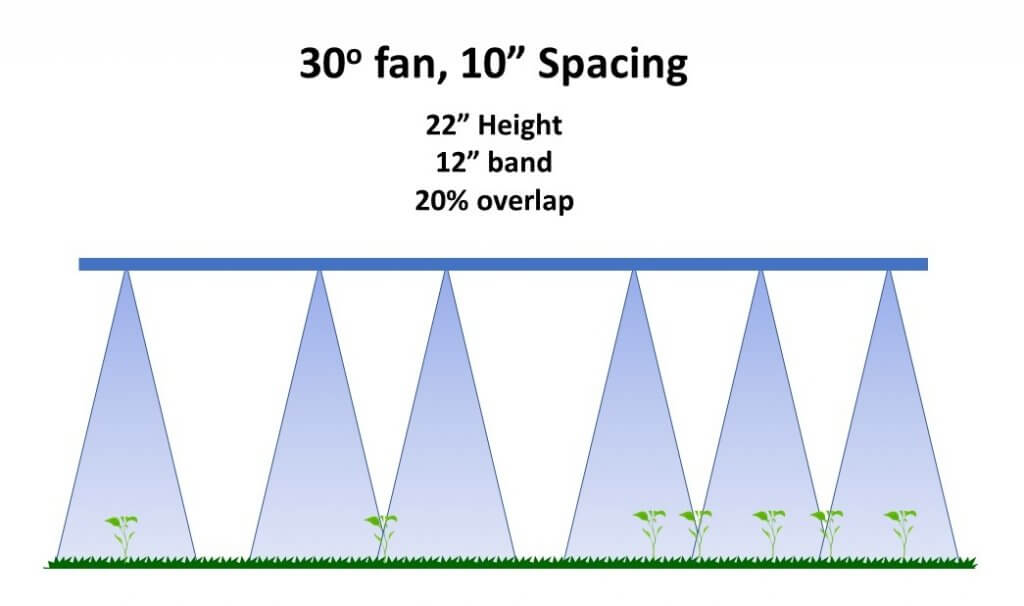
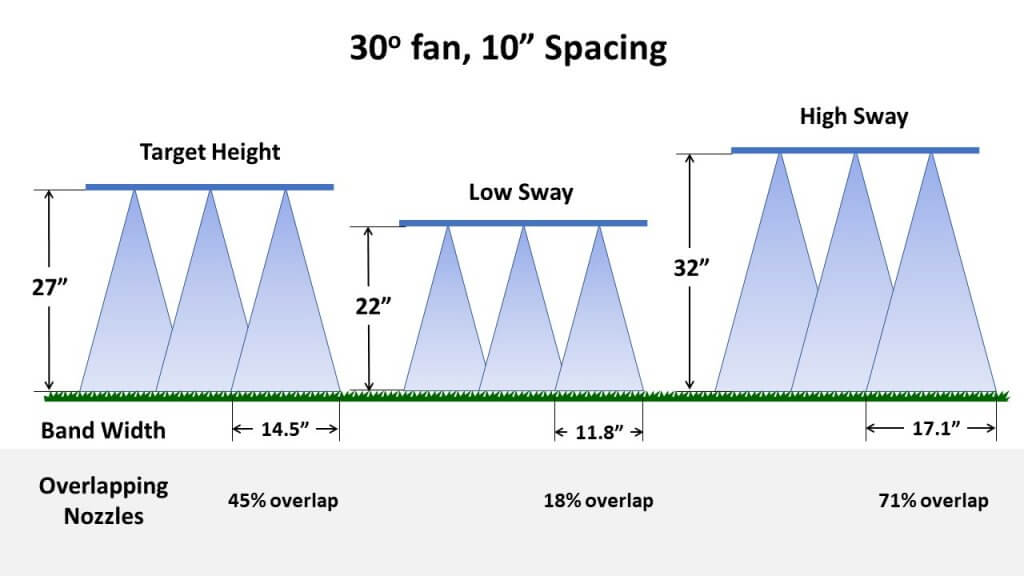
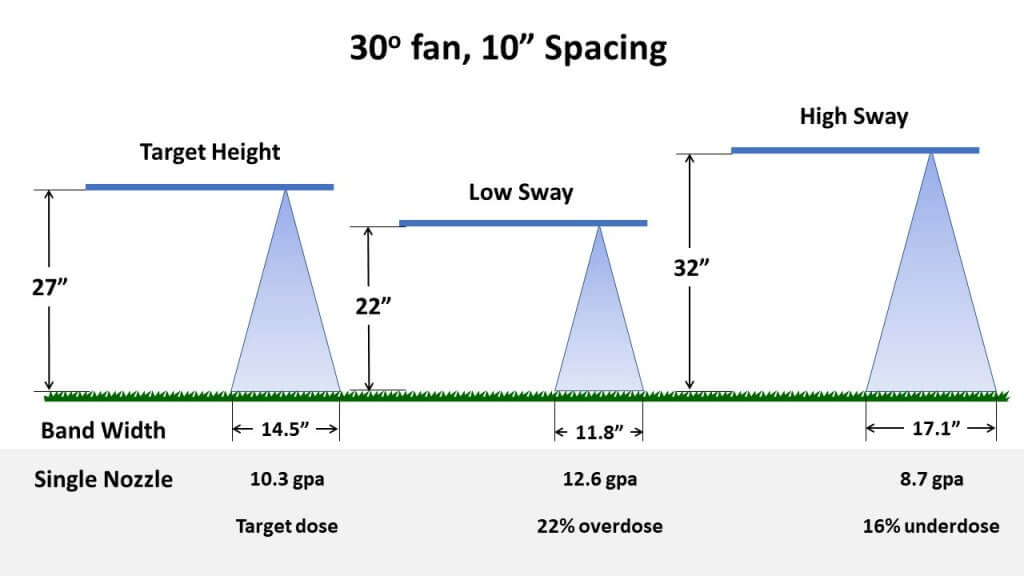
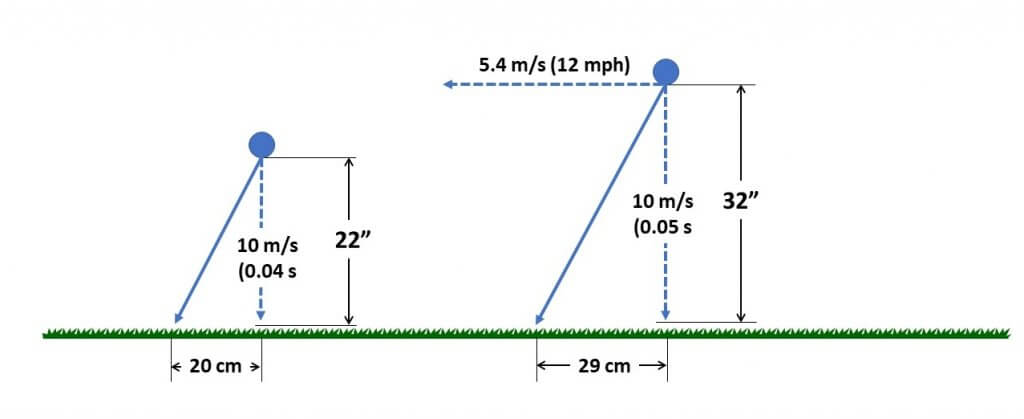
    Nozzle choice is central to realizing the full benefit of precision application. Ideally, operators require low‑drift, narrow‑angle nozzles with an appropriate dynamic range (i.e. travel speed vs. flow rate) to spray small weeds efficiently. Perhaps it goes without saying that a stable boom is critical in this equation, but we’ll say it anyway. Nozzle options are currently limited and we’ve written about this subject in a previous article.

    Cost–Benefit Realities

    While herbicide savings are an obvious appeal, the actual economics are more nuanced. The See & Spray Premium model adds a $6/acre CDN fee for unsprayed acres, which can diminish savings in very clean fields. A fall broadcast herbicide application improves the success of spring green‑on‑green passes, but this added cost must be figured in. Of course, there are many other benefits to a fall burndown that shouldn’t be dismissed, and you can read about them here.

    On the other hand, perhaps good agronomy should be the motivating factor. Any savings from reduced broadcast spraying may allow operators to upgrade to more effective, higher‑value tank mixes, improving weed control and contributing to long‑term seedbank reduction. Regarding the later point, there have been recent studies that suggest using low sensitivity may adversely affect the seedbank.

    New Chemistry Possibilities

    It’s a stretch, but there could be a silver lining to increasing herbicide costs and resistance pressures: chemistries once considered too expensive for broadcast use could become economically viable for spot or patch applications. This would expand chemical options.

    The 2025 Experience

    Cost savings

    To evaluate performance under Ontario conditions, Todd conducted a structured trial on his own 125‑acre corn field. In 2024 the field received a fall application targeting annual grasses and broadleaf weeds. Todd’s intention was to leave perennial sow-thistle and Canada thistle for targeted control in the spring.

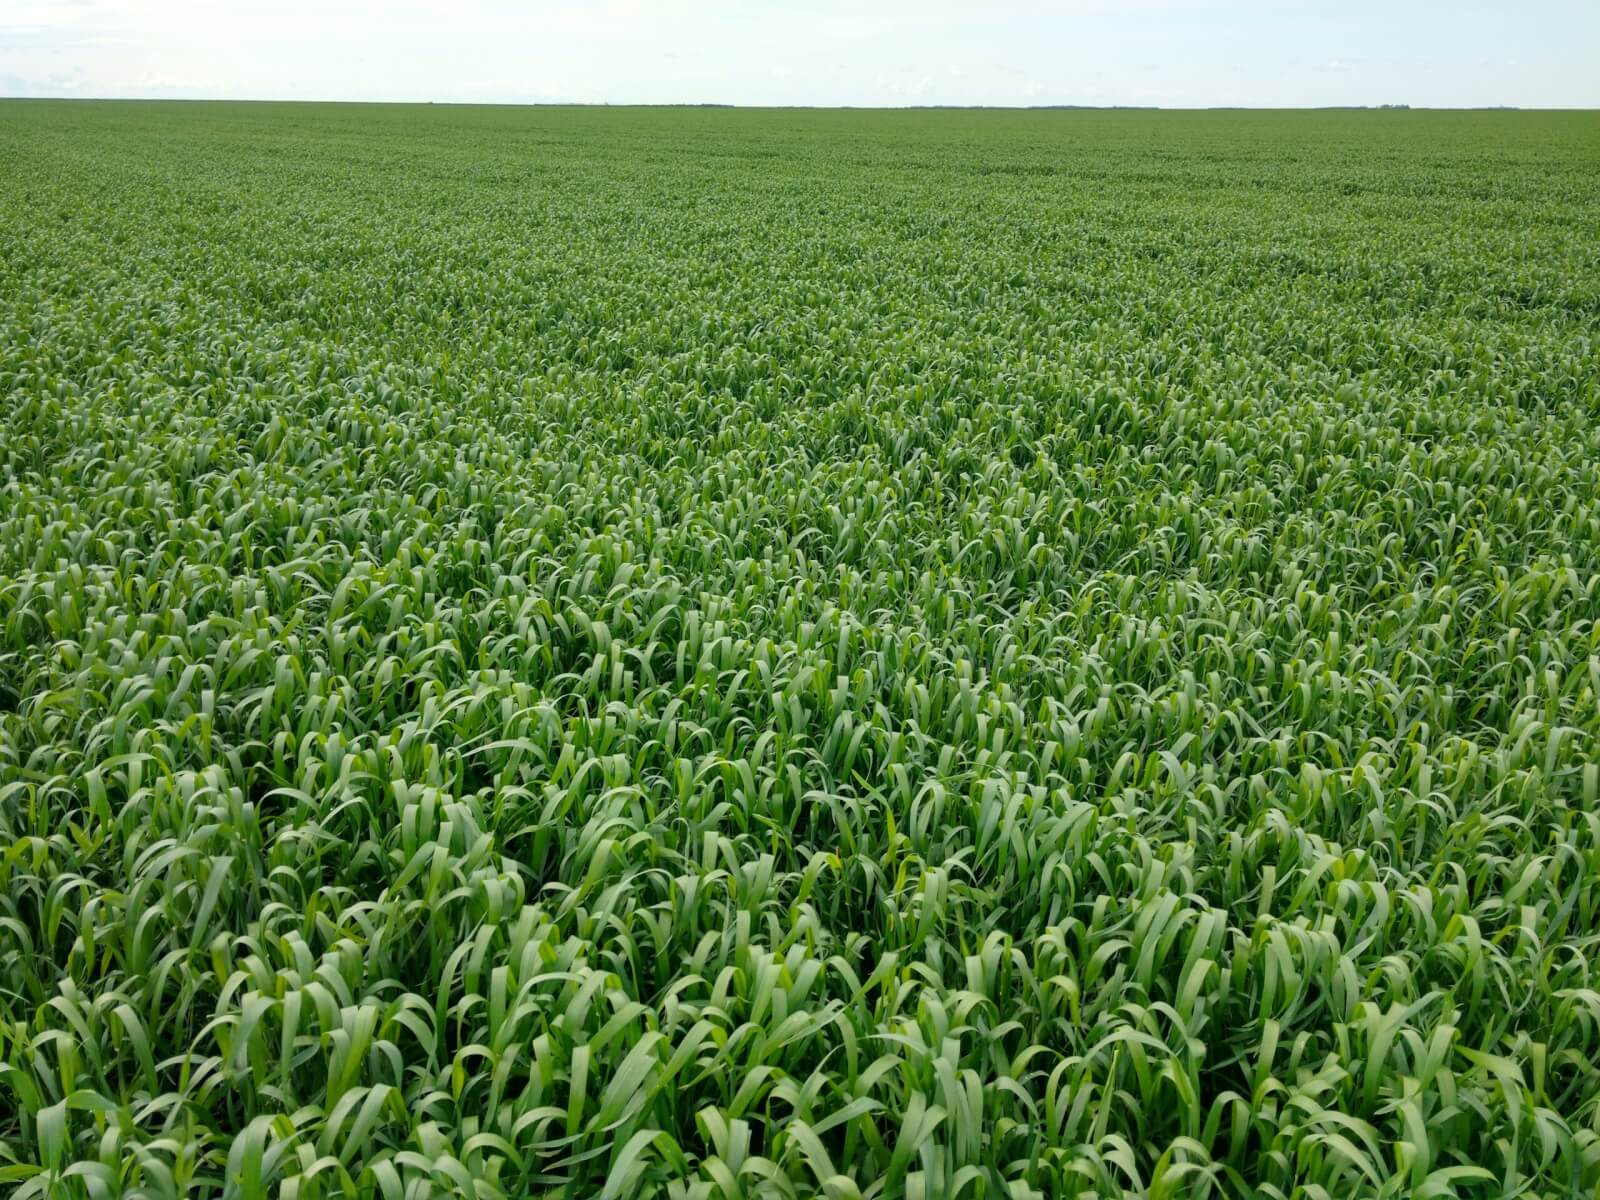
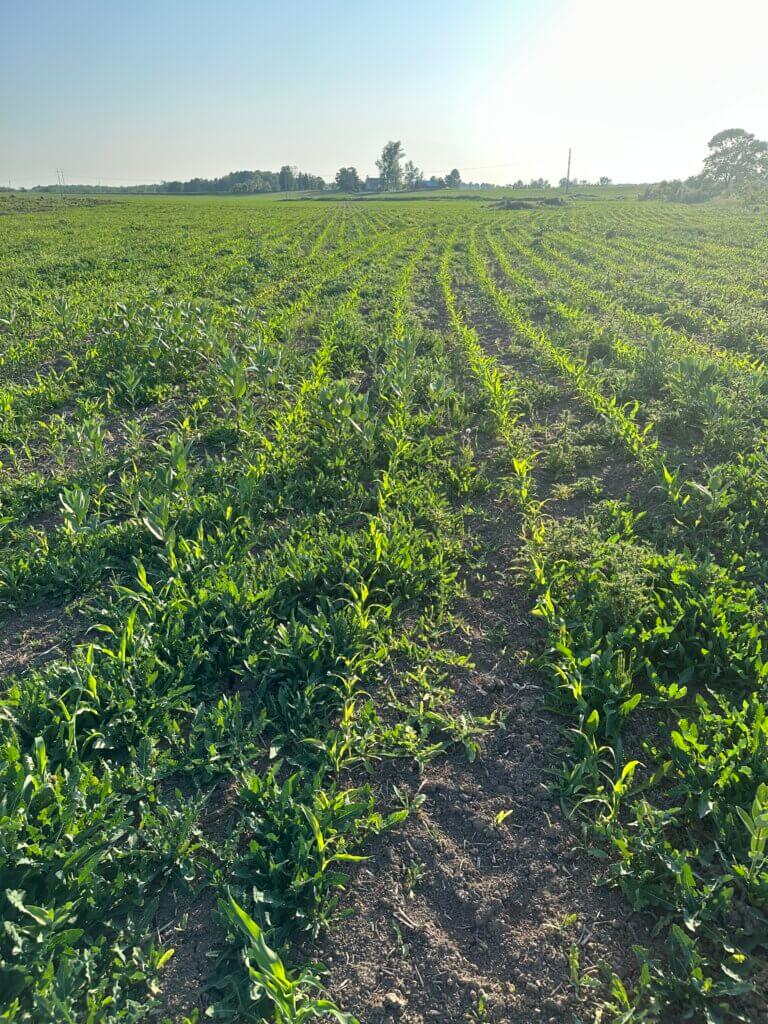
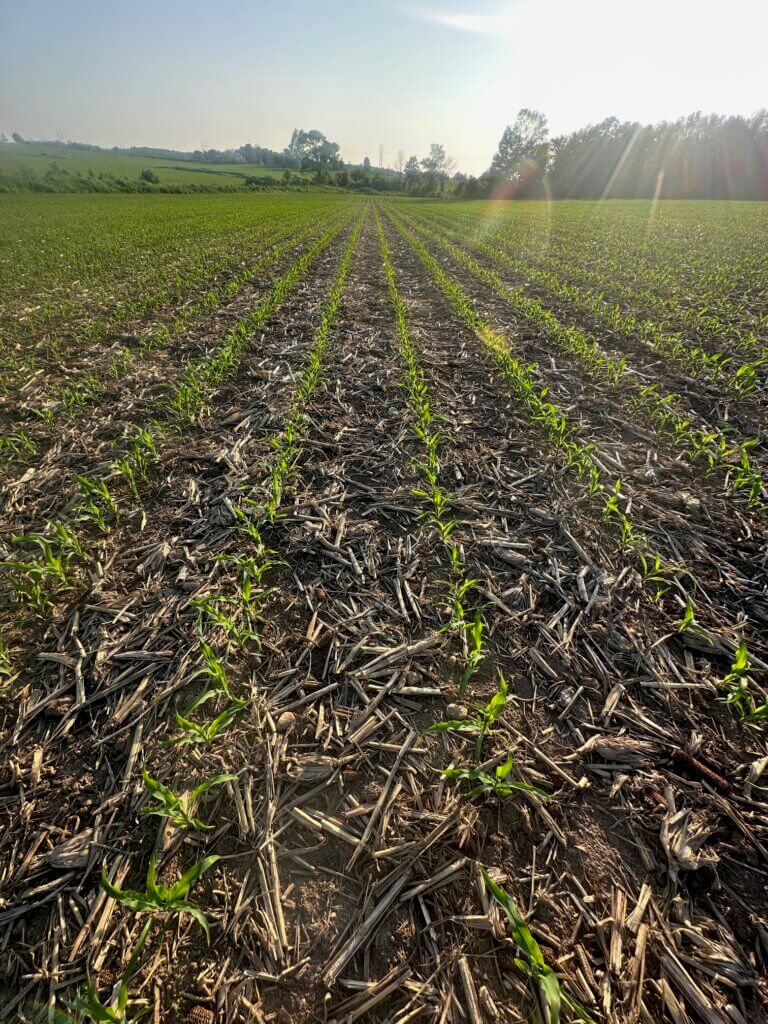
    He used the See & Spray Premium to apply Lontrel + glyphosate at 13 GPA. The John Deere Operations Center map (Figure 2) shows a distinct high‑pressure zone in red. This corresponds to 2–3 acres recently reclaimed for production —significantly weedier (Figure 3) than the remaining acreage (Figure 4). This work was performed using the Deere TSL8005 nozzle, with sensitivity set to 3 (medium) and buffers set to medium in both directions.

    Figure 2 – John Deere Operations Center weed pressure map
    Figure 3 – High weed pressure in the reclaimed section of the field
    Figure 4 – Low weed pressure in the majority of the field

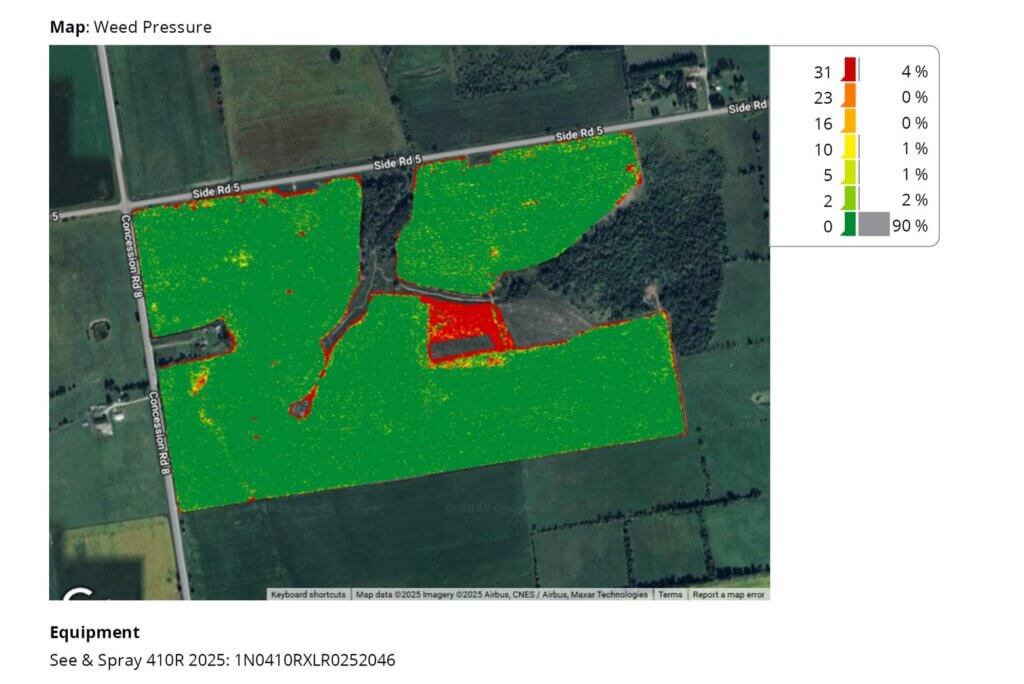
    Download a copy of the as‑applied data. You’ll see the See & Spray treated only 25.8% of the field. If Todd had broadcasted Lontrel at 65 mL/ac and charged his typical $14.50/ac it would have cost $4,139.36. However, even with his premium spot-spray rate of $17/ac and passing on the $6/ unsprayed acre, the total cost was $3,507.96. This represents a net savings of $631.40, and the surprise twist: he used the 100 mL rate of Lontrel and still saved money.

    So, in fields with moderate but uneven perennial pressure, See & Spray Premium can produce meaningful savings while enabling more robust chemistry.

    Scouting Limitations

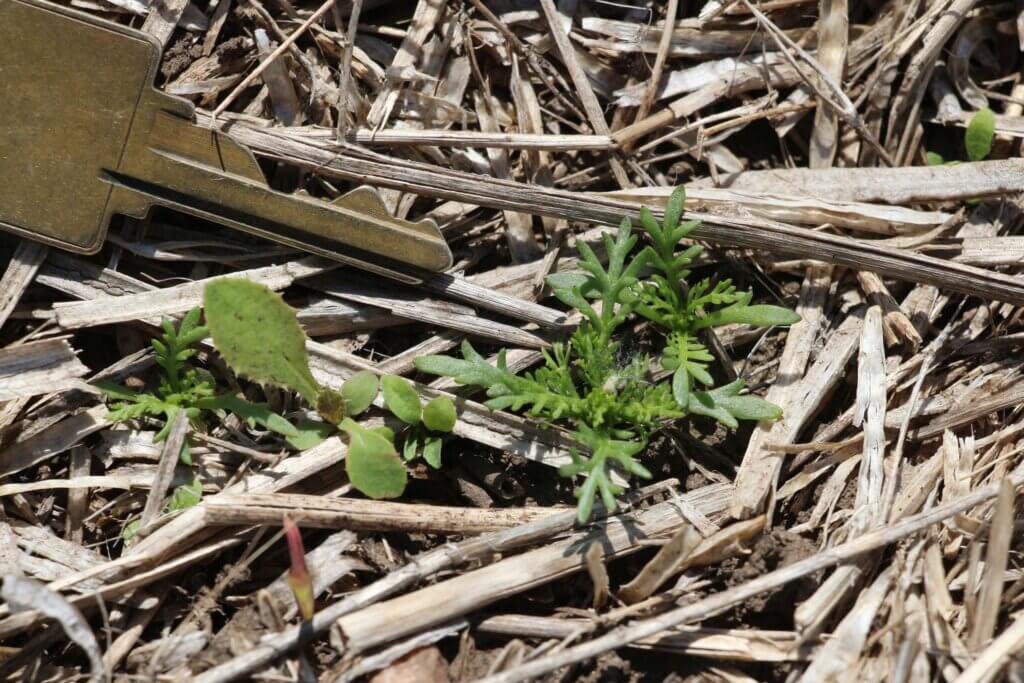
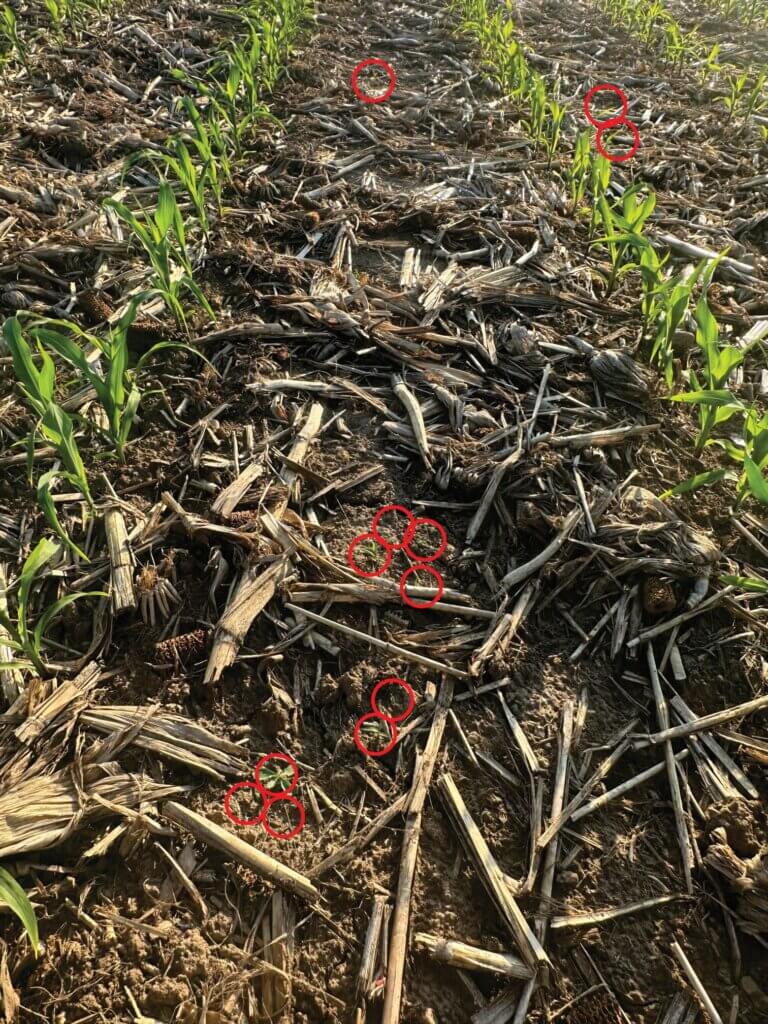
    As expected, visual scouting underestimated real weed density. Figure 4 might seem clean at first blush, but the cameras see a different story hidden in the stover (Figure 5). This is why predictive tank‑mix planning is unreliable.

    Figure 5 – Weeds may hide from a scout, but not from clever optics.

    Optimizing Tendering Through Job Planning

    Todd found that the best approach to minimizing leftovers was to group farms with similar pre‑emerge programs and weed spectra. He would then book them from the smallest to the largest fields, allowing leftover spray mix from smaller jobs to feed into larger ones. His goal was to finish with <5 acres worth and broadcast it at the end of the last job.

    This kind of planning starts with the fall burndown and should be firmly in place by March. It’s already challenging to accommodate last-minute requests during spring spraying, but this approach makes it particularly difficult.

    Customer Scheduling Challenges

    There was some frustration along the learning curve. A few customers experienced delays waiting on sprayer availability and then paid the premium on a field that ended up requiring a broadcast application. Experience will help refine expectations and scheduling.

    Looking Ahead: 2026 and Beyond

    In 2025, the See & Spray machines in Ontario sprayed mostly soybean, but in Todd’s region it was predominantly corn. One reason was that most of his soybean customers weren’t quite sold on the fall application. Todd has plans to get into soybeans in 2026, but his strategy involves IP beans.

    Traditionally, IP beans get a spring application timed to catch as many weeds as possible, perhaps too late for some and too early for others. Then Todd takes his phone off the hook as customers fret over burned beans while they inevitably grow out of the visual injury. But this time, Todd will make two targeted passes with a more expensive tank mix to do a better job of controlling weeds at the right stage, while avoiding burning the IP beans. If his projections are correct, he believes he can accomplish this more economically than a single broadcast pass.

    We’ll update this article with the outcome. Be sure to check back and see if he succeeds 🙂

    Conclusion

    Ontario’s early experience with green‑on‑green optical spraying suggests that while the technology is promising, it requires substantial logistical planning, label awareness, and nozzle optimization. Under the right conditions—particularly where weed pressure is irregular but significant—operators can achieve both economic savings and precise weed control.

    As adoption increases and equipment evolves, we’ll learn more about where spot and patch spraying technology fits in changing weed management programs.

    Thanks to Todd for sharing his experience and insights.

  • Evaluating the return on investment of optical sprayers for horticulture

    Evaluating the return on investment of optical sprayers for horticulture

    Investing in an optical sprayer for horticulture is not a straightforward financial decision. Compared with a conventional boom sprayer, the upfront capital cost is substantially higher, often by an order of magnitude, and most commercial systems require an annual software or service subscription to operate. Despite these barriers, adoption is accelerating, and many growers who have made the investment report very positive outcomes.

    To help clarify when and where this technology makes financial sense, I developed a calculator to estimate the return on investment (ROI) of optical sprayers under a range of production scenarios. The goal of this tool is not to promote the technology, but to provide growers and advisors with a structured way to evaluate whether it fits their specific operation.

    Note: This calculator was designed for onion and carrot production in Ontario, Canada. Model parameters can easily be adjusted reflect other production systems. However, if you need assistance making these changes you can contact me by email.

    New versions may be uploaded as the calculator evolves through experience and based on user feedback, so check back. You can download Version 1.1 (April, 2026), HERE.

    How to use the calculator

    At first glance, the calculator may appear overwhelming because it requires a fair amount of information to be entered. This is the minimum data required to reflect real-world conditions while avoiding an oversimplification that could lead to misleading conclusions. Cells shaded in yellow are meant for user input. All other values are calculated automatically based on those inputs.

    For convenience, the calculator is pre-filled with generic values derived from grower discussions and informal benchmarks. These default numbers are meant only as placeholders and to provide general reference. They are not sufficiently accurate on their own to support financial decisions.

    Users should replace all default values with operation-specific data whenever possible. As with any economic model, the quality of the output depends entirely on the quality of the inputs.

    The calculator is organized into three spreadsheets (see tabs at bottom).

    1. Introduction

    This tab provides general instructions and contact information. No data entry is required.

    2. Sections Explained

    This is a reference tab that explains each section of the calculator in detail. It is intended to help users understand how different inputs affect the results and the intention of each section (small table) withing the sheet. No values should be entered here.

    3. Calculation Sheet

    This is the main working tab. All data entry occurs here. To prevent accidental changes that could break formulas, the sheet is protected. For most input fields, a brief explanation is provided immediately to the right of the cell. In the results section, short interpretations are often included, such as: “Decrease of 36% ($101,250/year) in hand-weeding cost with optical sprayer.” Within this tab, scenario tables are also provided. These tables are designed to illustrate how different acreages of the two crops analyzed affect each of the calculated financial indicators.

    Insights from scenario testing

    Even using rough approximations, several consistent patterns emerge from adjusting the calculator inputs:

    Herbicide savings alone rarely justify the investment

    In high-value horticultural crops, herbicide costs are often a relatively small portion of total production costs compared with labor, equipment, and the overall value of the crop. In many cases, any reduction in herbicide expenditure is largely offset by increased tractor hours resulting from slower operating speeds and narrower effective spray widths typical of optical sprayers.

    Labor savings can be decisive

    When the technology results in meaningful reductions in hand-weeding, the financial impact can be substantial. This is especially true in crops such as onions, where hand-weeding is both costly and difficult to source reliably. In these situations, labour savings alone can drive a favorable ROI.

    Yield protection may outweigh cost savings

    Several growers report stand losses and weakening associated with herbicide phytotoxicity as a major production risk. By limiting spray exposure to crop plants, optical sprayers can significantly reduce or even eliminate this issue. In high-value systems, relatively small yield gains resulting from improved crop safety can translate into revenue increases large enough to justify the technology, even if other savings are modest.

    Scale matters

    When evaluating advanced sprayer technologies, scale becomes a decisive factor. The high capital investment and ongoing service fees may be difficult to justify for small, and in some cases, even medium-sized operations.

    What about herbicide resistance?

    The long-term implications of optical sprayers for herbicide resistance management are still uncertain. Recent research from the University of Arkansas has raised concerns in field crop systems, suggesting that poorly optimized optical spraying can result in short term gains, but these can be outweighed over time by higher weed escape rates compared with broadcast applications. If these escapes are allowed to grow and set seed, rapid seedbank replenishment and accelerated resistance development may occur.

    This highlights an important limitation of short-term ROI calculations. A single-year economic benefit may look attractive, but if the system allows even a small number of weeds to consistently escape and reproduce, the long-term consequences can be severe.

    On the other hand, optical sprayers may eventually enable new resistance-management strategies. It is possible that new active ingredients, higher labelled rates, or novel use patterns could be registered specifically for targeted spraying in horticultural crops that would not be feasible with broadcast applications. Such developments could significantly improve resistance management tools. As always, it is essential to remember that the label is the law: only registered products and rates may be used, regardless of perceived crop safety.

    ROI implications beyond herbicide spraying

    Optical sprayers can deliver value beyond herbicide applications, even though weed control is their primary use. These additional uses may improve overall ROI. However, because their economic impact is still difficult to quantify, they have not been included in the calculator.

    Depending on the model, additional value-generating capabilities can include:

    • Creation of weed maps: Some systems can generate weed maps automatically while spraying, at no additional operational cost. These maps can support future management decisions.
    • Application of fertilizers and other pesticides: Although optimized for herbicides, optical sprayers may also be used to apply other inputs, such as fertilizers or non-herbicide pesticides.
    • Crop thinning: Certain manufacturers have developed algorithms for automated crop thinning, particularly in crops like lettuce.

    Conclusion

    Even using approximate inputs, it is clear why optical sprayer adoption is expanding rapidly in Canada.

    • For medium to large-scale operations, the ROI can be highly attractive, and the range of potential benefits continues to grow.
    • As the technology matures, more equipment options are emerging to serve a wider diversity of crops and farm sizes.
    • Manufacturers are introducing wider and more flexible platforms, and Ontario-based companies are actively developing alternative machines and service-based business models that may better suit smaller operations.

    It is difficult to argue that optical spraying is a passing trend. While it’s not a universal solution and must be implemented carefully, the technology is clearly here to stay. It will reshape weed management and production economics over the long term.

  • Dealing with Pesticide Shortages in 2022

    Dealing with Pesticide Shortages in 2022

    We’ve had dire warnings about possible pesticide shortages and price hikes for 2022. Price hikes are one thing. But if the products we need simply won’t be available, we have a tougher challenge.  It’s time to plan pesticide conservation.

    But first, what’s behind the product shortage?

    Emily Unglesby of dtnpf.com provided an excellent overview of the issue here and here. She said the reasons for the shortage are many-fold and came together in a perfect storm. Starting about 2017 or so, pesticide manufacturers tried to reduce the overall inventory of products to improve logistical efficiencies.  That effort was rewarded in 2019 when a wet spring in the US dramatically reduced seeded area to a low of 165 M acres. The resulting lower demand again provided incentives to reduce inventories. At the same time, US trade sanctions against China in the form of tariffs impacted production and shipment of many active ingredients to US markets. When Covid-19 happened, it affected both production and shipping of many goods, including pesticides. Container shipment costs increased sharply, and the ability to move them to and from ports was hampered. This then coincided with record seeded area in the US of 180 M acres in 2021, creating higher than usual demand. By that time, very little buffer remained in the system. The growth of Enlist E3 and Xtend Flex has placed additional pressure on glufosinate.

    Then two further events occurred. Hurricane Ida forced a shutdown of Bayer’s Louisiana glyphosate plant. And China, in late 2021, legislated a temporary 90% reduction of yellow phosphorus production in Yunnan Province in anticipation of the 2022 Olympic Winter Games. With phosphorus as a fundamental ingredient in glyphosate, glufosinate, and some fertilizers, this loss of production places significant strain on many products. The usual habit of returning unused pesticides to the retailer also became less common amidst shortage news, adding difficulty to planning inventories and demand.

    Shortages of popular herbicides like glyphosate, glufosinate, and clethodim will put demand on alternatives. Spreading out risk by implementing pre-emergent products where possible will pay dividends. But the ability to ramp up production of minor products is just as dependent on the supply chain, and these alternatives may therefore not offer reprieve if ordering is left to the bitter end. Planning ahead and staying in touch with retailers about your plans and your own inventory will assist the entire system in managing production and redistributing existing stocks.

    Safe to say products will be more expensive, and possibly impossible to obtain. Here are some things to consider to minimize the impact.

    1.Grow crops that require less pesticides. Crops which have good genetic resistance to insects and disease will be more likely to cope without a protective spray. Some crops are inherently competitive early on and give less time and space for weeds to become established. Remember that the relative time of emergence is important for crop yield loss from weeds. If crops emerge before weeds, they have the upper hand and will maintain higher yield potential. Crops that can be seeded early will prevent weeds from occupying that niche.

    A competitive crop is the best herbicide.

    2. The most powerful herbicide is a competitive crop. Use agronomic tools that favour good seedling establishment. The usual advice of seeding into a warm, firm, moist seedbed, should we be fortunate enough for the weather to cooperate, applies here. There is value in higher seeding rates to help outcompete weeds. Use fertilizer placement that favours crops, not weeds, such as side banding.

    3. Sample the spray water source and have it professionally tested. After a record drought in western North America, aquifers are low and surface waters have receded. Water quality will probably not be the same it has historically been. Use water conditioners to reduce effect of hard cations and bicarbonates. Ammonium Sulphate (21-0-0-24) at 1% w/v is a general treatment, harder water may require up to 3%.

    Conduct a water test in 2022 and condition spray water if necessary.

    4. Do not use untested mixes of pesticides with specialty foliar fertilizers. These may impact herbicide performance, or worse, result in an incompatible mix.

    5. Use the lowest label rate of product that is relevant for the pest you’re trying to control. Many products have a range of rates depending on the weed species and stage. Scout your fields and take advantage of the lower rate option if you can.

    Invest in logistics and be prepared to respond to a good spray day to get the timing right.

    6. Spray herbicides early. It’s been shown that crop plants can sense the presence of weeds before they compete for resources, causing a physiological adjustment that results in irreversible yield loss. The shorter the time that weeds and crops co-exist, the better. Also, smaller weeds are easier to control. Weeds that escape this early application will need to compete with an established crop and won’t thrive or impact yield as much.

    Smaller weeds are easier to control and may allow a lower label rate.

    7. It’s not advisable to reduce product rates from the one recommended on the label. Although label rates contain a margin for poor conditions, the risk of selecting for polygenic resistance exists. Polygenic resistance occurs when some weeds happen to be slightly more tolerant to the herbicide than the rest of their cohort. These weeds may survive a lower rate, and go on to produce seeds. If these outcross with other survivors, their more tolerant offspring will increase in relative abundance. With further such selections in subsequent generations, weeds become even more tolerant and eventually dominate.

    8. Apply the spray as uniformly as possible. Make sure the spray nozzles are within a 5% flow rate tolerance along the entire boom. If the set is older, consider a wholesale replacement. But the biggest enemy of uniform deposition seems to be turbulence created by wind and driving speed around the tractor unit. Slower wind and travel speeds help somewhat. Variable deposition means that some regions receive up to 50% more than intended, and others receive 50% less. This means weeds in the lower deposit regions may survive the application. The more variable the application, the higher the rate that is needed for acceptable control.

    Slower travel speed reduces variability of the spray deposit, limiting escapes.

    9. Use finer sprays whenever the tank mix contains a contact mode of action product (e.g., Group 1, 6, 10, 14, 15, 22, 27) or targets grassy weeds. Both situations require smaller droplets for best performance. The use of finer sprays may mean fewer hours in the day when drift is acceptable, and as a result, investment in efficient tendering and cleaning as well as overall time management pays dividends.

    10. Make efficient use of the product in the tank, preventing waste. The amount of product being discarded can range to over 10% of the total needed to treat a field, but this can be reduced to 3% with the proper steps. The following are areas where improvement is possible:

    (a) Prime the boom efficiently using sectional shutoffs or better yet, a recirculating boom. These can be primed without any spray leaving the nozzle or boom ends.

    Conserve product by eliminating priming waste with a recirculating boom.

    (b) Measure the spray mix of the last tank accurately, minimizing leftover. Consider the AccuVolume system that weighs the tank contents to the closest gallon. Tanks can be filled with the exact amount, and rates can be adjusted as the leftover becomes apparent on the last passes.

    Accurate measurement of tank volumes prevents leftovers.

    (c) Invest in individual nozzle shutoffs to improve sectional control resolution. These are part of any Pulse Width Modulation system but can also be obtained as air-actuated valves that are very affordable. Such capability is necessary for recirculating booms.

    Nozzle sectional control can save 4 to 5% product use.

    14. Consider an optical spot spray system such as the WEEDit Quadro, the Trimble WeedSeeker, or the John Deere See & Spray Select, available for 2022. These systems are “Green on Brown”, meaning they selectively spray just weeds in a burnoff or chem-fallow. This can save about 70% of the spray depending on weed density. More such systems are on the way, some even offering “Green on Green” that selectively identifies weeds among a crop. The return on investment of these systems is directly related to the pesticide cost, meaning in a year with high pesticide prices they pay off faster. If shortages of product become a reality, a spot sprayer may be the only way that some fields get treated at all.

    Pesticide shortages will not be fun. Unfortunately, their appearance coincides with higher fertilizer prices, meaning crop establishment will need to overcome that factor as well. But there are tools to minimize the impact if we’re willing to implement them. Just as necessity is the mother of invention, scarcity is the father of conservation.

  • Spray Patterns for Spot Sprays

    Spray Patterns for Spot Sprays

    Spot spraying promises to dramatically cut herbicide use. Data from Green-on-Brown (GoB) sprays suggest at least 50% and possibly 90% savings are possible, depending on weed density and the system employed. These savings are significant. But system performance depends on the nozzle selection even more than for broadcast sprays. What are the issues?

    Pattern Width

    Spot sprays represent a unique mix of single nozzle banding and multiple nozzle broadcasting on the same boom at different times and locations, depending on what the weedy spots require. Both need to be optimized to get the best performance and savings out of such a system.

    Even (Banding) Nozzles

    Let’s say the spot spray boom has a spacing of 10” (25 cm) and is carried by wheels to ensure consistent height. An operator would want the spray pattern to have a very similar width as the nozzle spacing. A 30 degree even fan angle would create a band of about 10” wide at a boom height of 19” (48 cm, download a worksheet that solves this for any fan angle and boom height here). Assuming a travel speed of 12 mph (20 km/h) and a pressure of 40 psi (2.75 bar), an 03 sized nozzle would apply 14.9 US gpa (139 L/ha) in these 10” wide bands.

    But most applicators would be uncomfortable with zero overlap, and would prefer to raise the boom to allow, say, 20% overlap. This would ensure targetting of taller weeds that appear exactly between two sprays, for example. At 22” (56 cm) boom height, the pattern would be about 12” (30 cm) wide and affording 1” overlap on either edge.

    Spot spray booms activate any number of nozzles depending on the weed locations.

    Because the application is diluted by the extra pattern width, the applied volume is now 12.4 US gpa (116 L/ha), about 20% less than before. This change is easily accommodated by mixing the product more concentrated in the tank. The downside is that the overlap in banded sprays receives twice the dose, and this is less than ideal.

    Tapered (Overlapping) Nozzles

    A possible solution is to employ tapered flat fans that are the standard type on broadcast booms. These produce more of their volume in the centre, diminishing at the edges, to allow for overlapped patterns and thus functioning better when more than one nozzle is activated. In addition, the extra coverage from a wider pattern is not as wasteful as it is from an even pattern type since it comprises less volume. A single nozzle spray, however, would have a higher dose in the centre than at the edges, since a single pattern has a bell-shaped volume distribution. (note: a single nozzle moving through air loses some of its volume from the centre and places it at the edges, due to aerodynamics of the fan shape. That levels out the bell shape somewhat.)

    Broadcasting

    When more than one nozzle is triggered by the sensor, the spot spray of that region is just a small section of a broadcast boom. The average dose is now related to the nozzle spacing, not the actual band width as it was for a single nozzle. The wider the section of nozzles that are activated simultaneously, the less inefficiency a wider individual pattern creates because it’s only wasted on the outside edges of the outside nozzles.

    Clearly, a sprayer that sometimes functions as a single nozzle spot spray, and at other times as a broadcast boom requires some compromises. Monitoring the activation of nozzles and learning from the relative frequency of single vs multiple nozzle activations will be useful to optimize the configuration. But when boom height is constant, a good compromise solution is possible.

    Suspended Booms

    A more challenging situation arises from suspended booms that do not hold a consistent height. Let’s assume a boom height variance of 10” (5” in either direction), and a wish to retain 20% overlap at the lowest height to avoid misses from a 30 degree nozzle.  The lowest height would have about a 12” pattern width, achieved at 22”. The boom would be set 5” higher, 27” (69 cm). At this height, a 30 degree fan would produce a band width of 14.5” (37 cm), producing a 45% overlap. If the boom sways up to 32” (81 cm), the pattern width would be 17.1” (43 cm).

    For multiple adjacent nozzles, boom height determines overlap, and a minimum overlap must be achieved even when the boom sways low.
    For single nozzles, boom height determines band width and therefore dose.

    This is where it gets tricky. At suboptimal heights, the difference between a single band and a section of overlapping patterns increases. Do we calculate the tank mix for the rate a single nozzle delivers within its band, or for a set of nozzles activated simultaneously? If we knew that the majority of activations are for a set of two or more nozzles, we could opt to assume an application rate of a boom section with 10” spacing. An 03 nozzle at 40 psi and 10” spacing would apply 14.9 gpa (139 L/ha). But when a single nozzle is activated, the application volume in the 14.5” band is just 10.2 US gpa (95 L/ha), and the plants that triggered just a single nozzle would be under-dosed.

    At the top of the sway (32”), a single nozzle’s wider pattern would deliver about 8.7 gpa (81 L/ha) , another 16% less spray volume than at 27”. At the low end of its sway, the band is 12” wide, applying about 12.4 gpa (116 L/ha) , 23% higher than the 10.2 gpa rate at the 27” boom height.

    It’s clear that to take advantage of the potential savings of spot spraying, and to ensure good success with single nozzle activation, consistent and accurate boom heights are essential.  I’m not sure how much more obvious a development priority can be.

    Band Length

    Spot sprays allow the user to select the length of band that the spray is activated for. Shorter band lengths require more targetting certainty. If booms and travel speeds are both low, an individual detected weed can be targetted accurately with relatively short band lengths because relatively little can happen to displace the spray during its short journey. But as booms and travel speeds are higher, the time that the spray arrives at the target is more difficult to predict and longer band lengths need to be programmed. For example, wind can push the spray off its target. Or the faster speeds impart more of a horizontal vector to the spray, causing it to land further away from the point of release.

    The variances in where the spray lands along the direction of travel depend on droplet speed and boom height. A conventional flat fan nozzle produces an initial droplet velocity of about 20 m/s. These droplets slow at a rate dependent on their size and whether they’re entrained in the spray plume. At 45 cm below the nozzle, larger droplets are still moving at 10 m/s. Smaller droplets are only moving at 1 to 2 m/s.

    Droplets take time to reach their target, and the spray band length must accommodate variance in this time arising from different from boom heights or droplet speeds.

    Let’s assume an average droplet speed of 10 m/s for the journey. At that speed, the spray takes about 0.05 s to travel the 0.7 m (27”) from nozzle to target. During that time, the sprayer going 12 mph (5.6 m/s) moves about 0.25 m forward, as do the larger droplets from the released spray. If the boom sways down to 22” or up to 32”, the distance travelled by the sprayer is 0.2 and 0.3 m, respectively. In other words, the band length would need a buffer of 10 cm to accommodate the variability of the beginning and end of the band.

    Overall Efficiency

    Are these numbers such a big deal?  You might say that we’re already cashing in on some big savings here, so why sweat the details?

    It’s the principle and the resources. If we’re talking about individual nozzle band width and its change with boom height, accommodating boom sway means applying more than necessary on average to avoid under-dosing when booms sway high. The examples used here show a potential dose variance of 40% with a boom sway of 10”, a modest assumption. That’s a big number to leave on the table. If we had a constant boom height, we could decide what overlap we wanted and minimize these losses.

    One of the features on most spot sprayers is to turn on all nozzles of a section that exceed a certain boom height. While this prevents under-dosing and ensures an area is treated even when the sensor is outside of its optimal range, it is possibly an unnecessary use of product.

    If we’re talking band length, adding 10 cm to a band length of 50 cm is 20% over-application. That can also add up.

    The key to being efficient with spot sprays is accurate and consistent boom height. We know we can do that with a wheeled boom. But show me a suspended boom that can deliver on this, and I see an instant industry leader in spot spray application.

  • The Ideal Sprayer (an open letter to sprayer manufacturers)

    The Ideal Sprayer (an open letter to sprayer manufacturers)

    Today’s sprayer has to excel at a lot of things. It has to have capacity and low weight. It has to go fast but be comfortable. It needs wide booms that stay level over complex terrain. It has to deliver the right spray volume at the right spray quality for the job. It has to be easy to fill and easy to clean. And of course, it has to be reliable, affordable, and come with dealer support.

    We’ve definitely made progress in many of these areas. But the overall package still leaves lots of room for improvement and doesn’t address some issues that are of importance to applicators. Is it time for a reset?

    Let’s say cost is no object. Here’s where I think the industry could go.

    Focus on spray delivery

    Spraying is done to protect crops. We need to do it without harming the environment while being economical with the inputs. These three tenets make up the Application Triangle, sometimes known as the 3 Es of spraying: Efficacy, Environment, Efficiency. The triangle represents the need for balance. A gain in one or two areas often requires a loss in another. That’s why there has never been a so-called “silver bullet” in spraying.

    Priority 1: Only spray when and where required.  Site specific treatments and IPM have been slow to make their way to the spraying world partly because of the low cost of inputs, but also because of difficulties defining and mapping areas that require different rates or products. The machine learning revolution is changing that. Green on Brown or Green on Green sensing can do more than save inputs. They can generate maps that document the change of weed patches over time, identifying priority areas and threshold densities and flagging problems early.

    Priority 2: Integrate air assist. Air carries small droplets towards the target, protecting them from displacement by travel-induced or ambient winds. Once there, air can improve target interception and retention. It has to be done right, though, as improper adjustment can result in the opposite outcome. The reason it’s high on this list is because it improves efficacy and environmental protection at a modest cost.

    Priority 3: Improve droplet size control.  Nozzle design has improved, but the overall range of spray qualities that is achievable for any specific nozzle remains narrow. Sprays can be made finer or coarser with spray pressure, but this has implications for pattern uniformity. Twin Fluid nozzles currently offer the widest range of spray qualities, allowing one nozzle to do it all. We simply need greater droplet size flexibility on the spray boom.

    Priority 4: Use nozzle-specific rate control.  At minimum, a sprayer needs a system that allows for individual nozzle rate control within a wide window, say 4:1. This allows consistent dosing over a wide speed range, turn compensation, or local adjustments to dose for specific (sensed) canopy conditions. By layering direct injection at the nozzle on top of this, the sprayer can change rate and volume independently. Being able to spray the right amount in the right spray quality at the right volume, where needed completes the opportunity created by pest and canopy sensing.

    Create better infrastructure

    The backbone of the sprayer, the frame, drivetrain, boom, tank, pump, and plumbing, are responsible for carrying and delivering the spray liquid. Poor management of these variables results in an unproductive, heavy machine.

    Priority 1: Prepare booms for future.  A limiting factor in sprayer performance is boom width and stability. Consistent and low boom heights are the cornerstone of good application, ensuring uniform distribution, reducing drift potential, and improving targeting within the canopy. But perhaps as importantly, stable booms are essential for accurate optical spot spraying and any other sensing tasks that will rise in importance. Set a standard for sway, say target height plus or minus 10 cm along the width of the boom, 90% of the time. Do the same for yaw. Accommodate brackets for sensors and wiring harnesses when designing the boom fold.

    Priority 2: Improve plumbing.  Poorly executed sprayer plumbing causes waste and decontamination headaches. Although rubber hoses attached to plastic fittings provide a very versatile and generic building block, they generate and hide countless niches in which pesticide mixtures or active ingredient residue can accumulate. A simplified design that incorporates more engineered stainless steel tubing, smooth directional and dimensional transitions, interior surfaces that don’t accumulate residues and generate more efficient flows – all these would improve many aspects of the spray operation. It needs to be goal oriented – i.e., zero waste in priming and cleaning, guaranteed decontaminated after a rinse cycle. Draining on the ground should not be necessary.

    Priority 3: Save weight. Weight causes compaction and eats fuel. Advanced materials or techniques can save weight while preserving strength. Savings can be applied to capacity. We need to explore advanced materials and trussed or exoskeletal designs (see “Aerodynamics”).

    Priority 4: Consider aerodynamics in chassis and boom design. Wind blowing past a tractor, tank or boom, or counter-rotating air from wheels creates turbulence that displaces small droplets within it, reducing uniformity. Cleaner air makes it easier to use smaller droplets, easier to implement air assist or any other drift-reducing technology. This is no small task, as air can come from any direction. But as units become larger and travel faster, this effect can’t be ignored. Monocoque designs that use aerodynamic exteriors to carry machine weight may provide an answer.

    Provide quality control

    Spraying can be a guessing game, hence the terms “Spray and Pray”. We don’t know the outcome for days or weeks, depending on the mode of action, and by the time the result is known, it is too late to do anything if it’s unsatisfactory. But we can do better in assuring some sort of standard.

    Priority 1: Confirm pressure, flow, and patterns at nozzles. The average sprayer has one flow- and one pressure-sensor. It can confirm the flow of the entire spray boom but cannot do that at the nozzle level. PWM has helped, by inferring flow from duty cycle. But actual liquid flow, and its pressure, remain unverified at the spray tip. A visual inspection of the pattern is necessary, and this is not only impractical but also wasteful and potentially hazardous.

    Priority 2: Characterize canopy. If we knew the crop canopy was dense or sparse, we could adjust the water volume or rate of the product accordingly. LiDAR (Light Detection and Ranging) can characterize the physical structure of an object that would indicate density or porosity for which a dose (or droplet size, or air) adjustment may be necessary. This is not some future technology. The iPhone 12 Pro has it. Even RGB image processing could do something very similar.

    Priority 3: Confirm coverage and drift.  Say we’ve characterized the canopy and adjusted the atomization to suit. Is it having the intended impact? We will need a way to verify that the settings of the sprayer result in the required canopy penetration and coverage, even drift, on-the-go. We would need sprayer-mounted sensors that see spray deposits or an airborne spray cloud. The verification must be fast enough to make corrections during the spray operation. This kind of quality control provides the feedback loop to the first priority, spray delivery. It creates a perfect environment for machine learning and continuous improvement.

    Priority 4: Improve user interface.  The complexity of modern equipment monitors is great if you’re familiar with their features. But if you’re a new user or less comfortable with layers of screens and buttons and warning beepers, navigating the monitor can be a game stopper. Can we have beginner modes? Or a system where the monitor more actively engages with the user, asking questions or reminding a novice of key settings? The friendliness of the interface is a sleeper issue, it seems less important at first look but can over-ride many equipment features because of the power of a positive user experience.

    I challenge sprayer manufacturers to conceptualize and show us the ideal sprayer they’re working towards. The perfect unit may never reach us, as this proposal is rife with technological and cost barriers. But it is nonetheless important to identify priorities and identify possible ways to meet them. As we creep towards the solution with incremental improvements, recall that its not the size of the step that matters, it’s the direction.