Tag: productivity

  • Sprayer Productivity for Smaller Scales

    Sprayer Productivity for Smaller Scales

    Travel is an amazing teacher. It exposes assumptions and replaces them with real life experiences.

    On a recent trip to New Zealand, I learned a valuable lesson in sprayer productivity. I had long talked about wider booms being a key factor, being an easy change that allowed more area to be covered per pass. I had assumed large fields, large tanks, and fast fills as part of that system, and validated it with calculations and observations.

    During that trip, I learned that things look really different when the landscape dictates certain limitations. In places like New Zealand, fields tend to be smaller, as expected, with the longest run averaging 300 m or so. Sprayers are also smaller capacity, with trailed sprayers typically fitted with a 24 m boom and a 3000 L tank. Mounted sprayers, commonplace on the North Island, may have smaller tanks and booms, with 2000 L and 18 m width a reasonable average. Self propelled sprayers are not common on farms, but custom applicators use them.

    Tender systems (called bowsers) are also rare. Most applicators return to the farm yard, or another nearby water source, to fill. A single filled sprayer can often do that entire field, so moving to a new field and re-filling are part of the same workflow.

    Some very interesting things happened when such a scenario was analyzed.

    We used a newly re-vamped Productivity Calculator (below) to make the calculations.

    Some basic configurations were assumed. All sprayers travelled 15 km/h when spraying, and turned in one headland at 8 km/h. The tank remainder that necessitated a re-fill was set at 5% of tank volume. Tank cleaning was assumed to be required every four tanks, taking 60 minutes. Sprayers were typically refilled in the farm yard or a nearby water source, requiring a ferry (transport) time of 15 minutes each way.

    The first scenario was the base configuration, from which one factor was changed in each iteration to examine the magnitude of the change. With the 24 m boom, 3000 L tank, 200 L/ha application volume, a field length of 300 m, a loading time of 30 minutes, and a loading location that required a 30 minute round trip, net productivity was 8.0 ha/h. 22% of engine hours were spent spraying, the remainder was lost to turning at the end of a run, driving to the loading location, loading the sprayer, and cleaning it. We will call that the spraying efficiency.

    Because wider booms are successful in improving productivity in western Canada, we examined the practice for smaller farms. Increasing the boom width from an average 24 m to 36 m yielded the first surprise. Productivity only increased to 8.5 ha/h (7%), and spraying efficiency was reduced to 16%.  The problem appeared to be that the wider boom dispensed with the tank contents faster, requiring more frequent filling. And that of course was the big time user, accounting for 60% of the engine hours. 

    The next step was to examine a larger tank (5000 L), keeping the original 24 m boom. This change yielded big results, with productivity jumping to 11.1 ha/h, a 33% increase from the base condition. The larger tank reduced the frequency of filling, and that reduced its drag. Spraying efficiency jumped to 31%.

    Another way to achieve a lower filling frequency is to lower the amount of water applied. This is a bit risky, as water volume is likely to most important variable that ensures good spray success, especially when dealing with dense, high yielding crop canopies. In cases where canopy penetration isn’t an issue, and systemic products can be used, less water may be an option. A modest decrease from 200 to 150 L/ha was tested.

    Again, a large jump in productivity was observed, from the base of 8.0 ha/h to 9.7 ha/h, about 21%, resulting in 27% spraying efficiency.

    What if fields were merged, or shelterbelts removed, resulting in longer spray passes? These would reduce the time lost to turning, which had been 8% of engine hours for the 300 m pass.  We decided to test a 600 m pass. But while it reduced the proportion of time spent turning to 4%, overall productivity barely nudged to 8.3 ha/h.  That’s a 4% improvement, not worth removing any trees over.

    One of the biggest game-changers in sprayer productivity has been the 3” transfer pump and efficient product induction systems. Reducing fill time from 30 to 15 minutes did have a large effect here too, increasing productivity to 9.3 ha/h, a 16% increase from the base. There remain inefficiencies in the system, such as the time spent with partial jugs that require measuring. A faster pump doesn’t address these. But perhaps a closed transfer system can.

    With the travel time associated with a home fill being such a large time consumer, introducing a field-based tendering system was expected to have a large impact. We combined this with a fast fill because a proper tender unit would have the larger pump. And the results were impressive, a jump to 13.7 ha/h. That’s a 72% increase from the base scenarios, boosting spray efficiency to 38%. 

    The final scenario involves two large changes. A new, larger sprayer with a 5000 L tank and 36 m boom, combined with a fast fill tendering system. And the results were equally large, boosting productivity to 19.8 ha/h, more than doubling the performance of the base condition (a 148% improvement). Spraying efficiency did not increase further from the fast-filling tendering system alone, because the faster filling was accompanied by the faster emptying of the wider boom.

    What is the value of this study? For one thing, we learned that a change that works in one geographic area may not work in another. For these smaller field scenarios, the benefit of a wider boom was undermined by the long downtime during fills. And obtaining a tender system when a single sprayer fill can cover a whole field wasn’t a slam dunk like it is elsewhere, where a field often requires several fills.

    Does a producer actually need to spray everything faster? The answer will depend on each farm. A general observation we’ve made is that the windows of opportunity for spraying are getting narrower. Restrictions on wind speed or temperature leave fewer hours in a day to get the spraying done. The risk of falling behind is lurking. And that means that application may not get done when they’re most effective. Disease may have progressed. Weeds will have grown. Crop safety may be challenged. Being even a little more productive can help mitigate all those risks.

    If nothing else, it’s critical for an applicator to know where the time goes. Use the calculator. Only then can you be strategic about correcting a problem. 
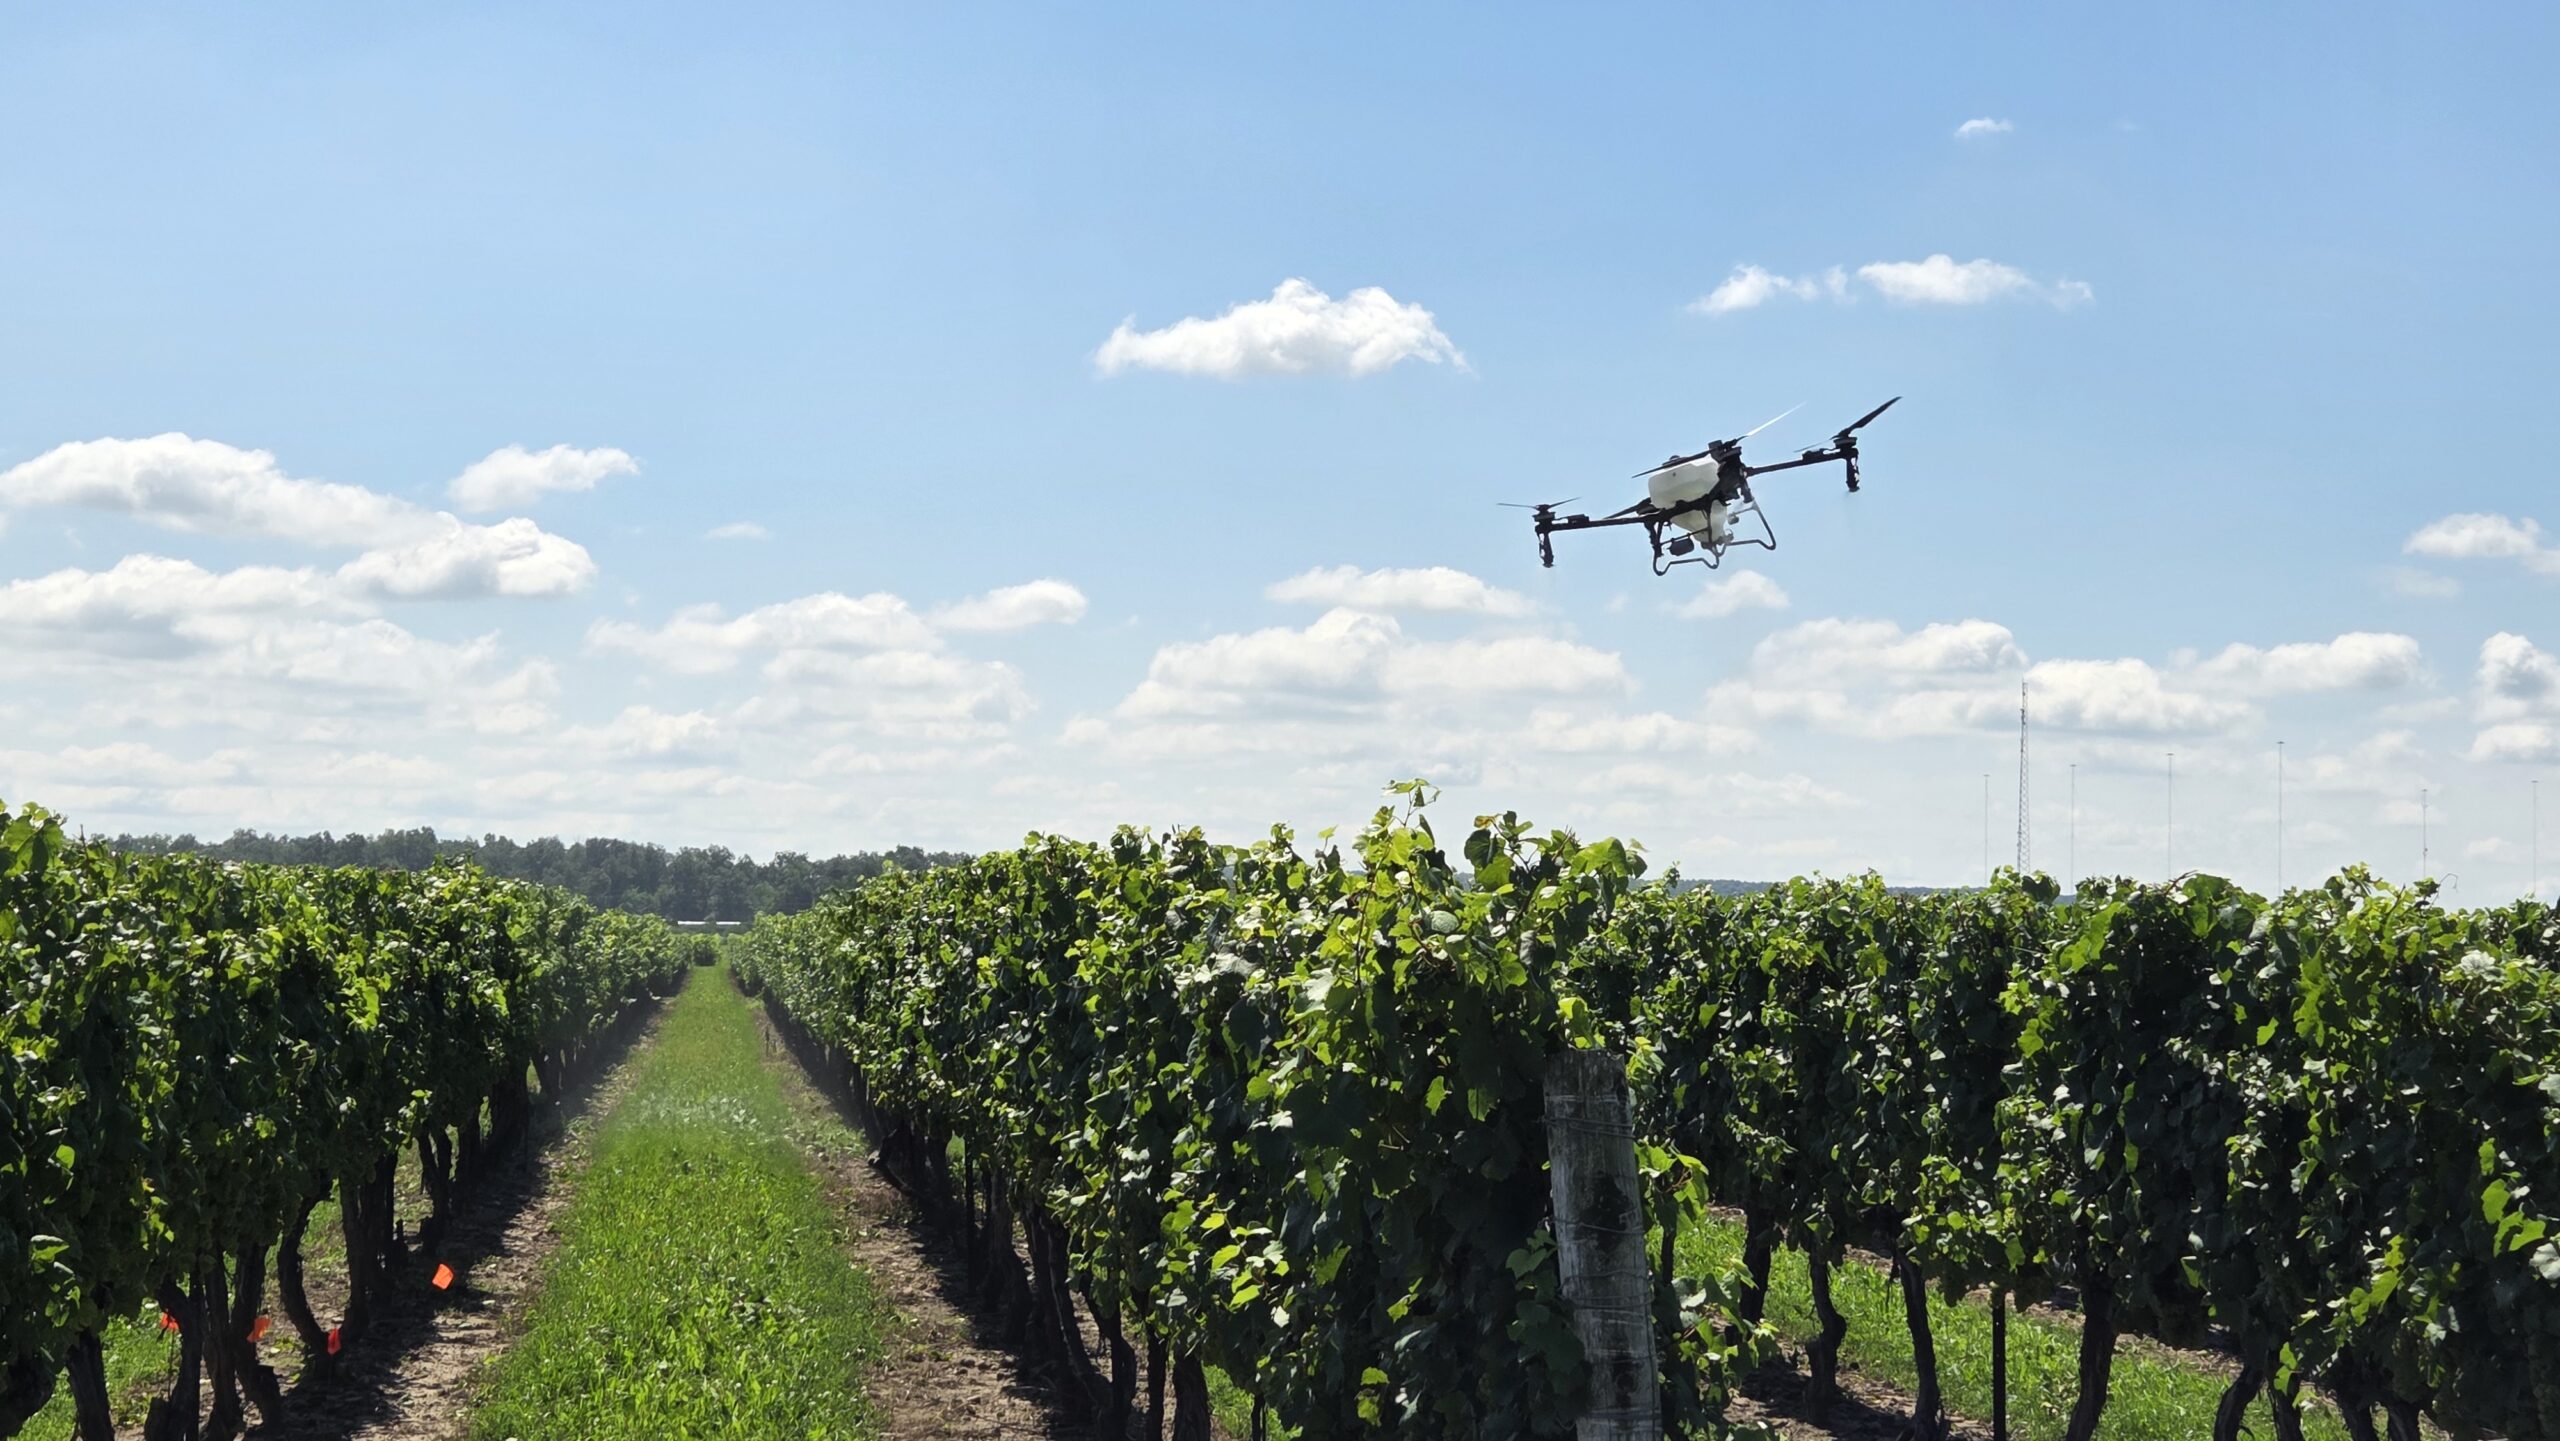
  • Improve your Drone Spraying Productivity

    Improve your Drone Spraying Productivity

    Drone operational settings such as capacity, speed, and swath width are useful figures for calculating productivity, but they only describe the airborne portion of the job. A commercial application business must also transport water, mix product, charge batteries, and establish an efficient staging area that is both safe for operators and maintains drone connectivity. If any of these functions fall behind, productivity suffers.

    We used one Ontario operator’s experience to show why drone productivity is measured as a complete application system, and not just flight settings. Download our offline version of the calculator or try it online at the end of this article. It has been pre-populated with the metrics from a corn fungicide case study. Agronomic context matters when considering operational settings.

    How to use

    Adjust a single variable to see what effect it has on productivity. Return the variable to its original value, then change another. That way you can explore the relative influence of each variable on the overall job.

    Which factors matter most?

    The factors that have the biggest impact on productivity are situation-specific, but here are some generic observations:

    • While swath width and flight speed play a role, both are limited by the agronomic realities of the job, so there may not be much latitude to change these figures.
    • Water volume used has an impact on productivity, but once again there are agronomic considerations. Too low a volume can compromise product efficacy and contribute to off target drift, and quite often the minimum volume is stipulated on the product label.
    • The drone’s tank capacity depends on the model, but maxing it out may not be the best option. Some large drones suffer reduced battery life and slower acceleration when filled completely.
    • The ferrying distance between where the drone empties and the staging area is variable throughout the job. This is why the calculator asks for an estimated average. Minimizing this number is an important consideration, but it may not be subject to change because the staging area location is primarily a function of field access, drone connectivity and operator safety.
    • The time to fill the drone and swap batteries plays a large role in productivity, depending on how many cycles are involved. Small improvements here compound into big impacts.
    • Tender water tank capacity (and refills) play a big role as well. If the operator has to stop spraying to retrieve more water, the drone isn’t spraying.

    Enter the parameters from your own operation to see what happens. The drone settings get a lot of the attention, but it’s tendering efficiency that keeps it earning.

    Drone Productivity Calculator

    Estimate field productivity, application time and water-support requirements with live operational modelling.

    Step 1

    Field and flight inputs

    seconds
    passes
    Step 2

    Water and support logistics

    minutes
    min/stop
    Do water retrievals halt operations?
    Yes
    Step 3

    Advanced flight model

    %
    %
    Live productivity estimate
    0.0
    Total operation
    Spraying share
    Productivity time
    Water required
    Water tripsadditional retrievals

    Time by activity

    total minutes

    Operational balance

    Operation details
    Ready to share this scenario?

    Download a branded, print-ready report of the current results.

  • Increase Sprayer Productivity Without Driving Faster

    Increase Sprayer Productivity Without Driving Faster

    Timing trumps most things in crop protection. A great spray applied at the wrong time isn’t nearly as valuable as a mediocre spray at the right time. So how do we improve our ability to get things done at the right time?

    Often, we try to win races by driving faster. In our last article, we looked at driving speed and concluded that faster speeds can lead to more drift and less uniform deposition. Driving slower can be viewed as a sort of insurance policy: You may not notice the benefits right away, but on days when that extra bit of performance is required, you’re covered.

    So how do you get the job done quickly if you can’t drive faster?  To answer, we have to look to other opportunities for boosting productivity.

    Recently, we used our and tried to capture all the elements of a normal spray operation that affect timeliness. These were:

    • travel speed
    • boom width
    • tank size
    • water volume
    • field length
    • number of headlands
    • turning speed
    • fill time

    First, we identified a reasonable base condition. For the sprayer, that was a travel speed of 14 mph, a 90’ boom, an 800 gal tank, a 10 gpa water volume, and a 20 minute fill time. Then, we set up a typical field situation, which was spraying a half-mile run on a quarter with two sprayed headlands and a turning speed of 8 mph. Finally, we changed one factor at a time to determine its relative importance.

    Before we discuss the results, let’s make it clear that just because changing some of these factors improves productivity doesn’t mean we’re recommending them! For example, adequate water volume remains an important input that improves coverage and permits the use of low-drift sprays. Larger tanks increase compaction and take more power, and so forth.

    Here’s what we found:

    All productivity values were expressed as acres per engine hour. For this reason, our numbers will be lower than what a typical sprayer monitor reports, most of which calculate acres per spraying hour.

    For the base condition, the sprayer spent 15% of its driving time turning, and 37% of its on-field time stationary (i.e. filling or cleaning).  For every hour spent on the field, less than half the time (48%) was spent spraying. This resulted in an average productivity of 82 acres/h.

    Increasing the spray speed to 18 mph increased average productivity to 93 acres/h, but it also increased the proportion of time spent turning and loading, resulting in just 40% of the field time spent spraying.

    Decreasing the loading time from 20 to 10 minutes reduced the proportion of field time spent stationary to 23%, covering 100 acres/h at 14 mph. Surprisingly, this was the productivity-winner, resuling in 62% of on-field time spraying.

    We discovered other powerful productivity factors, and chief among them was boom width. A 33% increase in boom width from 90’ to 120’ gave a productivity boost to 94 acres/h, close to the same result as increasing the travel speed to 18 mph earlier. Similar side effects occurred: more time turning, and a greater proportion of time filling, as we saw with faster travel speeds.

    Boom width seems to have some room for growth.  Many smaller European counties use wider booms than we do in North America, for example.  With gps guidance and large fields, we have excellent conditions for their implementation.

    Two other factors that had similar effects to fill time were water volume and tank size. Less water and larger tanks increased productivity by decreasing the fill frequency, with effects similar in magnitude to speeding up the fill time. Decreasing the water volume from 10 to 5 gpa increased productivity to 100 acres/h by decreasing the proportion of time the sprayer was stopped from 37% to 23%. Increasing from an 800 to a 1,200 gallon tank increased productivity to 94 acres/h, again by decreasing the proportion of time spent filling to 28%.

    Taken together, a sprayer with a 120’ boom, a 1,200 gal tank, applying 10 gpa and filling in 10 min had an average productivity of 132 acres/h. And this was achieved without driving faster than 14 mph. If you can string two quarters together and drive a whole mile before turning, that number rises to 145 acres/h, a surprisingly large 13 acres/h gain.

    The perspective of minimizing downtime extends to other tasks, too:

    • Be more prepared for the job by reviewing the product label in advance, noting the correct mixing order.
    • Keep extra nozzles, clamps, and nozzle bodies in the cab.
    • Don’t clean plugged nozzles, replace them.
    • Use low-drift nozzles so a small increase in wind doesn’t shut you down.
    • Ensure all the products needed are on the tender truck (e.g. pesticide, adjuvant, tank cleaner, anti-foamer, etc.).
    • Consider switching to 3” plumbing (pump rates of 300 – 400 gpm are possible).
    • Make sure your inductor won’t be the limiting factor. For example, product pumps can be awfully slow when the product is cold. It might be worthwhile to explore a venturi system.

    Speeding up the fill process is a good idea, but be careful with certain products. Dry materials such as the sulfonyl ureas (e.g. Refine, Express SG, etc.) and some fungicides (e.g. Astound, etc.) require time to hydrate in water so they mix properly. Some operators pre-hydrate these in a smaller tank, while others get an extra tank to pre-mix whole loads and simply transfer them over.

    Also think about the time spent cleaning the sprayer. Thoroughness is important, but perhaps there are efficiencies to be gained there as well, like never letting a sprayer sit after spraying. We’ve written about continuous rinsing, for example, to improve cleaning speed and effectiveness.

    So, the quicker we can spray, while ensuring a quality job, the more effective our crop protection practices will be. We encourage you to use our to determine your best configuration.

    Got a productivity tips to share? Let us know! And remember: In spraying, the race is won in the pits.

    Factor

    Base

    Drive Faster

    Fill Faster

    Spray Wider

    Less Water

    Bigger Tank

    New Sprayer

    Travel Speed

    14 mph

    18 mph

    14 mph

    14 mph

    14 mph

    14 mph

    14 mph

    Fill time

    20 min

    20 min

    10 min

    20 min

    20 min

    20 min

    10 min

    Boom Width

    90 ft

    90 ft

    90 ft

    120 ft

    90 ft

    90 ft

    120 ft

    Water Volume

    10 gpa

    10 gpa

    10 gpa

    10 gpa

    5 gpa

    10 gpa

    10 gpa

    Tank Size

    800 gal

    800 gal

    800 gal

    800 gal

    800 gal

    1200 gal

    1200 gal

    Field Length

    0.5 mile

    0.5 mile

    0.5 mile

    0.5 mile

    0.5 mile

    0.5 mile

    0.5 mile


    Time Turning

    15%

    19%

    15%

    20%

    15%

    15%

    20%

    Time Loading

    37%

    42%

    23%

    42%

    23%

    28%

    19%

    Time Spraying

    48%

    39%

    62%

    38%

    62%

    57%

    61%

    Acres/h

    82

    93

    100

    94

    100

    94

    132

    To work with the productivity calculator, click here.

  • Airblast Productivity and Work Rate Calculator

    Airblast Productivity and Work Rate Calculator

    There are many factors that affect the work rate of an airblast application. If an operator can improve their work rate, without compromising spray efficacy or safety, they improve operational efficiency and save money.

    But how does each variable factor in? Is it worth the cost of a tender truck and operator to fill more efficiently? Should you upgrade to a multi-row sprayer? Should your next planting have longer rows? We have a simple calculator that can help you make these decisions. You can build and compare multiple scenarios to explore the relative impact of small changes to your typical spray program. We recommend making only one change for each scenario so you can better understand the results. Print the comparison page for your records.

    Whether you’re a sprayer operator, or a manager of sprayer operators, this exercise will help you see your spray program in a whole new light. Download a copy of the Airblast Budget and Work Rate Calculator and explore your productivity. You must have Excel to run the spreadsheet, and you must permit the use of macros (you’ll be prompted to accept).

    Spoiler: It’s amazing how changes to travel speed have only a marginal impact on work rate. Often less than 60% of the total spray job is spent actually spraying!

    If you’d like to see just how productive you can be, check out this rare (possibly unique) sprayer from Ed Oxley Farms in Michigan. Built on an OXBO 7550, this sprayer is the fourth iteration of a concept developed over the last 20 years by Ed Oxley Farms and ag engineers from Michigan State University.

    Capable of spraying five rows at a time, this self-propelled beast is a hybrid wrap-around and targeting-tower system that uses CurTec spray heads equipped with tangential fans and wire-mesh basket rotary atomizers.

    That’s not dribbling – that’s purging the boom prior to spraying.

    It sprays a mere 150 L/ha (~ 15 gallons/acre) at a ripping 13 km/h (~8 mph), as seen on the Ag Leader monitor below.

    When row spacing and turn time are accounted for, that means it’s capable of covering almost 15 hectares (~40 acres) per hour.

    And, when not spraying grapes, the boom can be swapped to make it a high-clearance corn sprayer. It doesn’t get much more efficient than this.

    The following videos will show the view from inside and outside the cab. Note that the row that’s straddled is sprayed from an overhead spray head mounted to the centre rack behind the sprayer. The two adjacent rows are covered from one side from vertical spray heads mounted on the chassis. Finally, the boom holds two more overhead spray heads for the outer-most rows.

    Ideally, the boom-mounted spray heads would be suspended vertically inside the row, but it makes for such a wide turn radius that it would take too long to turn… assuming there was enough headland to allow it. They’re also swept-back to minimize the turn radius and reduce the amount of airborne spray that deposits on the sprayer itself.

    A clever design that makes a few compromises to ideal coverage in order to improve productivity. The balance works for them and this sprayer might be a sign of things to come in horticultural crop production systems. Want to see how your sprayer stacks up? Download the calculator and see where you might be able to make improvements.

  • Does the Pull-Type Sprayer once again have a Place on our Farms?

    Does the Pull-Type Sprayer once again have a Place on our Farms?

    The self-propelled sprayer revolution is complete in western Canada. Almost all sales of new equipment are self-propelled. In fact, the once thriving sector of Canadian-made pull-type sprayers, and the innovations they brought to spraying, has disappeared.

    In its place we have self-propelled sprayers that offer plenty of power, large tanks, high mobility and comfort, and of course, the clearance required for late-season sprays. These features come at a cost: high capital expense, weight, fuel consumption and drift potential if the speed or boom height are not controlled.

    The self-propelled machines are nice; however, customers are becoming concerned about overall value. Sure, the sprayer is the most-used piece of equipment on the farm, with the average field being treated four to five times per year. Does that justify the $500 to $700 k purchase price?

    To answer this question, we need to evaluate the alternatives. Even though we’ve lost most North American pull-type sprayer makers, a few, such as Top Air, are left. A new pull type, the Connect Sniper, is being offered by Pattison Liquid. In addition, there are now several European manufacturers looking at our market. These bring large capacity, sophisticated booms plumbing and a narrow transport width. Let’s look at the issues:

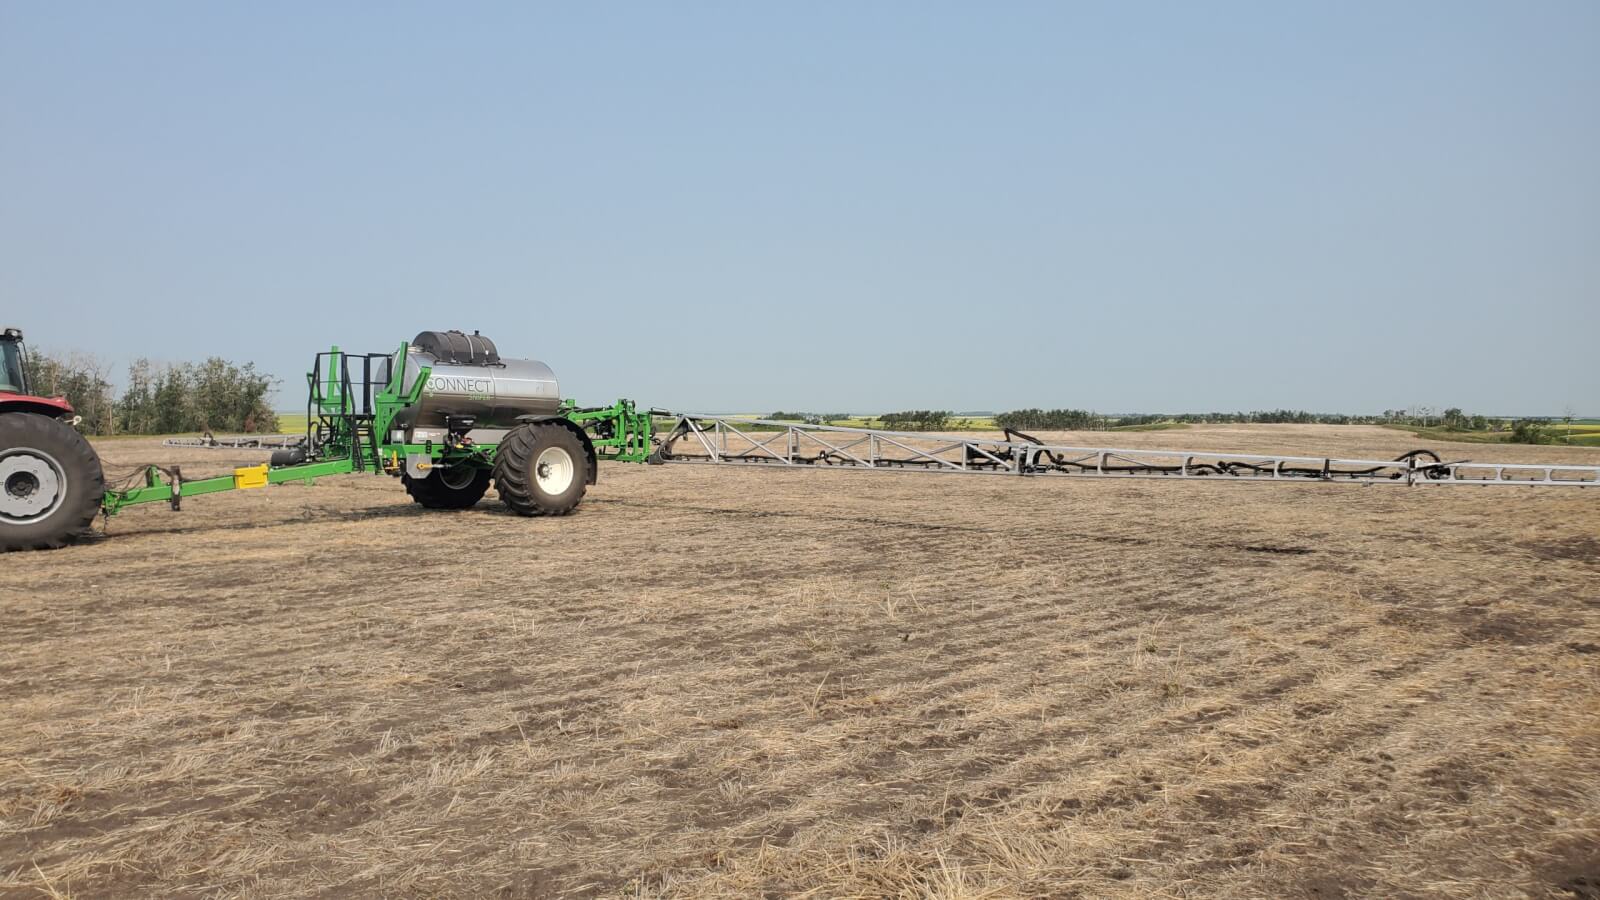
    The Connect Sniper, manufactured by Pattison Liquid, offers recirculating booms, Raven Hawkeye pulse-width modulation, continuous rinsing, and 120′ Millenium booms. The WEEDit spot spray system is also available.

    Capacity

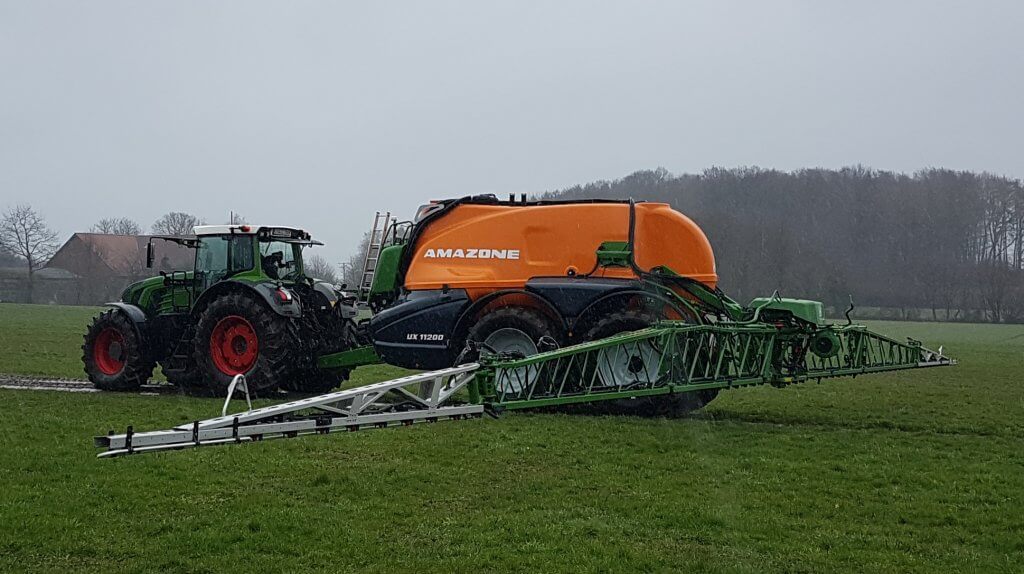
    Not a problem. Top Air features tanks up to 2400 gallons and 132’ booms. Amazone builds a 3000 gallon tank twin axle sprayer (UX11200) with 132’ booms. The 230 gpm on-board diaphragm pump can fill the sprayer in 15 minutes. The Hardi Commander offers tanks up to 2600 gallons with 132’ booms. The Horsch Leeb TD12 is at 3170 gallons with 138’ booms. Equipped with air brakes, these sprayers can be trailed at up to 50 km/h.

    The Amazone UX 11200 has an 11,200 L (2960 US gal) tank and tandem, steering axles combined with up to 130′ booms.

    Clearance

    The pull-types themselves have adequate clearance for most crops. The limiting factor will be the tractor and the hitch point. The availability of a high hitch point, and an 80 mm ball, on European tractors, is a boon for this.  Although it may be necessary to shield the low standard drawbar and belly, pull-type owners report no long-term effects from the lower clearance.

    The Horsch Leeb TD12 offers a 12,000 L (3170 US gal) tank and up to 1.25 m ground clearance (Photo: Horsch.com).
    European tractors offer 80 mm ball hitches for larger implements with high mounting heights to gain extra sprayer clearance.

    Tractor

    The pull-type sprayer makes most sense if it allows the re-purposing of an existing tractor.  The common yard tractor isn’t enough, as the high capacity sprayers may require >200 hp with front wheel assist, especially in softer ground or hilly terrain. Another requirement is that the track width match the sprayer, and the European standard of a 2.25 m track width (centre to centre) can be hard to match in North America. New rims on the sprayer can push the width out, but the resulting increased axle stress may be problematic; these issues should be considered in advance. Fortunately, powerful front wheel assist tractors are finding a place on farms, even as seeding tractors. The changing over from one implement to another during a busy time can be a hassle, with a dedicated rate controller requiring additional cab real estate. But with the lower capital cost of a pull-type, a new tractor that also has other utility on the farm may be justified.

    Large pull types require large tractors that may not already exist on the farm. The ability to match wheel tracks and the convenience of monitor hookups are important considerations.

    Productivity

    We’ve long maintained that productivity gain through increased travel speed creates more problems than it solves. It is virtually unavoidable to use somewhat higher booms with faster speeds, and it’s been proven that spray drift potential increases with travel speed. Instead, the sprayer features that save time are faster fill and clean times (reduced downtime), larger tanks (fewer stops to fill) and wider booms. Wider booms are easier to keep steady with slower moving equipment.

    So how do typical self-propelled sprayers stack up against pull-types?

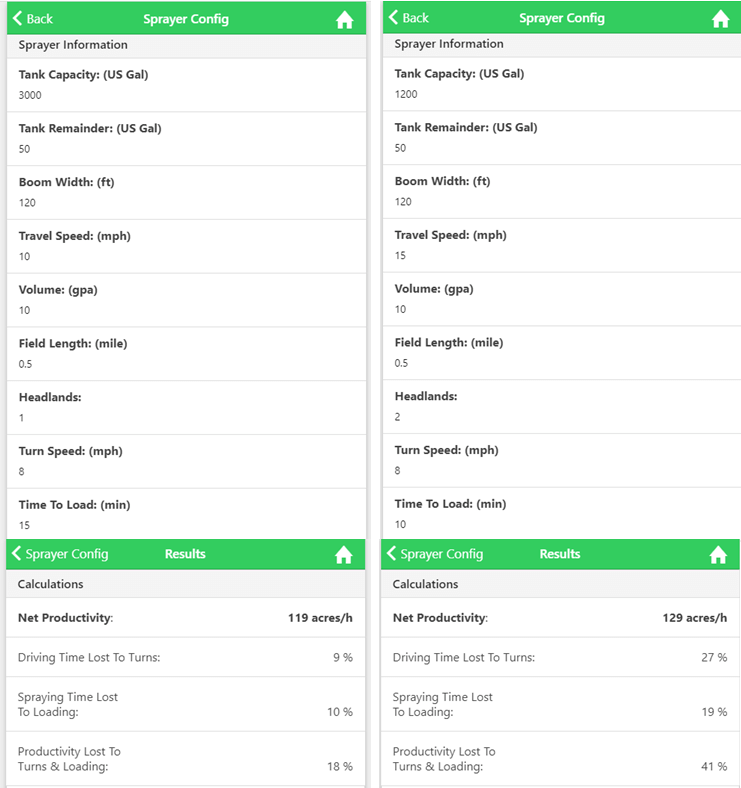
    We compared two sprayers, a large pull-type with 3000 US gallon tank and a typical self-propelled with a 1200 gallon tank. Travel speeds were 10 and 15 mph, respectively, and fill times were 15 and 10 minutes. The slower pull-type turned in one headland, whereas the self-propelled used two to allow room for acceleration after the turn.

    On half-mile runs, our “Productivity Calculator” at agrimetrixapps.com showed 129 acres per hour for the self-propelled and a respectable 119 acres/h for the pull type.  The value of fast but infrequent fills and the more efficient turns made the difference for the pull-type.  Use the app to compare other tank sizes, travel- and fill-speeds, or boom widths.

    Productivity of a 3000 gallon tank pull-type (left) vs a 1200 gallon self-propelled (right), given specific speed, boom width, and fill times.

    The specific design features of a sprayer may create additional productivity. For example, the ease of tank rinsing and cleanout can save time. European sprayers typically have lower remaining volume values, which increases the speed of tank rinsing and can eliminate the need for dumping tank remainders on the ground. Ease of filter inspection may seem trivial, but it permits more frequent confirmation that the system is clean and thus avoids potential future problems.  An on-board pressure washer on the Amazone makes boom hygiene easier. It’s important to account for all these seemingly small gains because they add up.

    Service

    The success of any agricultural equipment relies on the equipment durability, fast availability of parts and service. Any new market entry will need to establish a dealer network, parts distribution system and superior service. This is no easy feat in a time of dealer consolidation. But without a drive train, there’s less to go wrong in a pull-type, and many plumbing parts are generic or can be obtained in metric equivalents.

    With fewer mechanical components, pull-type sprayers require less service and are less prone to breakdowns.

    Cost and Value

    Prices vary, but a pull-type sprayer will usually cost less than half of a similar-sized self-propelled sprayer depending on the options selected.

    With European-influenced equipment, the plumbing system will be more sophisticated, often offering recirculating booms, steering axles that follow in the tracks of the sprayer, narrow transport widths for greater road safety, an improved boom suspensions and levelling performance. It is safe to say that in terms of features, these sophisticated machines offer good value and many good design ideas. Operating costs are almost certainly lower, with better fuel economy and less drivetrain trouble.

    The pull-type sprayer continues to have an important place to fill on our farms. With trade and weather anomalies lowering farm income, farmers are wary of being over-capitalized. It is conceivable that lower-cost and feature-rich alternatives to self-propelled units will have a fit.  They certainly make sense on smaller farms that may not be able to utilize the full performance of a self-propelled, or on a larger farm that needs extra capacity but doesn’t want to bear the capital cost of a second expensive sprayer. The inherently slower working speeds allow for lower booms, less drift, overall improved deposit accuracy and uniformity. They’re worth a closer look.