Category: Environmental Impacts

For Basics Category

  • We Need Better Drift Control Technologies

    We Need Better Drift Control Technologies

    Sprayer manufacturers have all but offloaded the entire responsibility for drift management to the sprayer nozzle. It’s asking too much.

    Sprayers have changed a lot over the past 25 years. They have become larger, with more tank capacity, boom width, and, if self-propelled, horsepower.  They are more comfortable and ergonomic, with more sophisticated swath control and guidance systems. But every year, a very important deficiency in their design becomes obvious. Drift control.

    The changes described above are intended to improve productivity and fight operator fatigue.  Today’s sprayer can cover more ground than ever before. But the demand to cover ground, through a combination of growth in farm size and frequency of treatment, has outpaced machine productivity. As a result, operators find themselves ever further in a time deficit, with acres on the to do list and no time to get the work done.

    Spray drift remains the single most limiting factor to the safe application of pesticides. Spraying cannot happen when it’s too windy or during inversions because all agricultural nozzles produce fine droplets whose movement in the atmosphere cannot be controlled. This has been an issue since spraying began.

    Simply put, pesticides belong in one place only, and that is on the treated swath.  Applicators have some tools to make this happen, such as using coarser sprays, lowering the booms, choosing very specific weather conditions, and the like. But when winds are incessant, and crops and pests are quickly growing out of the treatable stages, what is an applicator to do?  There is only one thing they can do: lower their standards. Either miss the treatment and suffer the yield loss, or spray in the wind and hope nothing bad happens.

    Neither of these options are acceptable.

    There isn’t an easy fix. Spraying is a game of tight margins. The spray liquid in the tank must be atomized into droplets that can make their way to the target and provide adequate coverage when they get there. The total liquid volume to achieve that task must also be practical. The global ag industry has determined, over the past 100 years, that about 100 to 200 L/ha, 10 to 20 gallons per acre, is the ballpark amount that allows reasonable work rates with sprays that are just coarse enough to resist displacement in modest winds.  If it gets windier and we need even coarser sprays, we need to add more water to maintain an acceptable droplet density on the targets. And of course, the droplets need to stick to those targets, so there is a limit how coarse we can spray.

    Over the past 20 years, we’ve been asking the low-drift nozzle to do the heavy lifting in drift management, and it has served us well. But with a return to more contact modes of action for resistance management, there’s a need to retain good coverage for product performance.

    What ag needs is a drift-reducing technology that is better than the low-drift nozzle. We need a technology that maintains a practical water volume limit and combines this with intermediate spray qualities that generate good pesticide efficacy without allowing drift under windy conditions.

    These technologies need to do just one of three things: (a) Protect the driftable droplets from exposure to moving air with a physical barrier, (b) make driftable droplets less drift-prone by increasing their velocity, or (c) eliminate the driftable droplets altogether.

    Let’s have a look at some options, and explore the pros and cons.

    Shields and Cones.  A shroud surrounding the boom was first proposed and built in the 1950s in the UK by Dr. Walter Ripper. Although never commercial, his “Nodrif” boom inspired an entire industry that took hold in western Canada in the 1980s and 1990s. Shrouding worked. In studies conducted at Ag Canada, shrouds produced by Flexi-Coil, Rogers Engineering, AgShield, and Brandt reduced drift by up to 80%. But shrouds disappeared in the 90s, partly because of the advent of tight-folding suspended booms where their physical size posed a problem, but also because of crop contamination from the shrouds and poor nozzle visibility in case of blockages.

    The advent of the air-induced low-drift nozzle offered an alternative, but coarseness has been taken to its practical limit. 

    What about a newly engineered version of shrouds that addresses its shortcomings? Willmar Fabrication has created the Redball Buffer Sprayer, for example. We see hooded sprayers in row crops. But there may be other ideas. The simple device called the PatternMaster introduced by KB Industries a few years back was also a step in that direction. Let’s keep working on this.
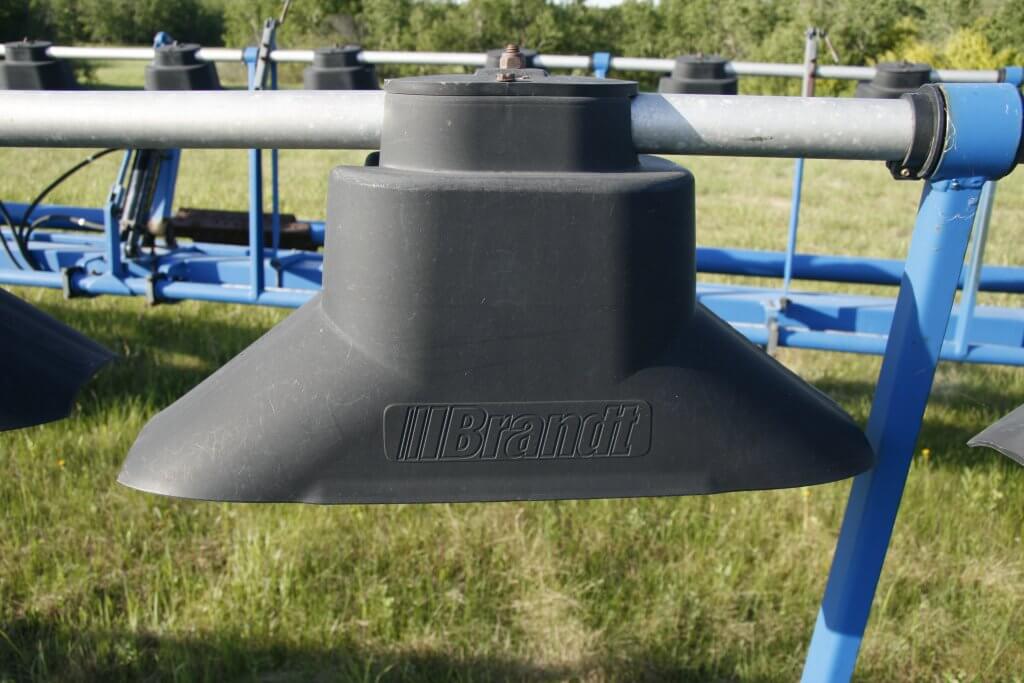
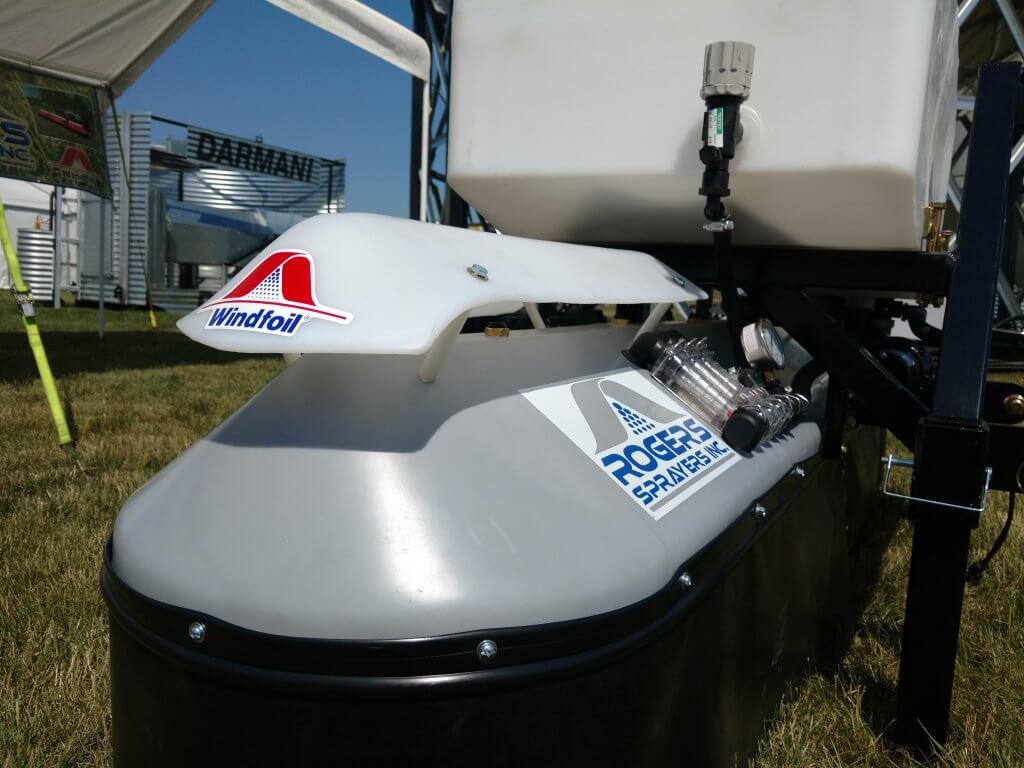
    Figure 1: Shrouded booms, once common on the prairies and proven effective (Brandt cones, top), are still used on research and turf sprayers (bottom).

    Air Assist. Small drops don’t drift just because they’re small. They drift because they have very little kinetic energy, and they get blown off course easily. Speed them up, and that problem is solved. Introducing an air stream at the nozzle can do just that. Furthermore, air assist also enhances canopy penetration, a problem that we currently attempt to address with the addition of more water. Again, this idea is not new. Hardi, once the world’s largest sprayer manufacturer, has had the TwinForce boom available for decades. An inflatable bag is positioned over the boom. Openings along the bottom direct the air down. The operator turns a knob in the cab to control fan speed, and another for forward or backward angle, until the combination is suited to the canopy and the travel speed. The SprayAir, out of Carseland, AB (purchased by Miller but no longer available) was a less elegant version because they chose an air-shear atomizer that sometimes required more air than was prudent. Too much air rebounds off the ground, increasing the drift issue. Their Trident boom, allowing a hydraulic nozzle to be used with air assist, continues to have potential.

    Air bag type air assist systems were also available from other manufacturers, but none were ever commercially successful.
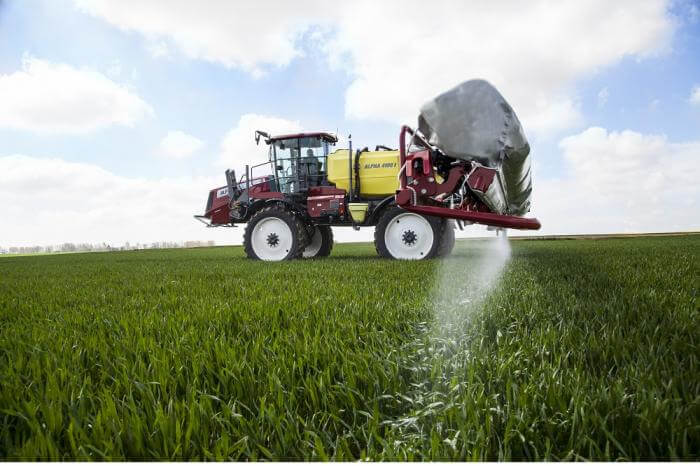
    Figure 2: Air assisted booms such as this Hardi TwinForce accelerate small droplets, reducing their drift-potential and improving canopy penetration (Source: Hardi Sprayers)

    Low Booms.  How low can booms go? It depends on the nozzle spacing and fan angle. Horsch claims that with a good boom package, this is an option. They are offering 10” spacing, and with wide fan angles, booms as low as 15” would still provide good overlap. Hands up who will try this at 18 mph. Wingssprayer has an interesting design where the boom rests on backswept plastic sheets, providing a physical barrier and a low height.
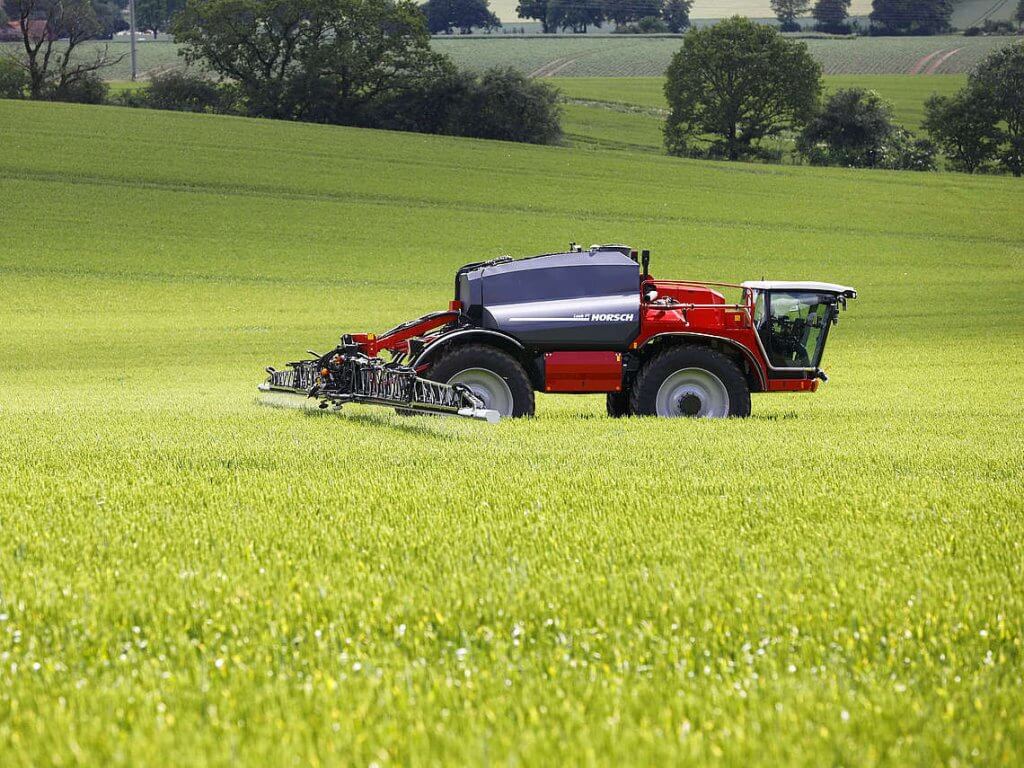

    Figure 3: Low booms can significantly reduce drift, but their success depends on superior stability and height control (Top, Source: Horsch Sprayers; Bottom, Source: Wingssprayer)

    Twin Fluid Atomizer. In this atomizer type, both air and liquid are forced out through the same nozzle. The ratio of air and liquid determines the liquid flow rate and the degree of atomization. First introduced by Cleanacres in the UK as the Airtec, improved by Harry Combellack in Australia over many years, and making a re-appearance with the Dutch manufacturer Agrifac, it’s been one of my favourite atomizers.  The small amount of air moving through each nozzle is not enough for serious air-assist, but the idea is good and perhaps it can be improved.
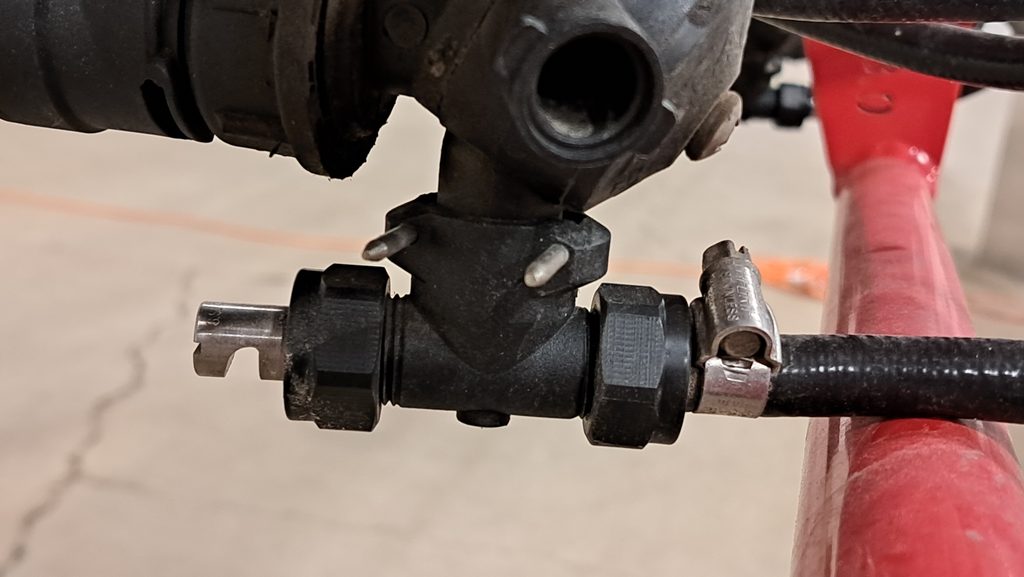
    Figure 4: A twin fluid atomizer utilizes air (entering from hose) and liquid (entering from boom) to create a spray whose droplet size and flow rate are adjustable. Air generates some assist to reduce drift.

    Electrostatics. Forget about it for drift control. The attractive force is so weak that it only works for very small droplets over short distances. It needs air-assist to work properly. See point #2.

    Rotary Atomizer. These are common on aircraft these days, as rotary cages, offering a more consistent droplet size range that eliminates the largest, water-wasting droplets, and curtails many of the smallest droplets produced by hydraulic atomizers. These attributes are powerful and address the fundamental problem: If the small droplets drift, then let’s not produce them. In reality, rotary atomizers are used mainly to produce smaller droplets to save water in the aerial business, not really solving the drift problem. In the 1970s and 80s, the concept was advanced by Micron Corporation, led by Ed Bals and later by his son Tom. Although very successful in forestry and hand-held applications in arid regions where water posed a serious limitation, the transition to boom spraying never happened.

    Rotary atomizers are now making a comeback with drone sprayers. Though promising, the flow rate capabilities of spinning disks are lower than those of the cages mounted on crewed aircraft. As a result, the disk may flood, and will no longer produce the desired monodisperse distributions.
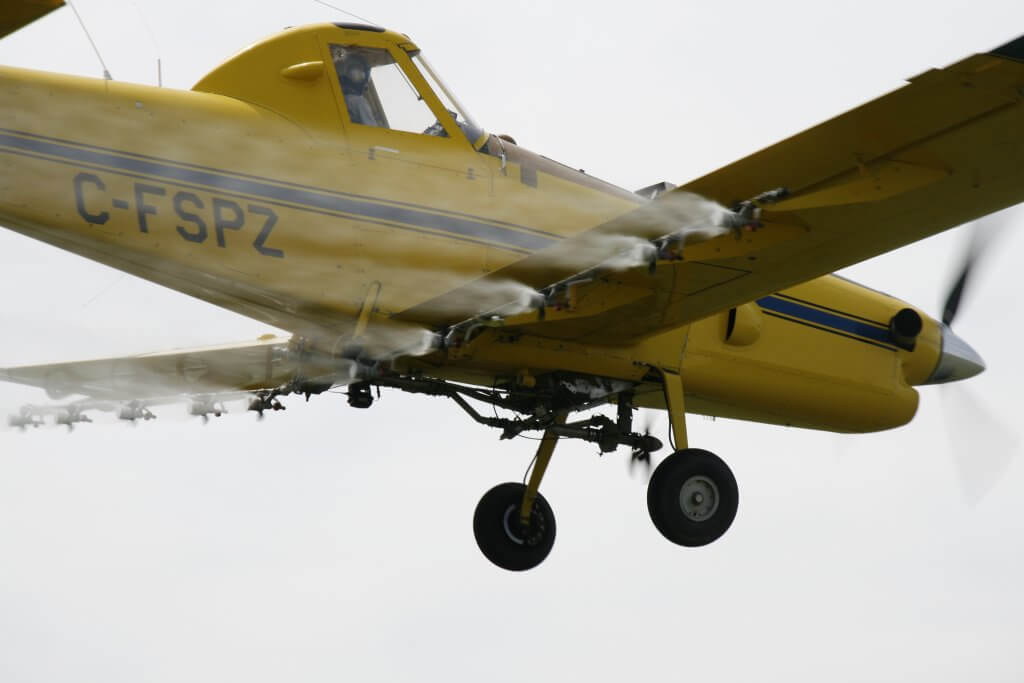
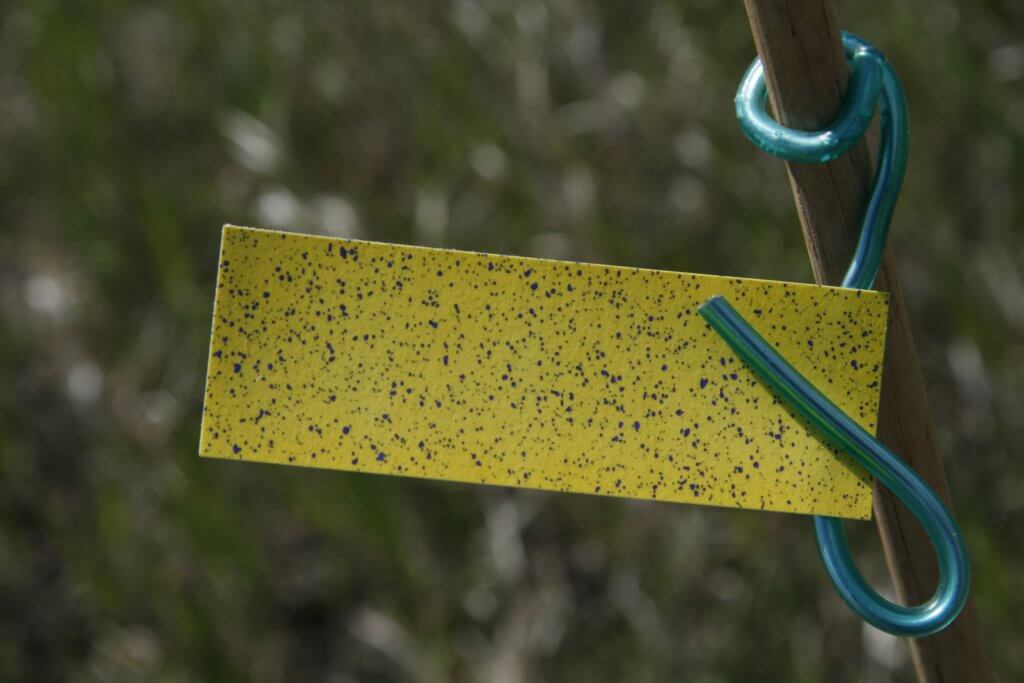
    Figure 5: Rotary atomizers can eliminate larger droplets and sharply reduced the smallest ones, leaving a more uniform sized distribution (insert). They are used on aircraft to save water, but have not been adopted on ground equipment to control drift.

    A new Atomizer. All hydraulic nozzles produce a wide variety of droplet sizes, and that variety has provided robust performance over a wide range of conditions. But it can also be a problem. Even the venerable dicamba nozzles that create Extremely Coarse and Ultra Coarse sprays produce some fines that drift in inversions. The idea put forth by Ed Bals, to eliminate the problematic size ranges, is sound. But the rotary atomizer is hard to implement on a boom sprayer. Can there be an innovation that maintains a simple overall design, produces a narrow, but low-drift droplet size range, and mates it to a bit of air assist to get the spray where it belongs? Absolutely.
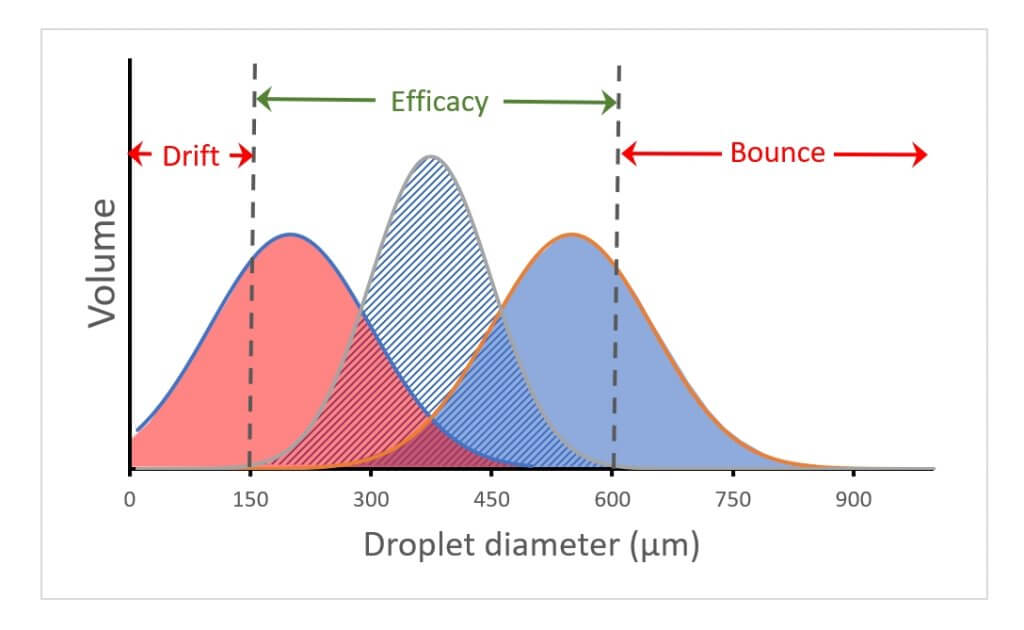
    Figure 6: Current hydraulic atomizers tend to produce a wide range of droplet sizes. The distribution on the left results in significant drift (droplets <150 µm). The one on the right wastes the larger droplets (droplets >600 µm. The narrower span in the centre distribution avoids these problem areas and delivers the spray in an efficacious portion.

    Adjuvants. One of the problems with low-drift nozzles is their tendency to generate some very large droplets. These droplets are not very abundant and therefore don’t contribute to coverage, but they nonetheless consume significant carrier volume. The current generation of oil-based drift-reducing adjuvants (DRAs) have helped reduce the drift-prone size fraction without increasing the largest droplet size fraction as much as low-drift nozzles do. This more surgical approach is welcome. Unfortunately, the drift-reducing effect is not as much as low-drift nozzles alone can achieve. A combination of these two technologies is likely the best way forward.
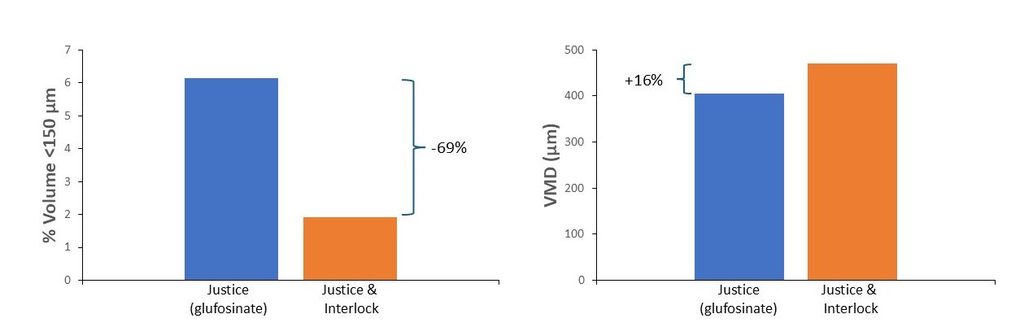
    Figure 7: Effect of DRA on driftable fines (left) and overall volume median diameter (VMD, right) from AIXR11004 tip. Data courtesy Winfield United.

    Targetted Sprays. An obvious way to reduce drift is to spray less. With recent developments in camera-driven spot spraying, this is already happening. It’s safe to assume that every percentage not sprayed is an equivalent reduction in drift potential. And with reports of 50 to 90% savings, this will be significant. How these product savings are deployed remains important. Some applicators choose to raise pesticide rates to effect better control, and this of course negates some of the gains. Others are increasing the overall spray volume. This then opens the door to the use of coarser sprays without loss of coverage, enhancing gains.
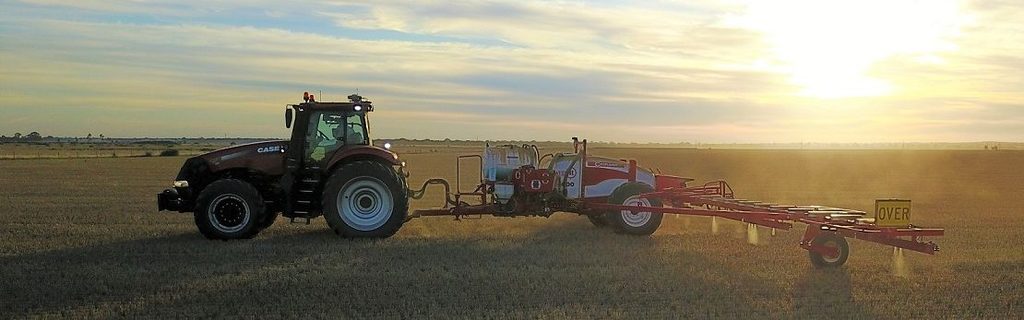
    Figure 8: Spot spraying (Courtesy Croplands)

    To create value for farmers you first need to understand farmers’ priorities and problems. Getting the spraying job completed on time often means squeezing the work into ever narrower time frame, between rains, between winds in the afternoons and inversions that same evening, between too much dew and too dry, between too early and too late. I am looking forward to the day when engineering resources are allocated to address these issues better, protecting both the environment and the stress levels on the farm.

  • Airblast Spraying in Poor Conditions

    Airblast Spraying in Poor Conditions

    Some springs are tougher than others. This article was originally written in 2019, which was particularly challenging. The frequency and duration of rain events left limited opportunity for orchard sprays. Even then, the periods between rains were transitions between warm and moist conditions and cold fronts, which makes wind gusty and changeable. These same periods leave wet alleys prone to rutting and compaction, and conditions that favour spraying may also favour pollinator activity.

    In response, applicators get frustrated. Some may be tempted to spray in sub-optimal conditions and risk drift thinking even a little coverage is better than none. But the adage that “there is no wasted fungicide spray” does not apply here. Some may disagree, but spraying in wet and high-wind situations:

    • greatly reduces coverage and subsequently, crop protection.
    • may result in repeated sub-lethal doses that can encourage resistance.
    • greatly increases the degree of surface run-off and off-target drift, risking environmental, commercial and residential
      contamination.

    The argument itself may be moot because the decision to spray is not strictly a consideration of economics, productivity, and risk tolerance. When environmental restrictions exist on a pesticide label they are inviolate. That is, they are not suggestions but legal requirements. Statements might include:

    • Not spraying when rain is forecast within 12 hours following application. This is, in part, to prevent water-soluble products from moving in surface or channel run-off.
    • Not spraying in calm conditions (generally <3 km/h, as measured at the top or outside of the orchard). This is to prevent airborne spray from moving in unpredictable directions during a thermal inversion, or downhill with stratified air.
    • Not spraying in gusting or windy conditions (generally >10 km/h, but there is no Canadian standard). This is to prevent airborne spray from moving with the wind. This is of particular import when there are sensitive downwind areas that can bring buffer zones into play

    Technologies exist that extend the spray window, but they require long-term planning and may not be economical (or even completely proven). They are generally a combination of orchard architecture and sprayer design. Examples include:

    • Tented orchards (more common in Australia) designed to exclude pests and insulate against hail, wind and inversions.
    • Shrouded vertical booms (e.g. Lipco) designed for trellised orchards.
    • Solid-set emitters (more common in Europe and still experimental in parts of the northern US) that reduce drift and can spray large areas quickly.
    • Vertical towers with downward-oriented fans (e.g. Curtec Proptec or Sardi sprayers) that rely on the orchard itself to filter
      lateral/downward-directed spray.

    Assuming the pesticide label does not prohibit application, there are adjustments that can improve coverage and reduce drift in sub-optimal conditions, but only marginally. These are compromises that sacrifice time, money, effort and/or the level of crop protection. Further, they are only intended for sprayers with towers (i.e. not low-profile axial sprayers):

    • Convert to air induction nozzles (at least in the top two nozzle positions, and likely at one rate higher than you usually use).
    • Be certain to turn off any nozzles spraying excessively over the top of the canopy. A little can’t be helped and is actually a best practice to ensure spray reaches the treetop. Be reasonable.
    • Reduce fan speed to only reach just past the middle of the canopy on the upwind side.
    • Turn off the boom on the downwind side of the sprayer and adjust airspeed and nozzle rates for upwind alternate row spraying only. Especially on the last three downwind rows, which you may have to leave unsprayed entirely.

    The best advice is unpopular: Park the sprayer until conditions improve. Like hail, there are environmental factors that are out of the farmer’s control. They are inconvenient and highly frustrating, but do not be tempted to takes risks on what might ultimately result in poor coverage and accusations of pesticide drift.

  • Grandpa used pesticides on my property 50 years ago. Should I be concerned about contamination of my well?

    Grandpa used pesticides on my property 50 years ago. Should I be concerned about contamination of my well?

    Occasionally, I receive a question or concern about impacts from the previous use of pesticides on a property. These concerns could be categorized as historical or legacy concerns from the use of pesticides over 40 or 50 years ago. This article provides some context for these past concerns and some options for follow up for the current property owner.

    There are several good sources of information that can help a farmer minimize the risks associated with current use of pesticides. While the current use of pesticides is not the focus of this article, a list of some of these resources can be found in the appendix for further reading. These are specific to Ontario, Canada, but your region should have similar resources.

    How common is pesticide contamination of well water?

    In an extensive project that collected water samples from 1,290 private wells throughout Ontario in the 1990s, University of Guelph and Waterloo University researchers found that most of the problems with well water were related to bacteria; approximately 1/3rd of well water did not meet the standard for coliforms and E. coli followed by nitrates (14% exceeded guidelines). It important to state that these problems are NOT related to previous or current pesticide management! Of the 1,290 wells sampled, water samples from six of the wells did show pesticide residue levels above the interim maximum level established at the time of publication for this study. The text below is copied from the published scientific article that discusses the findings for bacteria, nitrates, pesticides, and petroleum derivatives in the water well sample for this study.

    “About 40% of the nearly 1,300 wells tested contained one or more of the target contaminants above the maximum acceptable concentration (Table 4). Bacteria were the most widespread form of contamination with about 34% of wells having more than the maximum number of coliform bacteria (faecal coliforms, or E. coli, or total coliforms) permissible in drinking water. Some 14% of the wells contained NO -N concentrations above the 10 mg/L limit and about 7% of the wells were contaminated both with bacteria and nitrate. Six wells contained pesticide residues above the interim maximum acceptable concentration (IMAC). One contained alachlor, one contained metolachlor, and the remainder contained more than 5 µg/L of atrazine, or the total concentration of atrazine plus deethylatrazine exceeded 5µg/L . Records -1 showed that a spill caused the one well to be contaminated with metolachlor. None of the wells tested contained detectable petroleum derivatives.”

    -Goss, M.J, Barry, D.A.J. and Rudolph, D.L.  Contamination in Ontario Farmstead Domestic Wells and its Association with Agriculture 1. Results from Drinking Water Wells. 1998.

    While this study is almost 30 years old, there are a couple of key takeaway messages here that are still valid today.  For all Ontarians that rely on private wells for their drinking water, samples should be taken for free testing through your local Health Unit for bacterial contamination.  This should be done regularly, at least once or twice per year.  Based on the study results, other contaminants are less likely to be found in your drinking water but water samples can be tested for these other potential contaminates including pesticides for a fee; see section below on “where can I send my water samples to test for pesticides”.

    What are some other sources of information about previous pesticide use on a property?

    The best source of information is likely the person who was responsible for previous pesticide management on the property; typically, this is the farmer. The farmer may be able to recall the type of pesticide products used or at least give an indication of previous cropping practices and livestock husbandry which can provide some indication to the type of products that may have been used. In addition, the farmer may be able to provide an indication where/how products were stored and mixed and application practices. But a word of caution here: some farmers might be hesitant to answer questions “out of the blue” about the past management practices with pesticides because of liability concerns. 

    In some cases, the Ministry of Environment, Conservation and Parks (MECP) may be helpful with this type of inquiry. MECP oversees the Pesticides Act in Ontario and as such they might be aware if there are any local legacy or historical issues with pesticides spills or pesticide contamination of groundwater in your area. Some lawyers involved in real estate transactions will query the local District MECP office to see if there have been any environmental orders filed related to a specific property prior to finalizing a sale. 

    What are some additional considerations when thinking about the historical use of pesticides on a property?

    Based on the information from the 1990 water well study mentioned above, pesticide contamination appears to be a rare occurrence; 6 samples out 1,290 indicated some presence of pesticide residual in the samples. If there were problems with previous management, it may relate:

    1. Improper storage of pesticides
    2. Poor techniques with the mixing or handling of pesticides
    3. Disposal of empty pesticide containers, or
    4. Equipment malfunction such as improperly closed valve on a sprayer

    Concerns related to storage or mixing and handing can help to focus in on a specific area(s) on the farm. For example, if it is known or there is a strong belief that the pesticides were stored in “the old shed” or that pesticides were routinely mixed in the sprayer while filling from the tap beside the barn and there is a well near this area, then testing of a water sample for pesticides may provide some peace of mind.

    If we test our well water for pesticides, what pesticides do we test for?

    Because there are many different chemical formulations for current and past pesticides, the lab will ask which class or type of chemicals that you want the water analyzed for. Asking for the lab to analyze for many different types of pesticides will increase the lab cost substantially. 

    Having some background on the property can be helpful here. For example, if the concern is from the 1960s and 70s and the crop rotation on the property at time was hay-cereals-corn, then a couple of the commonly used pesticides at that time were atrazine (corn) and 2,4-D (cereals). 

    While this background information may help to narrow down the focus to fewer pesticides and save money on lab analysis, it should be noted that there were multiple pesticide formulations used 50 years ago so if the testing is narrowed too much, you might miss the pesticide(s) that was actually used on the farm at that time. There is a trade-off here by narrowing down the number of pesticides and keeping lab costs lower versus an increased risk of not analyzing for right pesticide. 

    Where can I send my water samples to test for pesticides?

    There are several private labs that can analyze water samples for pesticide residues for a fee. Depending on the number of parameters (i.e. the number of pesticides) that you ask to be analyzed for will be a major factor in how much the analysis cost. 

    The Ontario Groundwater Association, the association that represents well drillers in Ontario, has a link to a water testing program called “My Water Quality” and one of its water testing packages will test for approximately 20 different pesticide residues in water. The cost for this testing package is $998 per sample at the time of writing this article in the winter of 2025.

    Some concluding thoughts

    It is understandable that rural residents relying on wells for their drinking water may be concerned about the quality of the water coming out of their taps. Bacteria contamination is the most common problem found with private well water and fortunately, you can test your private well water for free through your local health unit. 

    There is limited data on pesticide contamination of water well in Ontario and based on this limited information, it appears to be a rare problem, thankfully! However, if you are still concerned about the impacts of pesticide use and management in the past on your property, there are private laboratories that will test your water for a fee. For some people, paying the fee for this type of testing may allow them more peace-of-mind the next time that they turn on the tap.

    Appendix

    The following links will help Ontario farmers and landowners understand and manage the risk associated with current pesticide use and management on their properties. Again, for readers outside Ontario, there should be similar resources in your area.

    Ontario.ca and search “Pesticide contamination of farm water sources”

    Learn how to avoid contaminating any well or surface water source by properly mixing, loading or applying pesticides and what to do if a spill should occur. This technical information is for Ontario producers.

    Ontario.ca and search “Assessing the potential for ground water contamination on your farm”

    Learn about a risk assessment procedure to select best management practices to reduce groundwater contamination. This technical information is for Ontario producers.

    Ontario Pesticide Education Program and Grower Pesticide Safety Course

    The Ontario Pesticide Education Program supports Ontario farmers and pesticide vendors to achieve pesticide safety certification and training. Renewal is every 5 years.

  • Spraying Weather

    Spraying Weather

    It’s time to spray and what’s the first thing you do? Check the weather forecast, of course. More often than not, the suitability of the weather is the main factor in the decision to spray. Let’s have a closer look at what each weather component contributes to the decision.

    Wind:

    Everyone knows that small droplets can drift if it’s windy, and the windier, the worse it is. But that’s hardly the whole story.  Here’s how can we improve our understanding of wind and its impact.

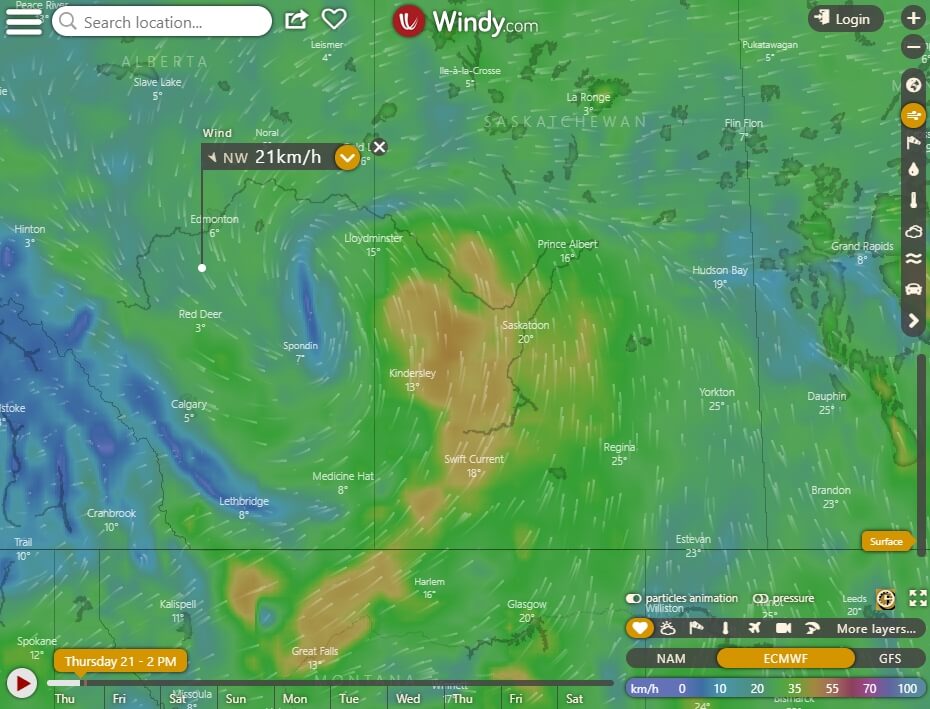
    • Look beyond the wind forecast. It’s standard practice to look a day or two ahead for wind forecasts. At any instant, the wind speed and direction may be acceptable for our planned spray job, but we know that it will change. Consider wind speed sites such as Windfinder, Ventusky, or Windy for added insight. These services show trends over time in a great visual interface, allowing users to anticipate changes in wind speed and direction for better planning. While they aren’t forecasts per se, visualizing wind patterns over a larger region allows a better understanding of what’s coming your way.
    Figure 1: Sites such as Windy.com offer powerful visualizations of current and future wind conditions.
    • Use wind as an ally. We’re conditioned to think of wind as having a negative effect on spray drift. The less the better. Yes, droplet displacement increases with wind speed. But the “negative-only” perspective is being re-evaluated in light of dangers associated with wind-free conditions that often occur during temperature inversions (see “Temperature”, below). In fact, wind provides several advantages over calm conditions:
      1. Directional certainty. We can assess the risk to downwind sensitive areas. This is not possible with calm conditions because inversion air flow may follow terrain, and as inversions dissipate, the first daily winds can be changeable and unpredictable in direction.
      2. Turbulence. Wind creates mechanical turbulence which helps sprays deposit and disperse.  Both of these effects have value. In a calm environment, such turbulent eddies don’t exist.
      3. Low drift options. If it’s windy, we have options to respond. We can lower the boom or lower the spray pressure. We can mix the next tank in higher water volume, forcing either a larger nozzle (larger flow rates of the same model nozzle usually produce coarser sprays) or slower travel speeds. All these practices reduce drift when it’s windy. In comparison, nothing (except not spraying) can be done to reduce risk during inversion conditions. This is because even low-drift spray contain enough fine droplets to cause damage if they linger.
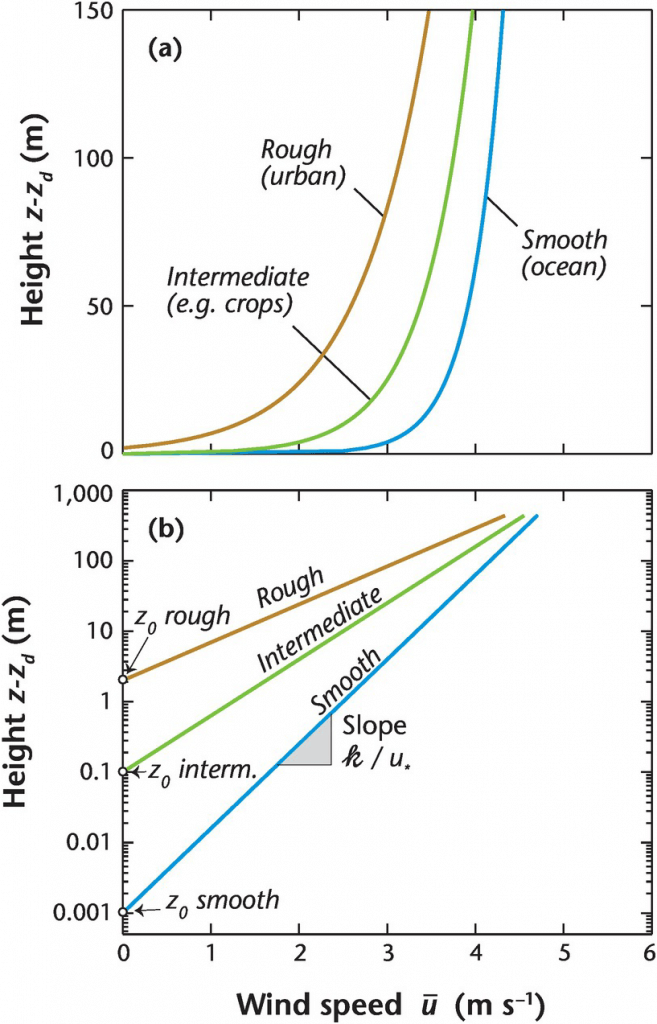
    • Know your wind speed. The international standard for wind speed measurement is 10 m above ground level. When 25 km/h wind speeds are reported, they are at 10 m, not the 1 m height where the boom is located. Within the surface boundary layer, the part of the atmosphere closest to the ground, wind speeds typically increase linearly with the natural log of the height above the canopy. The slope of that line depends on atmospheric stability and roughness length. Very close to the ground, the wind speed reaches zero, and that height is a function of the roughness of the surrounding terrain.

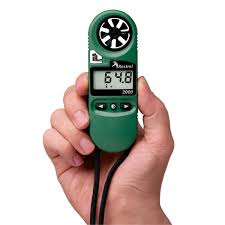
      As a rule of thumb, over a short crop canopy, expect the wind speed at 1 m above ground to be about 0.67x of the speed at 10 m. So if the weather reports 25 km/h, the actual wind speed at boom height is closer to 17 km/h. Remember that weather stations can be far away, and local conditions will vary. Always measure your local wind speed and direction with your own weather station or handheld device, and keep a record.
    Figure 2: Relationship of wind speed and height, for three roughness conditions (Source: Oke et al, 2017)
    Figure 3: Hand-held wind meters or weather stations are an essential part of a spray operation and record keeping.

    Wind and Mode of Action. Coarser sprays are a common way to reduce drift in windy conditions. But some modes of action aren’t well suited to coarser sprays. We can schedule our spray jobs throughout the day to correspond to spray quality tolerance. Apply the products that require the finest sprays (contact products, grassy herbicides, insecticides) when conditions are best, and save the sprays that tolerate the coarser sprays (systemic products, broadleaf targets) for less certain conditions later in the day. Or treat the fields whose downwind edges border a sensitive crop during better conditions. Here’s a rough guide to spray quality and herbicide mode of action.

    Temperature

    Like wind, air temperature is more complex than it appears at first sight. Here are some other aspects to consider:

    • Understand temperature inversions. Temperature matters. But perhaps the most important aspect of temperature when it comes to spraying isn’t the temperature per se, but how it changes with height. The temperature change with height is used to identify dangerous temperature inversions.

      Here’s how temperature profiles work (for a quick Sprayers101 overview, here, for the best in-depth explanation (NDSU), here): Due to atmospheric pressure, there is always a slight temperature decrease with height, about 1 ºC per 100 m (the dry adiabatic lapse rate). This temperature profile describes a “neutral” atmosphere, i.e., no thermal effects.

      When it’s sunny, solar radiation heats the earth, which in turn warms the air near it. As a result, the rate of cooling with height is greater than the adiabatic lapse rate, and we have “unstable” conditions that are characterized by thermal turbulence (warm air rising, cold air falling) that actively mixes air parcels. Thermal turbulence is very good at dispersing anything in the air, including spray droplets.

      When solar radiation is low or absent, the earth cools and this mostly affects the air near it. As a result, air temperature rises with height, and the daytime temperature / height profile is inverted. Air parcels no longer move up or down, in fact they return to their original location if displaced. This results in a “stable” atmosphere, also called an inversion.

      Inversions are dangerous because they are associated with very low dispersion, and a spray cloud will remain concentrated and may linger over the ground for a long time, like ground fog.

      Most weather services do not actively measure inversions. Instead, their presence has to be inferred by clues. For example, inversions:
      (a) occur primarily when solar radiation is low, from early evening, overnight, to early morning;
      (b) are more likely on clear nights, when soils cool more;
      (c) can be seen when ground fog is present, or when dust hangs, moving slowly;
      (d) are associated with low ground temperatures that also cause dew. 

    Recent findings about inversion in Missouri were summed up in this excellent webinar by Dr. Mandy Bish, Extension Weed Specialist at the University of Missouri. Her studies showed that inversions can begin hours before sunset, their presence and duration are dependent on local conditions such as topography and windbreaks, and recognition of telltale signs of inversions such as lack of windspeed are important for accurate local assessments.

    Figure 4: Morning ground fog in Australia (picture provided to author).
    • Use Mesonets if you have them. Mesonets are networks of weather stations, and they can add valuable information. For example, North Dakota has an extensive network of about 130 weather stations that, among other things, measures and reports temperature inversions. NDAWN (ndawn.ndsu.nodak.edu) reports temperatures at 3 m and 1 m, and issues warnings of temperature inversions as they develop at a specific location. NDAWN information is available as an app. North Dakota isn’t the only place to have a public mesonet, check to see what’s available in your area. The added information is worth subscribing to.
    • Know the volatility of the product. Some pesticide active ingredients are volatile. This means they can evaporate from a wet or dry deposit during and after application (more here). Dicamba is a prominent example, but there are others, like trifluralin and ethalfluralin, 2,4-D and MCPA ester, and clomazone. Formulation can affect volatility, and the use of lower volatile esters of 2,4-D and better salts of dicamba have helped. Microencapsulation has been used to reduce the problem with clomazone. Volatility is strongly affected by surface temperature, and volatile products should not be sprayed on hot days or when the forecast calls for hot days following application. Volatile products have been found to evaporate from dry deposits for several days after application, and their vapours move under inversion conditions, causing widespread damage.

    Sun

    The sun plays a large role in spraying. Plants’ active growth improves herbicide translocation as well as activity in the photosystem, or in amino acid or fatty acid synthesis. The activity of herbicides has been shown to improve under sunny conditions for that reason.

    Some herbicides, most notably diquat (Reglone), work too quickly when it’s sunny, and improved performance can be gained by spraying under cloudy or low-light conditions. The lack of photosynthesis allows for some passive translocation before the product causes tissue necrosis.

    Sunny conditions also increase thermal turbulence we mentioned earlier, which is useful for burning off morning inversions. But what usually follows a sunny day is a strong inversion as the sun sets and the clear sky facilitates the earth’s rapid cooling. It would be possible to spray a bit later into the evening when it’s cloudy.

    Humidity

    Since about 99% of the spray volume is comprised of water, evaporation of this water can have strong effects on droplet behaviour. Droplets begin to evaporate as soon as they leave the nozzle, becoming smaller and more drift-prone while still in flight. Higher booms and finer sprays increase the flight-time of droplets, and this increases the sensitivity to evaporation.

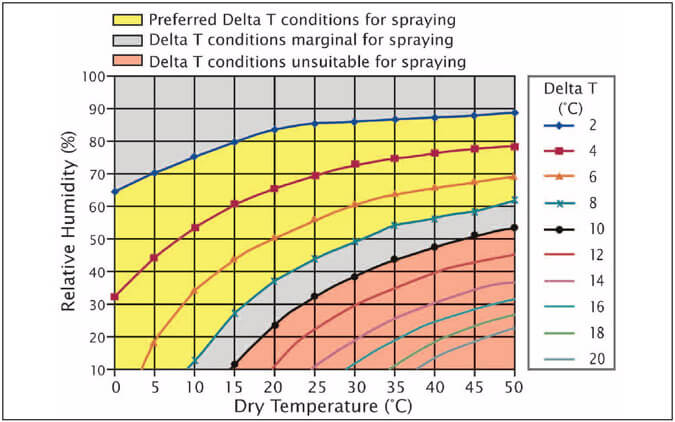
    The most common measure of water in air is relative humidity (RH). RH doesn’t tell the whole story, though, because the same RH at different temperatures results in two different rates of water evaporation. A better measure is wet bulb depression. Wet bulb depression is defines as the difference in temperature reported by a dry bulb vs. a wet bulb thermometer. Wet bulb depression has more recently been coined as “Delta T” in Australia. The Delta T value is directly related to water evaporation, and charts have been published showing acceptable values for spraying. A Delta T of >10 ºC is considered too high.

    Figure 5: Delta T, also known as wet bulb depression, provides an indication of water evaporation rate.

    After they deposit on a leaf, droplets can evaporate to dryness within seconds, and a dry atmosphere can result in rapid drying that reduces herbicide uptake. In one study, a Group 2 herbicide was applied to weeds in a normal sized spray, and also as a fine mist, both under very dry conditions. The normal spray showed the expected herbicide efficacy. The finely misted herbicide had no effect on the weeds, likely because the rapid drying prevented uptake. Interestingly, the product began to work again when the plants were later placed in a humid environment.

    High humidity can also work against an application. Since humidity is often high during temperature inversions, droplets remain potent while they linger and drift over sensitive terrain. It would be better if they had evaporated and lost their effectiveness.

    Some proponents of low water volumes and fine sprays have suggested oily formulations or adjuvants prevent evaporation. While this may slow evaporation, it also creates a dangerous condition in which many small droplets remain aloft and liquid for a long time, with high activity on any target they may encounter. The bottom line: Don’t spray low volumes with oily adjuvants.

    The Perfect Day

    We know that the ideal spray day is sunny, starts a few hours after sunrise once the dew has mostly burned off, and has consistent winds away from sensitive areas. Spraying should end well before before sunset, before calm conditions signal the onset of the inversion.

    But what to do when that day never happens? All too often, high winds persist day after day, and night spraying is the only alternative. In that case, do what you can to minimize potential damage. Survey downwind areas. Choose cloudy skies that suppress inversions. Incoming weather systems are usually associated with consistent winds, and these may reduce inversion risk. If drift is a possibility, apply more water and use the coarser nozzles at your disposal to minimize it. Any investments made to boost productivity will pay dividends, allowing you to get a greater proportion of your work done when conditions are better.

    Additional Resource

    If you want an excellent resource for spray weather best practices, grab a free copy of Graeme Tepper’s “Weather Essentials for Pesticide Application” published by Australia’s GRDC.

  • Spray and Soil Fumigant Buffer Zones in Canada

    Spray and Soil Fumigant Buffer Zones in Canada

    Spray buffer zones are no-spray areas required at the time of application between the area being treated and the closest downwind edge of a sensitive terrestrial or aquatic habitat. Spray buffer zones reduce the amount of spray drift that enters downwind, non-target areas.

    Sensitive Terrestrial Habitats

    Sensitive terrestrial habitats can include hedgerows, grasslands, shelterbelts, windbreaks, forested areas and woodlots. Crops and private properties adjacent to treated areas are not considered to be sensitive terrestrial habitats and do not require spray buffer zones. However, labelled spray buffer zones are a good indicator of potential damage to adjacent vegetation. Applicators are responsible for ensuring their spraying programs do not adversely affect neighbouring properties.

    Sensitive Aquatic Habitats

    Sensitive aquatic habitats can include lakes, rivers, streams (channelized or natural), creeks, reservoirs, marshes, wetlands and ponds. Temporary bodies of water resulting from flooding or drainage to low-lying areas are not considered sensitive aquatic habitats. Nor are aquatic drainage ditches or seasonal water courses that are dry at the time of application. Water body depth will determine the buffer zone distance, as indicated on the pesticide label. Downslope open water may also require a vegetative filter strip .

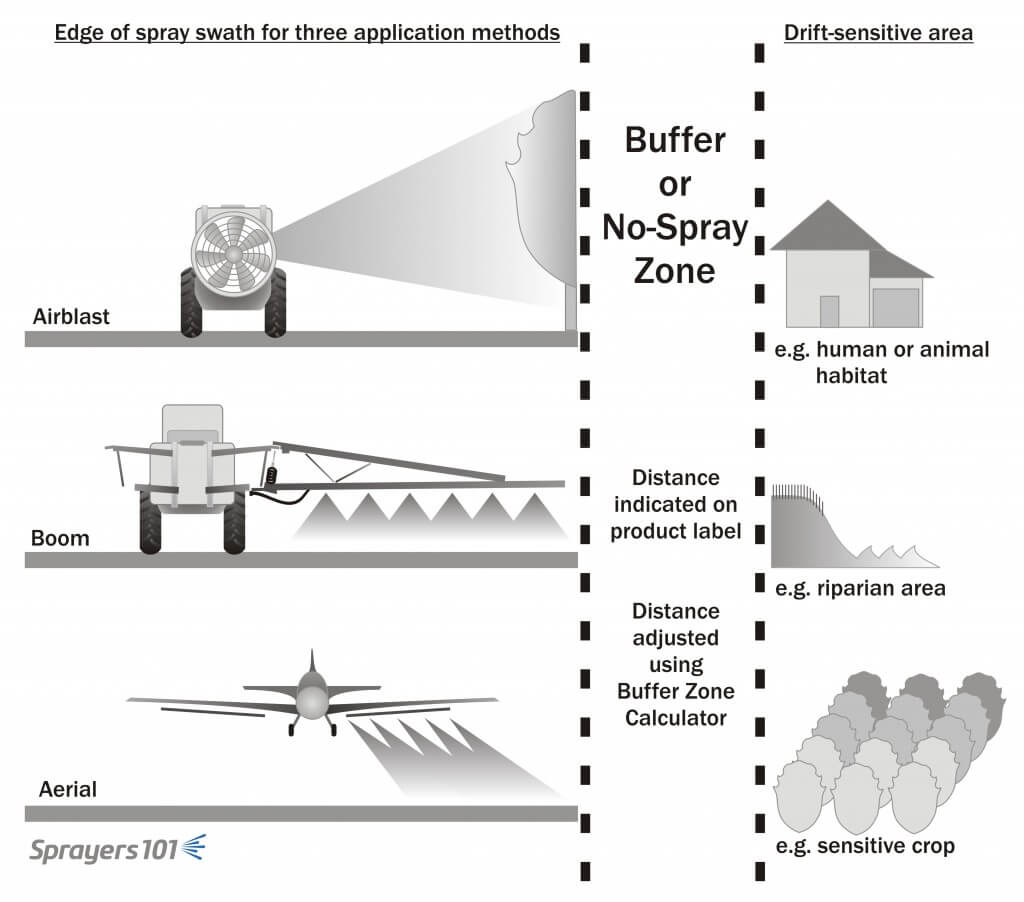
    The pesticide label will indicate when a spray buffer zone is required. The distance will depend on the product used, the method of application and the crop being sprayed. In some cases, the buffer zone may be modified using Health Canada’s Spray Buffer Zone Calculator . When provincial and label restrictions differ, or label restrictions differ between tank mix partners, use the greatest distance.

    Buffer zones or No-Spray zones physically separate the end of the spray swath for the nearest downwind sensitive area.
    Buffer zones or No-Spray zones physically separate the end of the spray swath for the nearest downwind sensitive area.

    Spray Buffer Zone Calculator

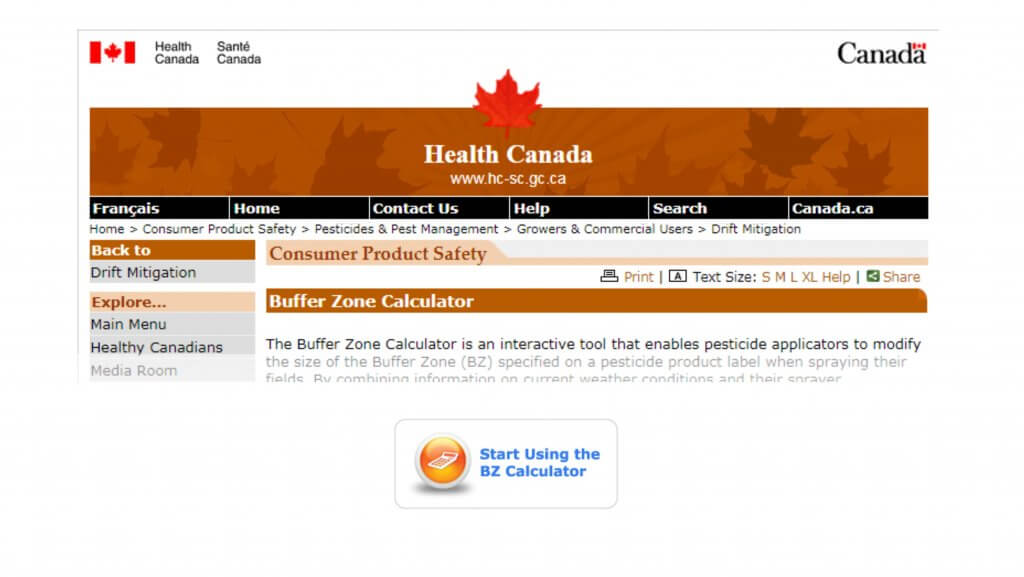
    Unless forbidden by the pesticide label, Health Canada’s Spray Buffer Zone Calculator may permit applicators to reduce the size of the spray buffer zone specified on a pesticide label. To be eligible, the product label must specify a field or aerial spray quality coarser than “Very Fine” and finer than “Very Coarse”. All airblast spray qualities are applicable.

    Modifications are based on meteorological conditions, sprayer configuration and the application method at the time of application. If modified spray buffer zone distances are less than provincial or municipal distances, use the greater distance.

    Applicators that choose to use the calculator must retain a copy of the summary page for at least one year following the application to demonstrate compliance with label directions.

    Vegetative Filter Strips

    A vegetative filter strip is a permanently vegetated strip of land that sits between an agricultural field and downslope surface waters. Vegetative filter strips reduce the amount of pesticide entering surface waters from runoff by slowing runoff water and filtering out pesticides carried with the runoff.

    Pesticide labels may require a vegetative filter strip, or recommend one, as a best management practice. They must be at least 10 metres wide from edge of field to the surface water body and be composed primarily, but not exclusively, of grasses.

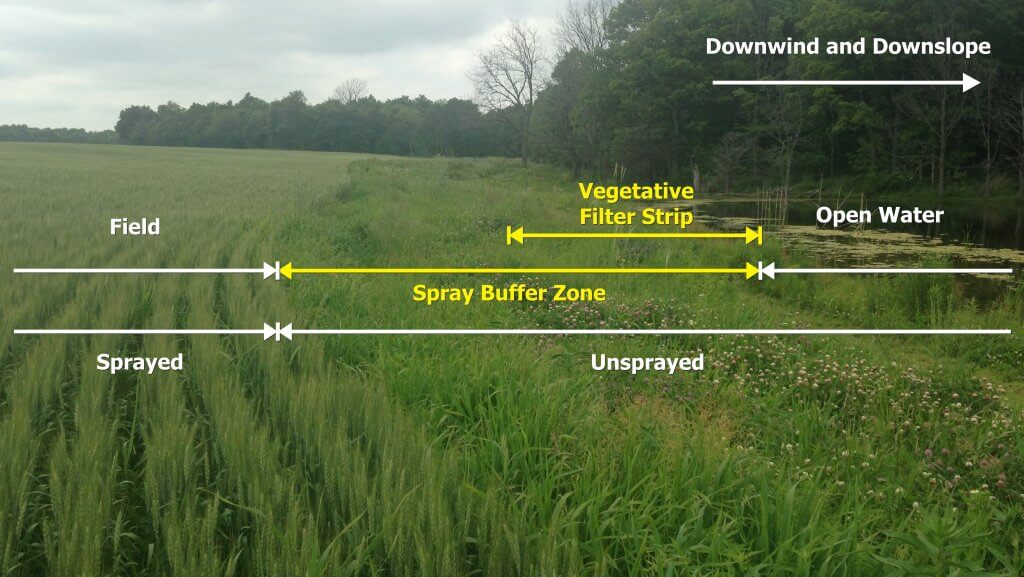
    Spray buffer zones do not apply to vegetative filter strips unless there is a pre-existing sensitive terrestrial habitat within them. Therefore, vegetative filter strips may overlap spray buffer zones when open water is both downslope and downwind (see illustration). In this case, the minimum 10 metres vegetative filter strip distance must be observed, but the set-back can be larger based on spray buffer zone, provincial or municipal restrictions.

    Soil Fumigant Buffer Zones

    Soil Fumigant Buffer Zones are mandatory, untreated perimeters surrounding the treated field. They limit user exposure and increase the protection of workers, bystanders and the environment. The distance will depend on the application method, product rate and field size, as indicated on the pesticide label. An Emergency Response Plan is required when residences or businesses are located within 90 metres of the buffer zone perimeter.

    Soil fumigant buffer zones have a time component. This Buffer Zone Period begins at the start of the application and ends a minimum 48 hours following the application. Respiratory protection and stop-work triggers, as specified on the pesticide label, will apply to anyone present in the buffer zone area during the buffer zone period.

    Buildings and residential areas within the soil fumigant buffer zone must be unoccupied during this period. Unless in transit, non-handlers (including field workers) must be excluded from the soil fumigant buffer zone during this period. Entry is permitted for fumigant handlers with appropriate certification, emergency personnel and local, provincial, or federal officials performing inspection, sampling, or other similar duties.

    Image from www.onspecialitycrops.ca

    Soil fumigant buffer zone signage must be posted within 24 hours prior to the application and remain posted until the buffer zone period expires. Signage must include, but is not limited to, the date and time the buffer zone period ends and the name, address, and telephone number of the applicator. Soil fumigant buffer zone signage must be located at the outer perimeter of the buffer zone, at all entrances to the field, and along likely routes where people not under the owner’s control may approach. Soil fumigant buffer zone signs are in addition to, and do not replace, fumigant application block signage .

    Applicators must develop a written Fumigation Management Plan prior to the start of any application. The plan outlines key steps to ensure a safe and effective fumigation, including site conditions, buffer zones and emergency response planning. Both the owner/operator of the fumigated area and the fumigant applicator must retain signed fumigant management plans as well as a summary of Post-Application Procedures for two years following the application.