Category: Coverage

All hort articles about achieving, confirming or correcting for spray coverage.

  • Wanted: A New Technology for Assessing Spray Coverage – The Spray Doctor

    Wanted: A New Technology for Assessing Spray Coverage – The Spray Doctor

    “If you can’t measure it, you can’t improve it”. While the source is nebulous (Peter Drucker, Lord Kelvin, or Antoine-Augustin Cournot), the sentiment is clear.

    The status quo

    In the world of crop protection, considerable resources are expended to distribute a pesticide over a target. And yet, sprayer operational settings and spray coverage are rarely assessed. As a result, too much time elapses between the application and observing the biological results to evaluate and correct equipment performance. The damage (be it waste or an inconsistent and sub-lethal dose) is done. All sprayer operators know this to be true, so why do precious few perform these assessments?

    Perhaps, dear reader, you have personal experience assessing coverage and already know the answer. Perhaps you’ve performed the iterative dance that is placing, spraying, retrieving, assessing and re-placing water sensitive paper (WSP). Perhaps you’ve sprayed fluorescent tracers and hunted for faint glows at twilight using UV lights. Perhaps you’ve looked for residue from diatomaceous earth or fungicides. Or, perhaps, you’ve trusted in the falsely-comforting “shoulder check” and assumed dripping must mean you’ve hit the target.

    Existing methods are complicated, subjective, messy and time-consuming. We need an alternative.

    The alternative

    Consider a permanent, solar-powered sensor that supplies real-time spray coverage data to your smartphone via a cellular connection. The output could be visualised in a simple and intuitive way, and immediately available to both sprayer operators and farm managers. If the sensor was relatively inexpensive, sufficiently hardy, and easy to deploy, its utility would only be limited by your imagination:

    • Stakeholders could confirm the correct functioning of their equipment before committing to the application. Decisions could be made to change operational settings, repair equipment, or delay until conditions improved.
    • The sensors would provide coverage data specific to their location and orientation. Units could be installed in difficult-to-spray regions such as treetops, or canopy-centres, or fruiting zones. Sensors could be placed where pest/disease pressure has been historically high, or where wind is a known issue.
    • Large operations could install them in a test-row, where sprayer operators would perform a gauntlet-style calibration run prior to a day of spraying.
    • Spray records could inform compliance audits, supplement insurance or CanadaGAP traceability requirements, or be used in agronomic assessments.

    In 2025 I was approached by an Australian developer who claimed he had a device that did all of this. And, if that weren’t enough, it could also monitor certain meteorological factors such as pre-spray moisture levels and temperature and report post-spray evaporation rates. I could barely contain my excitement. A prototype was in my hands a few weeks later.

    Prototype, 8-sided sensor located in a blueberry bush.
    Solar panel powering three, 8-sided prototype sensors spanning 10 meters of highbush blueberry.

    Benchmarking the sensor

    The Spray Doctor (working name for the prototype) started its life as a leaf wetness sensor, evolving into a spray coverage sensor piloted in 2023/24 in Australian and New Zealand grape production. The history of earlier iterations and company schisms is convoluted, and fortunately immaterial to our purposes. All I needed to know was that we weren’t starting from scratch. Several of the questions regarding how accurately the surface could detect spray deposition were already addressed by independent research.

    The sensing surface is impregnated with an array of capacitive wetness sensors. The sensor responds to the surface area covered and not deposit density. Researchers reported a reliable response range between ~10% and 50% surface coverage. Given the arguable “ideal” coverage standard of 10-15% surface area, this includes the range of interest for most sprays.

    Benchmarking against WSP was part of the foundational assessment. A droplet of water deposited on WSP produces a high angle of contact and very little spread, while the same droplet deposited on plant tissue tends to produce a lower angle of contact and more spread. This means the stain produced on WSP is smaller than would be produced on plant tissue, depending on how smooth, vertical or waxy the tissue surface was.

    It was therefore surprising that WSP were found to report a higher degree of spray coverage during water-only sprays than the sensor. It seemed droplets more easily coalesced and ran off the sensor surface. This was ultimately interpreted as an advantage, because the sensor would better emulate how a leaf surface would respond to the influence of surfactants and spray quality.

    Adding a surfactant to a spray solution improves droplet adherence, and/or reduces surface tension, improving the degree of contact on plant surfaces. Likewise, it was found that surfactants increased the degree of coverage reported by the sensor, and when actual chemistry was sprayed (e.g. sulphur powder or copper sulfate) there was an effect on the degree of coverage reported. This is unlike WSP, where adjuvants and chemistry do little to increase the spread.

    And so, like every method for assessing spray coverage, the sensor has limitations and caveats. If you have some doubt as to the sensor’s accuracy, do not get distracted by the fine detail. Remember, most operators currently have no feedback whatsoever; even a binary response (e.g. hit or miss) would be welcome. The sensor is sufficiently sensitive and consistent to resolve coverage in a range relevant to most sprays, and therefore worth field testing.

    The experiment

    My role in this story was to work with a grower to evaluate the sensor’s ability to report coverage information in a clear and actionable way. There were three questions:

    • Does data from the sensor influence a sprayer operator’s behaviour?
    • Does that change in behaviour lead to improved spray coverage (implying more efficient and effective crop protection).
    • Could we “dial in” the hardware and the interface based on the grower’s feedback?

    In part two, we share our experience installing and using the Spray Doctor, as well as supply answers to these questions. Stay tuned.

    Thanks to Brandon Falcon (Falcon Blueberries) for volunteering his time and farm for this evaluation, and the developer for the in kind donation of the prototype Spray Doctor.

  • Crop-Adapted Spraying in Highbush Blueberry: Nine years of pesticide savings

    Crop-Adapted Spraying in Highbush Blueberry: Nine years of pesticide savings

    This case study is taking place on a 15 acre highbush blueberry operation in southern Ontario. In 2016, considerable pressure from spotted-wing drosophila (SWD) prompted the growers to make changes to their crop management practices and their spray program. They employed a three-pronged approach to improving crop protection:

    1. Significant changes to canopy management and picking / culling practices
    2. Investing in a new sprayer
    3. Adopting the Crop-Adapted Spraying (CAS) method of dose expression

    We have been tracking pesticide use, water use and yield compared to historic values. We also monitored spotted-wing drosophila catches both in crop and in wild hosts along the border of the operation for three years.

    Canopy Management

    In 2016 the operation made the following changes to their canopy management practices:

    • They performed their first-ever heavy pruning and planned to to maintain an ideal crop density by removing ~30% plant material annually. This more-or-less took place.
    • They regularly collected and buried culled and dropped berries.
    • They picked cleanly and more frequently.
    Heavy pruning in 2016.
    Most years, bushes were pruned ~30% to maintain an ideal size and shape.
    Pickers were educated in how to pick cleanly and dropped / culled fruit was collected and buried.

    There were initial concerns that such dramatic pruning would reduce production per acre and require trellising to prevent berries weighing down the smaller bushes. However, in 2017 (and thereafter) they found that the quality of the berries was greatly improved and noted fewer hours spent culling berries during packing. Financially, the growers felt they came out ahead.

    Application Technology

    In 2018 they replaced their old, inefficient KWH sprayer with a low profile axial with conventional hydraulic nozzles to permit greater control of the spray. The KWH design was intended for standard fruit trees. It produced >100 mph air and an Extremely Fine spray quality and was therefore a bad fit with the planting architecture and canopy morphology of highbush blueberry.

    They considered a cannon-style sprayer hoping to spray multiple rows in a single pass but given the desire for improved coverage and reduced waste, they elected to drive every row using a low-profile axial.

    Fore: An old KWH air shear sprayer. Rear: Low profile axial sprayer with conventional hydraulic nozzles.

    The new sprayer was more reliable, quieter, and more fuel efficient. Further, the old sprayer leaked and the air-shear nozzles did not respond when shut down at the end of rows. Eliminating these sources of waste represented a savings of ~20% of the spray volume traditionally used per acre.

    Crop-Adapted Spraying

    The redundancy inherent to product label rates for three-dimensional perennial crops has long been recognized. In response, rate adjustment (or dose expression) methods have been developed to improve the fit between rate and canopy coverage (e.g. Tree-Row Volume, PACE+, DOSAVIÑA). Each has value, but their adoption has been slow because they are region- or crop-specific and they can sometimes be quite complicated.

    CAS lends structure and repeatably to the informal rate adjustment methods already used to spray three-dimensional perennial crops (e.g. Making pro rata changes by engaging/disengaging nozzles in response to canopy height or altering travel speed in response to canopy density).

    The CAS method relies on the use of water sensitive paper to confirm a minimal coverage threshold of 85 deposits per cm2 as well as 10-15% area covered throughout a minimum of 80% of the canopy. Using this protocol, we calibrated air energy and direction, travel speed and liquid flow distribution. This process is covered in detail here and in the new edition of Airblast101. In that first year we reassessed coverage every few weeks between April and June using water-sensitive paper.

    Spray volume / Pesticide

    By matching the sprayer calibration to a well-managed canopy, the growers were able to go from ~1,000 L/ha to ~400 L/ha of spray mix. The ratio of formulated product-to-carrier remained the same, but less spray was warranted per acre. Stated differently, the grower mixed the spray tanks per usual, but drove further on a tank.

    This also saved an estimated 15 hours of filling/spraying time per year, which translates to reduced operator fatigue and exposure as well as reduced manhours and equipment hours.

    The decision of what and when to apply was at the growers’ discretion. Chemistry was rotated and applications were made according to IPM in early morning (if there were no active pollinators) to avoid potential drift due to thermal inversions. The following image shows what those papers looked like in June of the first year.

    Example of water sensitive paper coverage on a windy day (worst case scenario) in June, 2018.

    Note how little spray escapes the target rows in the following video. The wind was too high for spraying, but we were only using water and saw it as an opportunity to test a worst-case scenario. Air-induction hollow cones were used in the top nozzle position on each side so droplets were large enough to fall back to ground if they missed the top of the canopies.

    SWD monitoring

    SWD represents a serious economic threat to blueberry operations. Traps were placed in the operation (three in the crop and one in an unmanaged wild host along a treeline) and monitored weekly. Traps were also placed in surrounding horticultural operations which were employing standard pest control practices. This not only provided regional information about SWD activity but allowed us to compare the level of SWD control from the Crop-Adapted Spraying approach.

    • In 2018 the comparison included up to 16 other sites that were berry and tender fruit.
    • In 2019 the comparison included 10-12 sites (depending on the week) and they were berry and tender fruit sites.
    • In 2020 the comparison included 4 other sites (blueberries, raspberries and cherries).

    2020 & 2021 – Covid 19 and Heavy Rain

    In agriculture, every year is an adventure, but 2020 and 2021 were exceptionally difficult and the circumstances should be considered when deciphering the results. Covid-19 has had a significant impact on global agriculture.

    In 2020, fearing a reduction in the availability of seasonal labour, the operation pruned their bushes heavily. This was done to reduce the yield in order to make harvest manageable.

    In 2021, labour was once again secure. Given the heavy pruning the year previously there was no need to prune again, so the crops densified. This coincided with abnormally high levels of precipitation to create significant anthracnose issues. Additional fungicide applications took place that raised costs, but the grower maintained CAS-optimized rates and sprayer settings.

    Quantitative Results

    Prior to replacing their sprayer, and adopting CAS, the operation sprayed about 78,260 L/yr. Their average savings in spray volume (water) has been 54,720 L/yr, or 70%.

    In terms of pesticide savings, we compare each year to the 2017 baseline. In order to make for a fair comparison, we update pesticide prices each year using current costs. Therefore, the 2017 total has increased by about $2,600.00 (wow). Their average savings represents $5,575.00 CAD/yr or 62.5%.

    Yield is more difficult to interpret due to mitigating circumstances in 2019 and 2020:

    • In 2016, prior to any changes, they harvested 12,076 flats (about 9lb of fruit each).
    • In 2017, following the canopy management changes, harvest increased to 18,335 flats (~50% increase).
    • In 2018, using CAS, harvest was essentially unchanged compared to 2017, which was excellent.
    • In 2019, harvest started a month late compared to previous years. Further, blueberry prices were low, and the operation elected to stop harvesting a month early. However, when those issues are factored in, the harvest was comparable.
    • 2020 was particularly challenging for agriculture and with the possibility of reduced labour due to the pandemic, the operation elected to prune heavily and reduce their yield.
    • 2021 saw unpruned bushes (following the heavy pruning in 2020) and abnormally high levels or precipitation which created anthracnose issues. As a result, more applications were made than any other year on record, but maintained the CAS-optimized rates and sprayer settings.
    • 2022 was (thankfully) fairly typical. Low SWD, average anthracnose and no drama.
    • 2023 was very much like 2022 with low SWD, average anthracnose and no drama.
    • 2024 saw a LOT of rain. The season started and ended early, but yields were par. “Pivot” replaced “Tilt”.
    • 2025 was pretty average all things considered. No drama whatsoever. “Inspire-Super” was added to product list.

    Trap counts for SWD were only performed during three years of the CAS study, so we are only able to present 2018-2020 data. It should also be noted that while the presence of SWD in an operation represents an impact on yield, there is not necessarily a correlation between the number of SWD captured the amount of damage.

    In 2018 and 2020, average counts were higher in the surrounding operations employing standard practices (STD) compared to the CAS trial. In 2019, average counts were higher in the CAS trial. When total average counts are compared, the difference is negligible. Berries were tested regularly by the growers and the damage due to SWD was within acceptable limits. It should also be noted growers monitored and reported satisfactory disease control throughout the study.

    We have not applied any statistical rigor, but the trend suggests that the level of control provided by the CAS method was comparable to conventional methods. This conforms with our previous results in Ontario apple orchards and similar evaluations of optimized application methods world wide.

    Qualitative results

    Beyond the quantifiable results, the growers reported qualitative benefits:

    • Customers of the U-pick portion of the operation regularly enquire about pesticides. The operation’s reduction in pesticide use became a positive speaking point and aligned with the grower’s philosophy about reduced environmental pesticide loads.
    • While many blueberry growers experienced a market shortage of certain fungicides in 2018, this operation returned unused product to the distributor.
    • Growers reported less early-season disease damage, which saved considerable time on the packing line because there was less fruit to cull. Disease levels rose to typical levels later in the season, but there was still a net savings in labour.

    Conclusion

    The success enjoyed in this berry operation was a result of several canopy management and crop protection changes. This is a situation where the whole equaled more than the sum of its parts – it could only be achieved by making holistic changes to the operation. At the end of three years the growers themselves stated:

    “Based on my experience losing multiple crops to SWD, I can say with absolute certainty it works. <The results are> superior to what I expected. What we are doing is successful.”

    Here’s a narrated PowerPoint presentation of this study (includes data up to 2020):

    The monitoring portion of this project was funded by Niagara Peninsula Fruit and Vegetable Growers Association, Ontario Grape and Wine Research and Ontario Tender Fruit Growers in collaboration with private consultants.

  • Alternate Row Spraying

    Alternate Row Spraying

    Alternate Row (aka Alternate Row Middle [ARM]) spraying is an application method where the air-assist sprayer does not pass down every alley during an application. The sprayer operator is relying on the spray to pass through one or more rows and provide acceptable coverage to the entire canopy (or canopies) on a single pass.

    Some state agencies promote this spraying strategy to various degrees, and many sprayer operators (whether they admit it or not) have used this method of spraying. I have advised it myself for very young and/or very sparse vineyard and orchard plantings, but never without confirming coverage. When I tell operators that I have serious reservations about alternate row spraying, they defend it. Here are the most common justifications I’ve heard over the years, and my response:

    JustificationReply
    “I do not have enough spray capacity to spray every row when time is short.”You need more sprayer capacity. Get another sprayer so you can get spray on in time or invest in a multi-row sprayer is possible.
    “ARM spraying saves money and reduces environmental impact because I use less pesticide.”Technically, if you travel every second row with a sprayer calibrated to travel every row, you have indiscriminately reduced your carrier and chemical inputs by half (or more). Without close monitoring you may compromise your efficacy.
    “I only perform ARM spraying early in the season when canopies are empty, or only on young plantings.”I grudgingly grant this one as long as coverage is closely monitored. I’ve prescribed it myself in young or sparse plantings where I couldn’t get the sprayer output low enough to prevent drenching the targets.
    “The spray plume in the alley beyond the target row must mean the spray is providing adequate coverage. More is better!”If the spray is blowing through the canopy, it isn’t landing in the canopy. Further, if the air speed/volume is too high, droplets can ‘slipstream’ past the target without impinging on them. I’ve removed water-sensitive paper from canopies with barely any spray on them despite the plume in the downwind alleys. It looks like a magic trick, albeit an unhappy one.
    “Uncooperative weather doesn’t always leave me enough time to spray the entire crop, and it is the lesser of two evils to spray alternate rows than not at all. I’ll make sure I come back to spray the other rows later.”Choosing to do half a job requires an understanding of the products’ mode of action. If you are spraying an insect at a particular stage of development, there’s no “coming back later” to get that generation – if you missed, your window has closed. If it’s a protective fungicide that offers no kick-back, then once the disease has infected tissue, the damage is done. Get the spray on as best you can, but if it washes away before it has a chance to dry sufficiently, be prepared to reapply at the earliest opportunity as long as the label allows it.
    “ARM has always worked in the past.”Would you mind picking my lotto numbers for me? You’re a very lucky person!

    My reservations about ARM spraying come from published research and personal experience that show that coverage is almost always compromised when spraying from one side of a canopy. The spray must pass through the canopy to reach the far side, and the canopy filters droplets from the air as it passes through. This reduces the number of droplets available to cover the far side. In addition, high velocity spray will create “shadows” where any targets on the immediate far side of a leaf or branch become shielded and receive little if any coverage. Further still, fine droplets slow quickly as they leave the nozzle and take a long time to settle. As the entraining air slows and becomes erratic, the droplets float and change course, making their behaviour hard to predict.

    The cumulative impact can be seen in this infographic I built in 2016. The orchardist was a dyed-in-the-wool ARM applicator and he was resistant to driving every row because it took so much time. I wanted to show that he could claw back some of the lost time by spraying less pesticide every row versus his current volume every second row. He would need fewer refills, and save a LOT of unnecessary pesticide. The water sensitive paper does the talking, and while I’d like to think I’ve convinced him, I’ll bet he’s still out there dicing with fate.

    2016_ARM

    A very popular argument in favour of ARM spraying comes from orchardists that are shifting from semi dwarf to high-density plantings. They ask “How it is different to spray a four foot diameter tree from one side compared to an eight foot diameter tree from both sides”? 

    Well, we know coverage is reduced as a factor of distance. Spraying from one side gives a single opportunity to cover the middle and far side of a canopy, whereas spraying from both sides provides an opportunity for an overlap in coverage. Essentially, the centre of a canopy receives the cumulative benefit of two sprays. Coverage is therefore always improved when spraying from both sides, period.

    Spraying from one side gives a single opportunity to cover the far side of a canopy. However, spraying from both sides provides an opportunity for an overlap in coverage. In other words, the centre of a canopy receives less spray than the outside, but is essentially sprayed twice resulting in a compounding effect.
    Spraying from one side gives a single opportunity to cover the far side of a canopy. However, spraying from both sides provides an opportunity for an overlap in coverage. In other words, the centre of a canopy receives less spray than the outside, but is essentially sprayed twice resulting in a compounding effect.

    Why, then, do some sprayer operators claim that alternate row applications work? Because sometimes, they do! Just because coverage is reduced doesn’t mean it isn’t sufficient to protect the crop. It simply means that the potential for poor coverage and reduced dose is dramatically increased by alternate row applications. A sprayer operator might perform alternate applications successfully for years before conditions conspire to defeat the application: unfavourable wind, poor timing, increased pest pressure, poor pruning practices, excessive ground speed, high temperatures, low humidity, insufficient spray volume, and several other factors might occur simultaneously and reduce coverage below a minimal threshold for control. This confluence of bad luck may not happen the first year, or the second, but eventually…

    Product failure isn’t the only concern. Repeated reduced dosages may play a role in developing resistance. In those situations where the operator recognizes insufficient coverage, they may have to spray more often to compensate, negating any savings in time or product. Reduced dosage is a common error when a sprayer operator elects to use ARM.

    If you still aren’t convinced, at least perform alternate row spraying the “right” way. Here are three situations that I’ve heard operators refer to as alternate row spraying. Situation 1 is most common, but to my mind only Situation 2 would be considered acceptable. Even then, confirming coverage is a must.

    Situation 1:

    The sprayer has a typical calibration for spraying every row, but only drives alternate rows. The first application (solid line) covers different rows from the second application (broken line). The operator will claim to spray more frequently, but generally does not perform the second application unless there is high pest pressure. The result is half-a-dose per hectare per application.

    The sprayer has a typical calibration for spraying every row, but only drives alternate rows. The first application (solid line) covers different rows from the second application (broken line). The operator will claim to spray more frequently, but generally does not perform the second application unless there is high pest pressure. The result is half-a-dose per hectare per application.
    The sprayer has a typical calibration for spraying every row, but only drives alternate rows. The first application (solid line) covers different rows from the second application (broken line). The operator will claim to spray more frequently, but generally does not perform the second application unless there is high pest pressure. The result is half-a-dose per hectare per application.

    Situation 2:

    The sprayer is calibrated for double output compared to a typical every-row situation, and the operator drives alternate rows. The result is that the hectare gets the whole dose per application, but coverage is always inconsistent.

    The sprayer is calibrated for double output compared to a typical every-row situation, and the operator drives alternate rows. The result is that the hectare gets the whole dose per application, but coverage is always inconsistent.
    The sprayer is calibrated for double output compared to a typical every-row situation, and the operator drives alternate rows. The result is that the hectare gets the whole dose per application, but coverage is always inconsistent.

    Situation 3:

    Since the sprayer will only drive alternate rows, the operator mistakenly sets the sprayer to emit half the output compared to a typical every-row situation. The first application (solid line) covers different rows from the second application (broken line). The result is a quarter-dose per application, and if the operator chooses to spray a second time, the hectare will only ever get half-a-dose. Yes, this happens.

    The sprayer has a typical calibration for spraying every row, but only drives alternate rows. The first application (solid line) covers different rows from the second application (broken line). The operator will claim to spray more frequently, but generally does not perform the second application unless there is high pest pressure. The result is half-a-dose per hectare per application.
    The sprayer has a typical calibration for spraying every row, but only drives alternate rows. The first application (solid line) covers different rows from the second application (broken line). The operator will claim to spray more frequently, but generally does not perform the second application unless there is high pest pressure. The result is half-a-dose per hectare per application.

    So, my final word on alternate row applications is that they should be performed with extreme caution. I’ve used them myself in early season applications in new plantings, but never without confirming coverage with water-sensitive paper, and never in conditions that might further compromise coverage to the point that the application does not give control.

    Caveat Emptor!

    Well, I thought it was funny. My apologies to J. Luymes from British Columbia (pictured) and Obi Wan Kenobi (not pictured… or is he?)
    Well, I thought it was funny. My apologies to J. Luymes from British Columbia (pictured) and Obi Wan Kenobi (not pictured… or is he?)
  • Establishing an Optimal Airblast Carrier Volume

    Establishing an Optimal Airblast Carrier Volume

    North American product labels may or may not include carrier volume recommendations. When they do, it could be based on a two-dimensional value like the planted area, or perhaps on row length which is more appropriate for trellised crops that form contiguous hedge-like canopy walls. Volume may be tied to product concentration, which sets minimum and maximum volumes based on product rates. Or, more commonly, volume recommendations take the form of vague guidelines such as “Spray to drip” or “Use enough volume to achieve good coverage”.

    In all cases, spray efficacy and efficiency can be greatly improved by dialing-in the carrier volume to optimize coverage uniformity and reduce off-target spraying. This is easier said than done because the optimal spray volume is case-specific. It depends on a complicated relationship between:

    • Weather conditions (E.g. temperature, humidity, wind speed and direction)
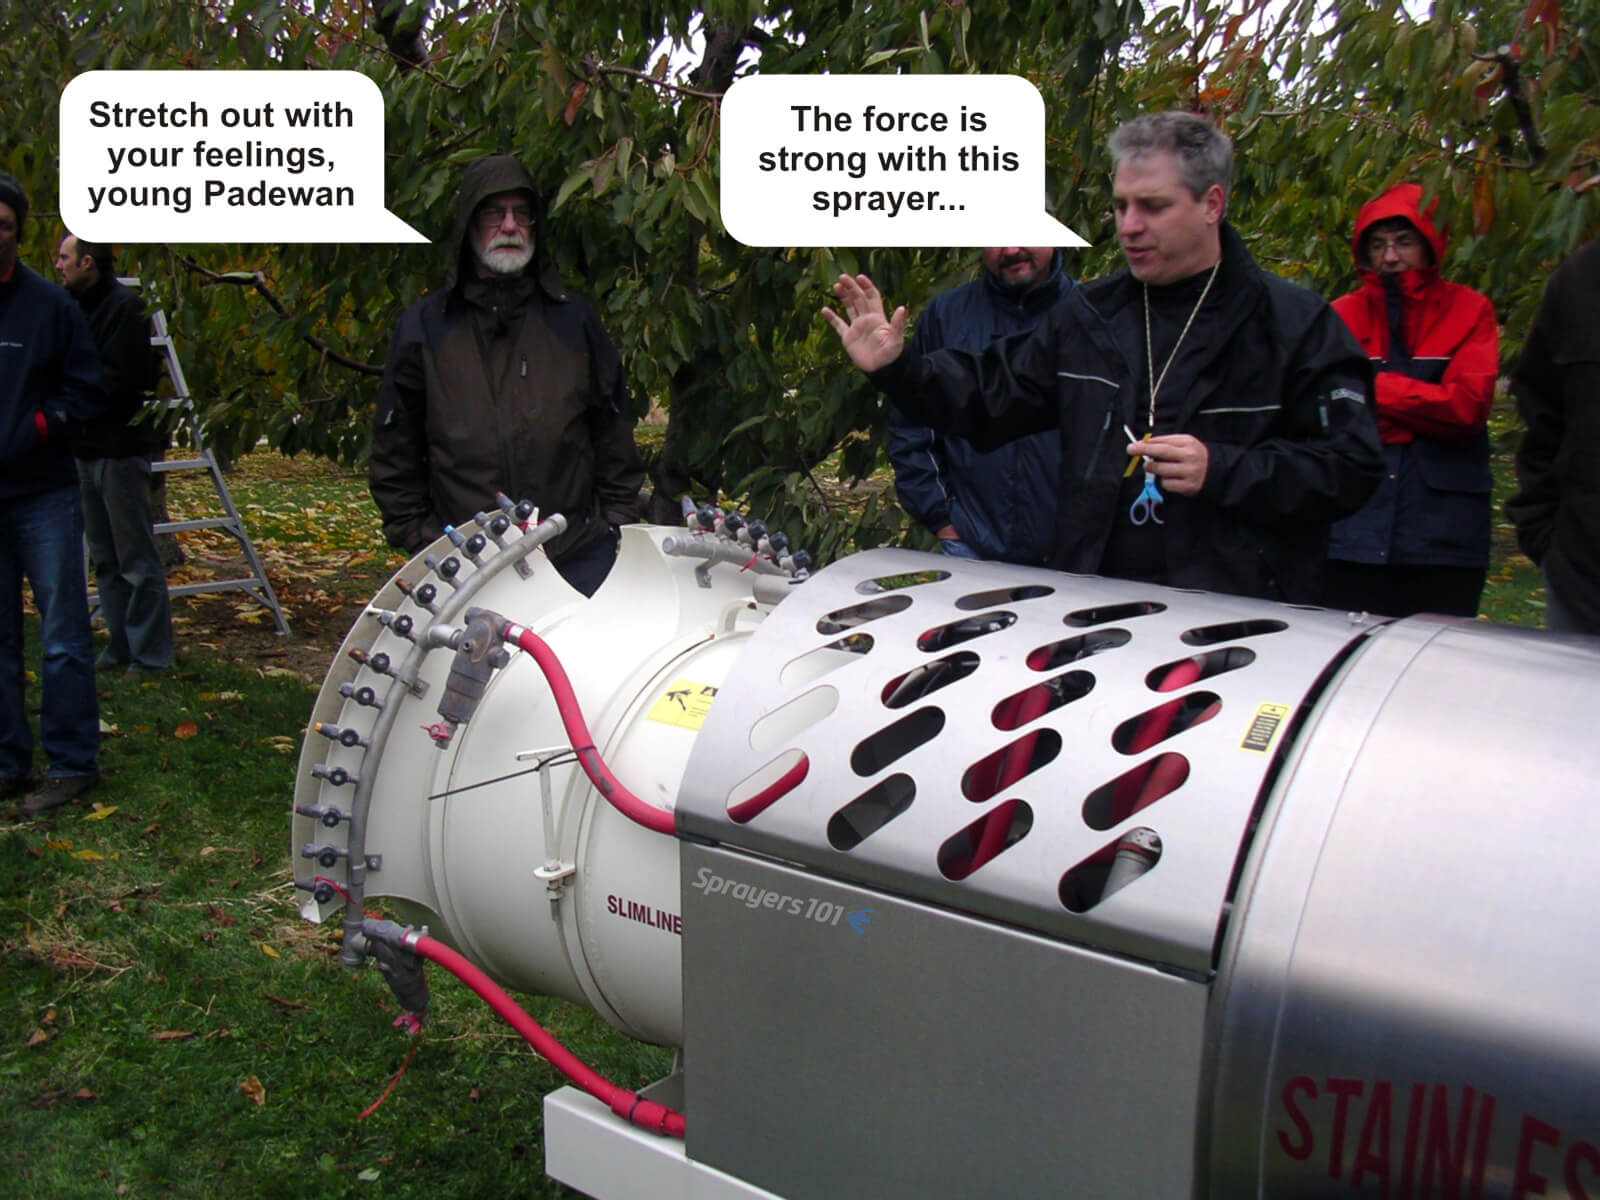
    • Sprayer design (E.g. air handling, droplet size and flow distribution over the boom)
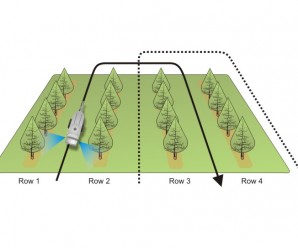
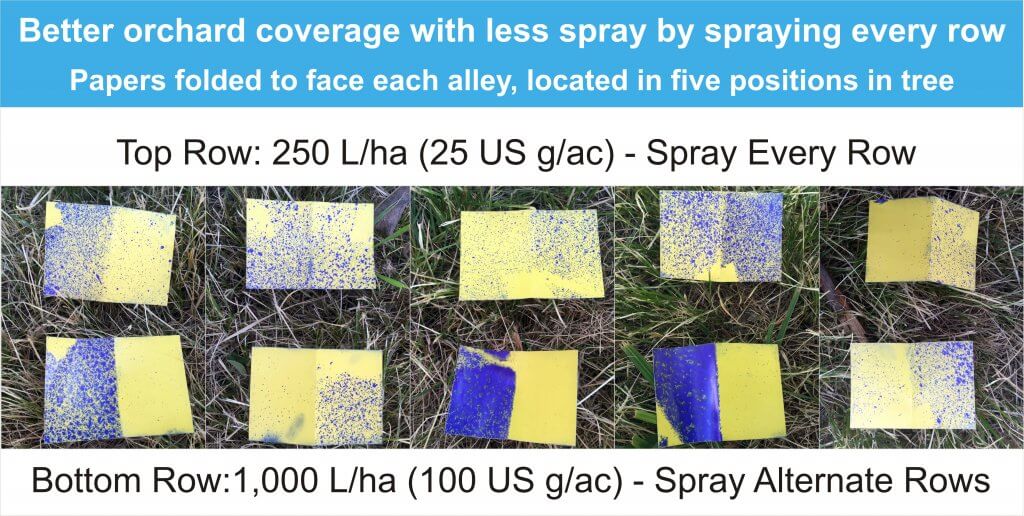
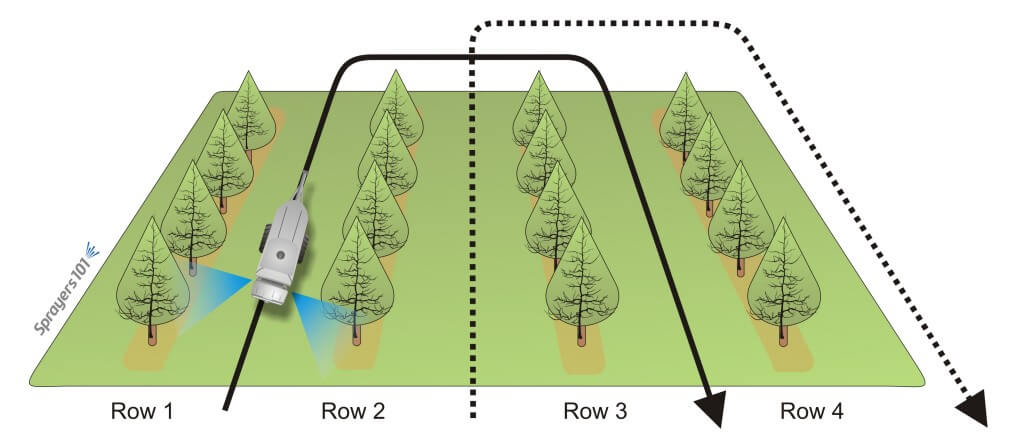
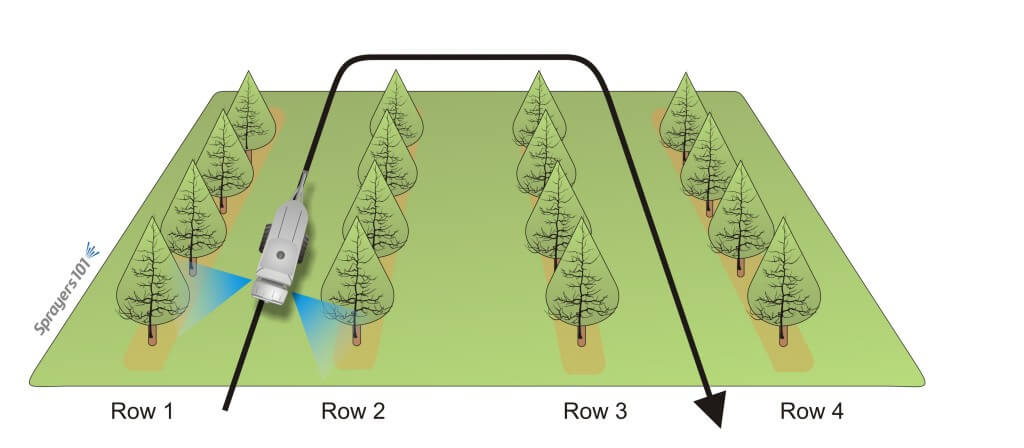
    • Traffic pattern (E.g. every row or alternate row)
    • Product chemistry (E.g. mode of action and formulation).
    • Target (E.g. Crop morphology, planting architecture)

    It is the final variable, the nature of the target, which is the focus of this article. To learn more about the other variables, grab a copy of Airblast101.

    The plant canopy and planting architecture dictate volume

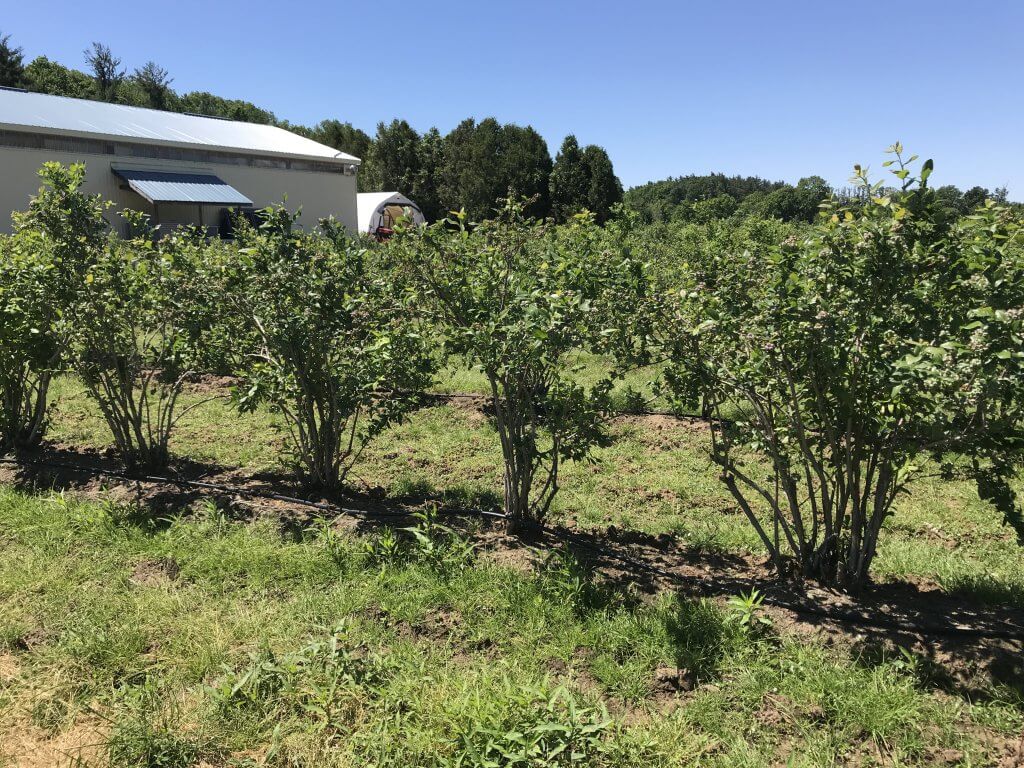
    Quite often, the target in airblast applications is the plant canopy. The plant canopy is the collective structure containing all plant surfaces. This could be the foliar portion of a single pecan tree, a panel of grapes, or a bay of container crops. The planting architecture describes how those canopies are arranged on the planted area. If we consider the canopy and architecture geometrically, we can make relative statements about the volume required when all other variables are equal.

    Six geometric characteristics of the plant canopy and planting architecture.
    Geometric CharacteristicRelationship to Carrier Volume (per unit planted area)
    Row SpacingThe greater the row spacing, the less volume needed.
    Plant SpacingThe greater the plant spacing, the less volume needed. This assumes gaps between the canopies (I.e. not a contiguous hedgerow).
    *Canopy DepthThe greater the canopy depth, the more volume needed.
    *Canopy WidthThe greater the canopy width, the more volume needed.
    *Canopy HeightThe higher the canopy, the more volume needed.
    Canopy DensityThe denser the canopy, the more volume needed.
    *The product of average canopy depth, width and height is the canopy volume. This value forms the basis for many dose expression models and historic carrier volume calculators such as Tree Row Volume.

    Canopy density

    Let’s focus on a single plant canopy. Research has demonstrated that with the possible exception of canopy height, canopy density has the greatest influence on optimal sprayer settings. 
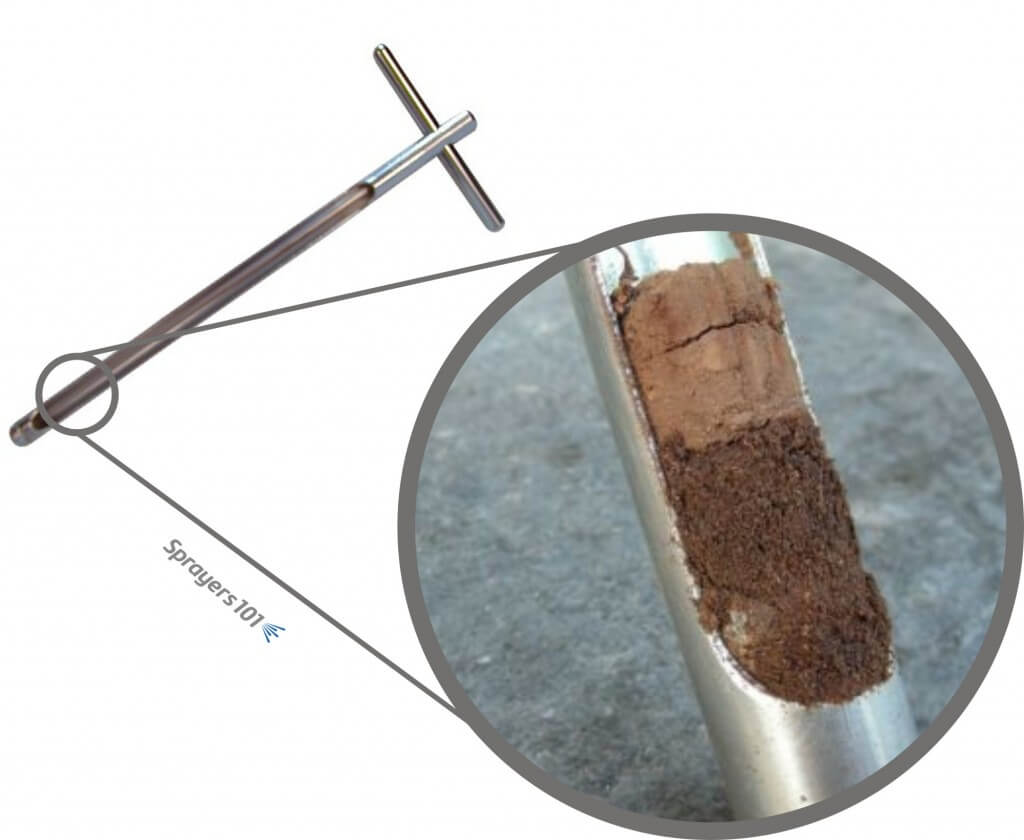
Density describes the amount of matter inside a canopy relative to the volume of space it occupies. The denser the canopy, the more surface area there is to cover and the more difficult it is for spray to penetrate. While air handling plays a significant role in improving coverage, a denser canopy will almost always require a greater carrier volume.

    When two physiologically diverse blocks share an alley, use the sprayer settings suitable for the larger of the two. It’s more important to ensure good coverage on the big block than to save on the smaller.
    When two morphologically-diverse blocks share an alley, a two-sided, every-row sprayer should employ settings suitable for the larger of the two. It’s more important to ensure good coverage on the big block than to save on the smaller. Once the hybrid row is sprayed, settings should be modified to suit the block.

    For most perennial crops, canopy density changes over the growing season. The influence of age and staging on canopy size and density will depend on the crop variety, plant health and canopy management practices. The practical implication is that as the canopy grows and fills it typically warrants an increase in spray volume. 
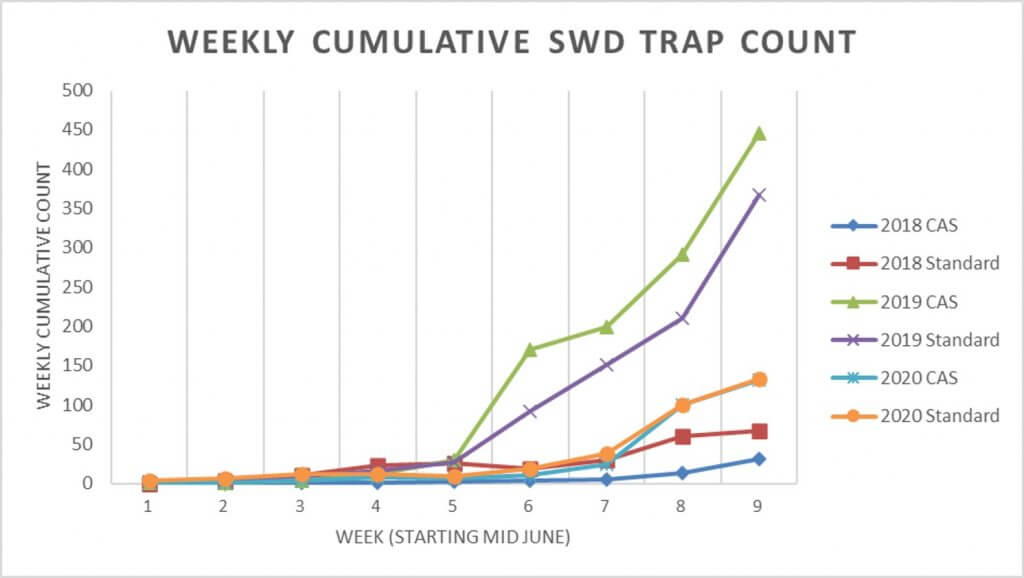
As illustrated in the figure below, the volume used should reflect the current stage of canopy development. If a volume suitable for the densest and largest stage of development is used all season, it will create a great deal of waste early in the season. However, if volume is increased incrementally to reflect canopy growth, a better fit between coverage and volume will minimize waste. In the image below, volume is increased around petal fall, but the fit could be improved with more increments. Caution is advised to ensure the volume is raised (if required) prior to immediate need, particularly during key developmental stages like bud break or bloom where fungicide coverage is critical.

    The curved line represents the leaf area in a canopy (Y-axis, right) increasing over the growing season (X-axis). The volume of the spray (Y-axis, left) providing effective coverage is indicated in green. Spraying the same volume throughout the season means a lot of over-spray (red) early in the season. The target simply isn’t there yet. Using less volume early season and changing about midway through the season, or as required by canopy development, has the potential to save a lot of spray (blue) without compromising spray coverage. Note that the first volume should give sufficient coverage to reach mid-season, and the second volume should be sufficient to reach the end of the spraying season. Always err on the side of excessive coverage to buffer against the impact of unanticipated variables.

    There are exceptions to this rule. Many nursery crops and mature evergreens often do not require changes to volume. High density apple orchards may or may not require an increase in volume. Early in the season, sparse canopies have low profiles that result in very low catch efficiencies. In other words, a great deal of spray misses the target. The amount of waste is a function of the application equipment design and the weather conditions. Most low-profile axial airblast systems envelop the target in spray with limited means of reducing air energy sufficiently, or to turn off the spray between trees. Further, sparse canopies do not restrict wind, which means ambient wind speed tends to be higher early in the season compared to when the trees become wind breaks. This creates a drift-prone situation and higher volumes are often used to compensate for the loss. The collective result is that excess spray volume is inevitable early season. As the canopies fill, the wind is reduced and catch efficiency increases, so trees intercept more spray without having to raise volumes. This balance eventually tips, however, and an increase in volume may be advisable.

    Watch the following video to see the impact of using excessive spray volume (and poor air adjustment settings) in a young cherry orchard. The waste becomes particularly apparent at ~43 seconds when the sprayer passes in front of the woods and the plume can be seen with higher contrast. While some loss is inevitable in such a sparse canopy wall, this situation could be improved by using less carrier volume, larger droplets, the correct air settings, canopy-sensing optics and/or a tower or wrap-around sprayer design.

    Adjusting spray volume sprayer settings to reflect the canopy can save money and reduce environmental impact during early-season applications and in young plantings. Mix the tank as you normally would to maintain the pesticide concentration on the label, but adjust the sprayer output to match the plant size. Performed correctly, you will be able to go further on a tank without compromising efficacy. This crop-adapted spraying method and the relationship between spray volume, concentration and dose are described further in this article and this article.

    Estimating volume from canopy geometry

    It is challenging to decide on an appropriate spray volume. Many operators resort to historical or regional practices and do not make adjustments to reflect their specific situation. Others refer to models such as Tree Row Volume (a.k.a. Canopy Row Volume) which relates canopy volume per planted area to spray volume. In this case, catch efficacy is expressed as a coverage factor, which is determined through experimentation specific to the crop, environment and sprayer.

    Tree Row Volume = (Avg. Canopy Height × Avg. Canopy Spread × Planted Area) ÷ Row Spacing

    Spray Volume = Tree Row Volume × Coverage Factor

    In New Zealand, coverage factors for dilute applications to deciduous canopies range from 0.007 to 0.1 L/m3 (0.00052 to 0.00075 US gal/ft3). The range captures variation in canopy density and any product-specific coverage requirements. Oil sprays, for example, require more surface coverage than most products. While closer to “the truth”, the Tree Row Volume method is still only an estimate.

    If the operator has no prior experience with the crop or the sprayer and wants a sanity-check on their estimated spray volume, we propose the following guidelines for full canopy dilute application to mature crops using every-row traffic patterns. The volumes may seem high, but recognize we have selected a very challenging scenario.

    • Small canopies (E.g. bush, vine, cane, high-density fruiting wall): 500 L/ha (55 US gal./ac.) to 1,000 L/ha (110 US gal./ac.).
    • Medium canopies (E.g. tender fruit, pome): 750 L/ha (80 US gal./ac.) to 1,250 L/ha (135 US gal./ac.).
    • Large canopies (E.g. tree nut, citrus): >2,000 L/ha (214 gal./ac.) and up tp 7,000 L/ha (748 US gal./ac.).
    • For sprayer operators that think in 100 m row lengths, consider 20 L volume per 100 m row length per 1 m canopy height.

    Further Resources

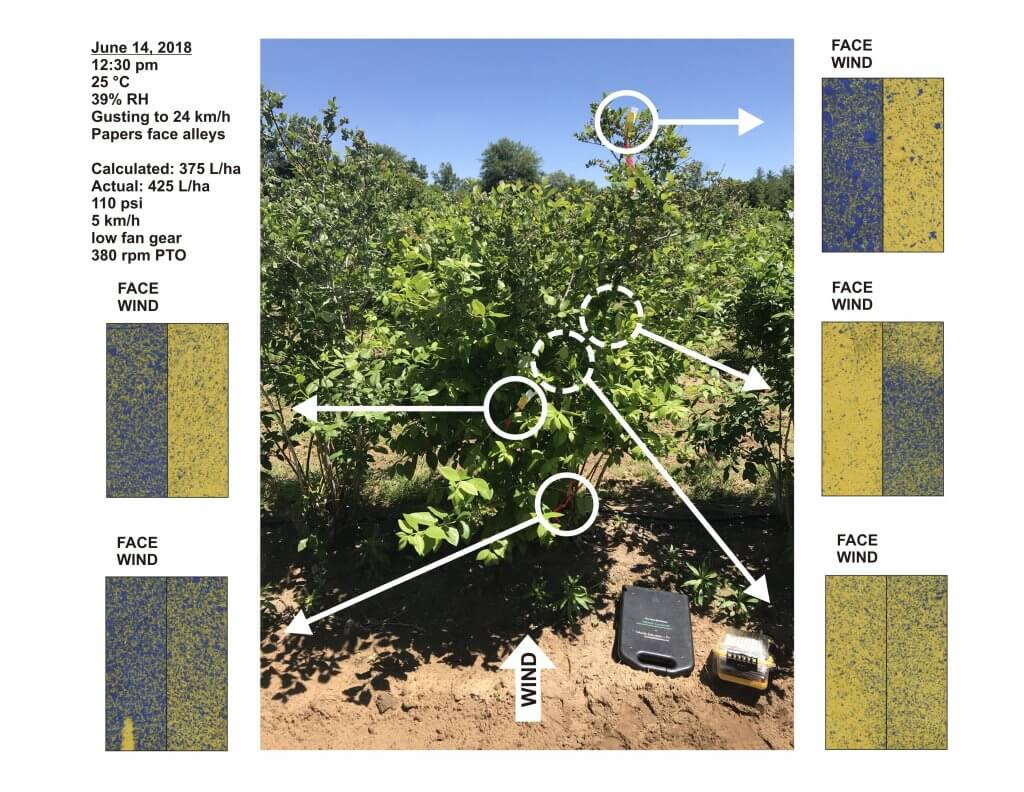
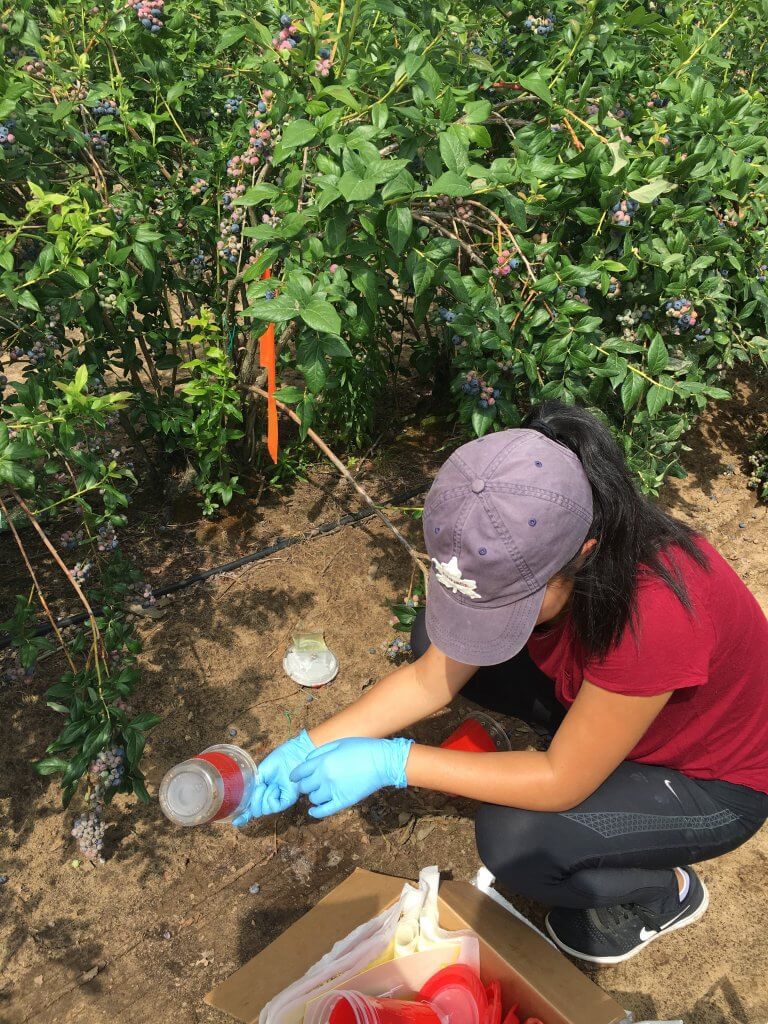
    No matter the approach to determining spray volume, it is imperative that coverage is assessed. It is amazing what we ask of airblast sprayers. Read this short article for some perspective on the coverage we hope to achieve from a given spray volume. We propose the use of water-sensitive paper to assess spray coverage. We describe its use and evaluation in detail in this article, this article and in this article. Dialing-in an optimal spray volume is an iterative process that requires careful observation and keeping records on what works and what doesn’t for your specific operation.

    Jon Clements (University of Massachusetts) wrote a great blog post on the subject of TRV. He warns about special considerations when it comes to establishing effective volumes for plant growth regulators and links to a factsheet called Spray Mixing Instructions – Considering Tree Row Volume. The factsheet was written in 2021 by Terence Robinson and Poliana Francescatto (Cornell University) and Win Cowgill (Professor Emeritus, Rutgers University).

    Finally, if you really want to get lost the weeds, check out this video recorded in 2021. I had an opportunity to learn from pros like Dr. Terence Bradshaw (University of Vermont) and participants from the Great Lakes region. They’ll tell you all you ever wanted to know about Tree Row Volume. Settle in!

    Thanks to Mark Ledebuhr of Application Insight LLC for his contributions to this article.

  • How to Succeed with a Soil Drench Application in Strawberries

    How to Succeed with a Soil Drench Application in Strawberries

    In 2016, Ontario berry growers were surveyed to determine the typical spray volume they used to apply unspecified crop protection products. For strawberry growers (day-neutral and June-bearing), the results spanned 50 to 1,000 L/ha (~5 gpa to ~100 gpa). In an earlier survey (2013), respondents specified 250 to 650 L/ha (~26.5 to 70 gpa) for fungicides, herbicides and insecticides. Miticide applications were as high as 750 L/ha (80 gpa).

    This rather wide span of carrier volumes shouldn’t be surprising. No matter the horticultural cropping system, the choice of carrier volume reflects the operation’s unique pressures and priorities. These variables include, but aren’t limited to, operation size, spray equipment, crop varieties/staging, geography, and pest profiles. The ultimate goal is to achieve threshold coverage (i.e. efficacy) while maximizing productivity.

    However, even the highest carrier volume reported did not reach the volumes required for those crop protection products intended to drench the soil. These products can span a range of 1,200 to 2,000 L/ha (~128 to 214 gpa). Experienced matted-row strawberry growers employ different methods to apply soil drenches, and we will discuss them later in the article. But first let’s address three common factors that must be considered:

    Know the target

    If (for example) the target is white grubs in the root zone, or phytopthora root rot, then the spray should be focused at the base of the plant in a banded application. Performing a broadcast application that covers the alleys as well as the plant rows may represent wasted spray. Knowing the target can help make the most efficient use of carrier.

    Know the soil

    Soil that is compressed or has high clay content won’t soak up water as quickly as drier, looser or sandier soil. If the beds are raised and resist absorption, much of the volume will run off into the alleys. This may not be desirable if the target is the raised bed itself. The following basic water movement principles come from the Manitoba Agriculture, Food and Rural Initiatives Soil Management Guide.

    • Water flows more quickly through large pores (sandy soils) than small pores (clay soils); water is held more tightly in small pores (clay soils) than in large pores (sandy soils).
    • Water moves from wet areas to dry areas (not necessarily by gravity) due to forces of adhesion and cohesion. This is called matric flow.
    • Water will not move from small soil pores to large soil pores unless conditions are saturated.

    Know the weather forecast

    Spraying on a hot, dry day means a higher rate of evaporation. As the carrier evaporates, the product will have less opportunity to infiltrate the soil. Conversely, applying product just before a heavy rain can result in a much diluted product being rinsed too deeply into the soil and beyond the target area.

    Consider that one millimetre of rain on one hectare of land is 10,000 litres. That seems like a lot, but how deeply does it infiltrate into soil? One way to know is to use calculations based on soil porosity and bulk density. From these calculations it can be generalized that 25 mm of rain will infiltrate 45 mm into dry, sandy soil, but only 32 mm into dry clay soil. Remember, that 25 mm of rain represents 250,000 L/ha!

    Perhaps the best way to know how far water will infiltrate the soil is to use a soil probe (aka soil sample tube). They can be purchased from local dealers for about $100.00 CAD, or they could be borrowed from whomever provides soil sampling services in the area. For the best results, perform this test in multiple locations in the field.

    The soil probe. See how far water infiltrates soil by taking core samples.
    The soil probe. See how far water infiltrates soil by taking core samples.

    So what methods do strawberry growers employ to apply a drench? Here are the top three:

    1. Slow down

    Some growers elect to use their existing sprayer setup, but they slow down to get more volume on per hectare. For example, if the grower normally applies 500 L/ha (53.4 gpa) driving at 5 km/h (3.1 mph) they would have to drive 1.25 km/h (0.78 mph) to achieve the 2,000 L/ha some labels require. If the sprayer tank held 1,500 litres (~400 US gallons) that would mean doing 0.75 hectares (1.9 acres) to a tank compared to the normal 3 hectares (7.5 acres). That would be four times as long, without considering the time for the extra refills.

    Alternately, but related to slowing down, is double-pass spraying. In this case the tank is mixed at half-rate and the operator makes a pass through the field. Then, a second half-rate tank is applied immediately afterwards, ideally driving from the opposite direction. This effectively gives a full rate of product in a higher volume of water.

    2. Re-nozzle

    When slowing down is not enough (or not an option), some growers elect to re-nozzle. It may be tempting to increase the operating pressure to increase output on existing nozzles, but that makes finer droplets which tend to drift off target. The largest hollow-cone nozzles will only emit ~870 L/ha at 5.0 km/h (93 gpa at 3.1 mph) and that’s at 125 psi, which many trailed sprayers cannot manage. Further, many labels indicate a need for Coarse droplets in a drench, and hollow cones cannot produce such large droplets.

    There are a limited number of flat fan nozzles that can achieve sufficiently high rates, and even then they must be used at slightly slower travel speeds. For example, the TeeJet AI11008 used at 70 psi will apply 145 gpa (~ 1,350 L/ha) with a Very Coarse spray quality at 4 mph (6.4 km/h). Driving slower can rise those volumes considerably. Alternately, streamer nozzles (e.g. TeeJet’s 5 or 7 hole StreamJets) require lower pressures (up to 60 psi) to emit as much as 2,310 L/ha at 5.0 km/h (247 gpa at 3.1 mph). The grower can maintain their travel speed, but will still have to refill more often.

    3. “Wash In” the spray

    Still another choice is to apply the product using the existing sprayer set-up, using a typical carrier volume, just prior to a rain event or sprinkler (not drip line) irrigation. For example, if the grower normally applies 500 L/ha (53.5 gpa), they would continue to do so. If the grower is relying on rain to wash the product in, it should be sufficient precipitation to move the product to the desired soil depth. Where sprinklers are an option, this can be controlled, and the depth of infiltration tested with a soil probe. Washing in the spray should take place as soon after application as possible to ensure the product is distributed evenly into the soil.

    Thanks to Pam Fisher, former OMAFRA Berry Crop Specialist, and Anne Verhallen, former OMAFRA Soil Management Specialist, for their contributions to this article.