Tag: CAS

  • Crop-Adapted Spraying in Highbush Blueberry: Nine years of pesticide savings

    Crop-Adapted Spraying in Highbush Blueberry: Nine years of pesticide savings

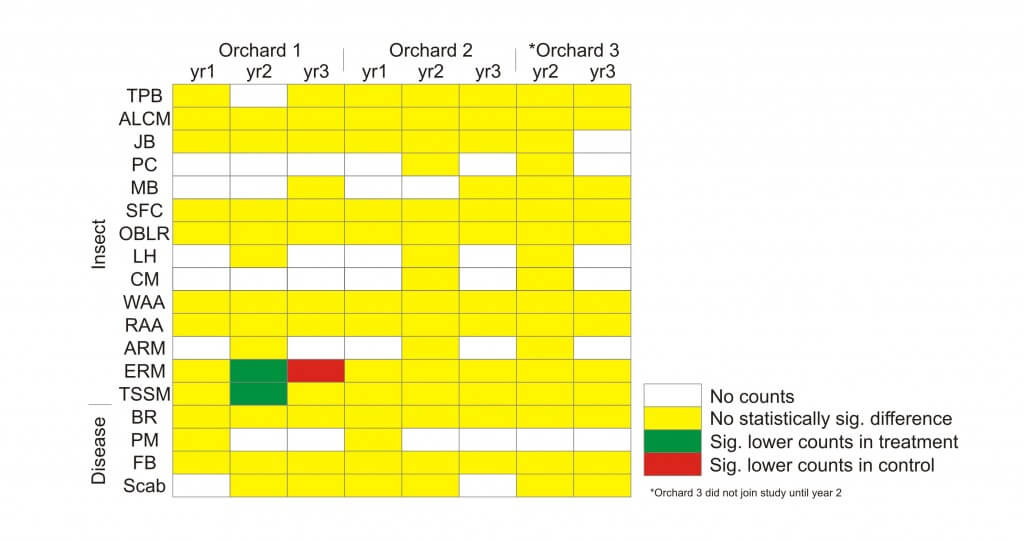
    This case study is taking place on a 15 acre highbush blueberry operation in southern Ontario. In 2016, considerable pressure from spotted-wing drosophila (SWD) prompted the growers to make changes to their crop management practices and their spray program. They employed a three-pronged approach to improving crop protection:

    1. Significant changes to canopy management and picking / culling practices
    2. Investing in a new sprayer
    3. Adopting the Crop-Adapted Spraying (CAS) method of dose expression

    We have been tracking pesticide use, water use and yield compared to historic values. We also monitored spotted-wing drosophila catches both in crop and in wild hosts along the border of the operation for three years.

    Canopy Management

    In 2016 the operation made the following changes to their canopy management practices:

    • They performed their first-ever heavy pruning and planned to to maintain an ideal crop density by removing ~30% plant material annually. This more-or-less took place.
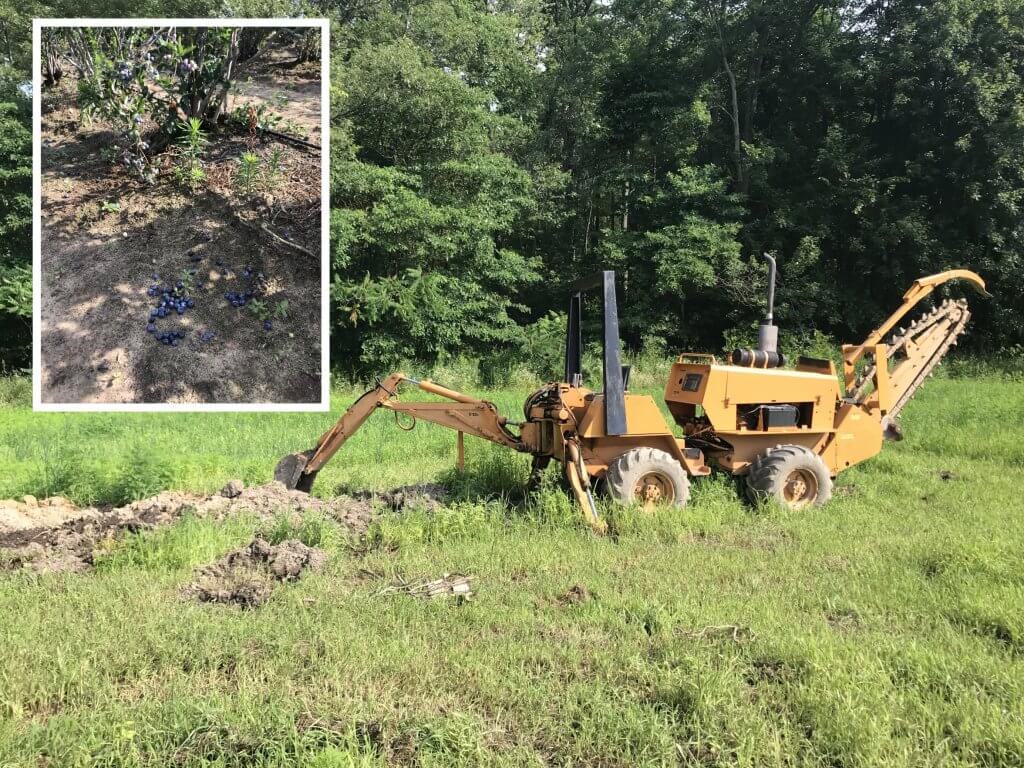
    • They regularly collected and buried culled and dropped berries.
    • They picked cleanly and more frequently.
    Heavy pruning in 2016.
    Most years, bushes were pruned ~30% to maintain an ideal size and shape.
    Pickers were educated in how to pick cleanly and dropped / culled fruit was collected and buried.

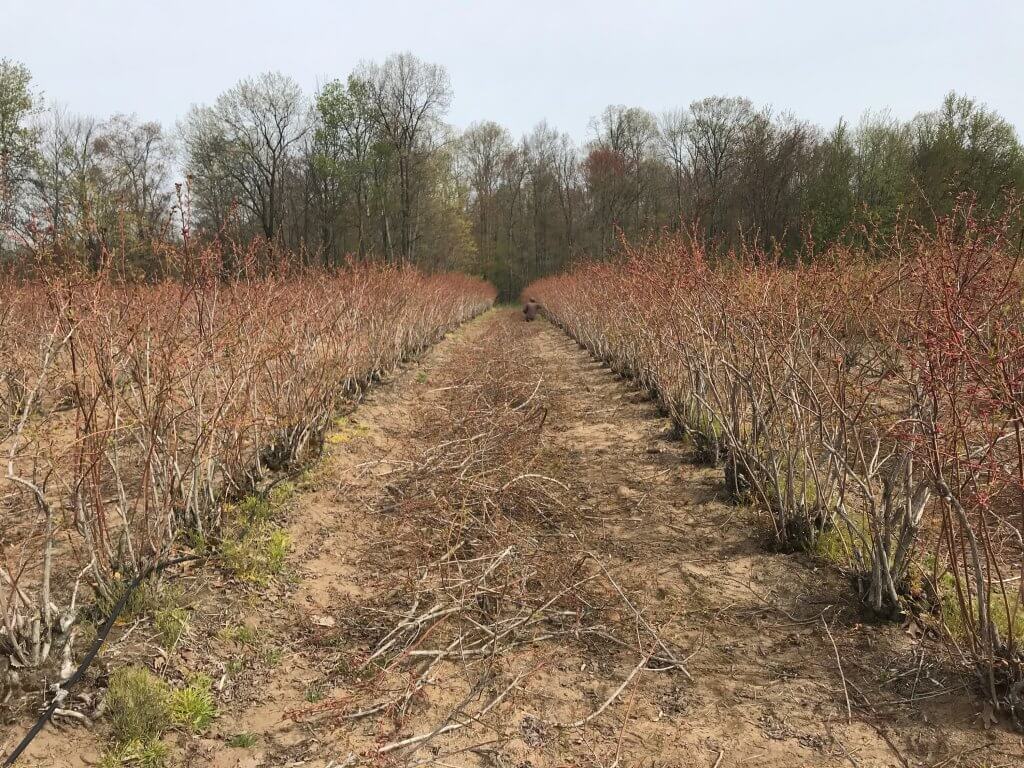
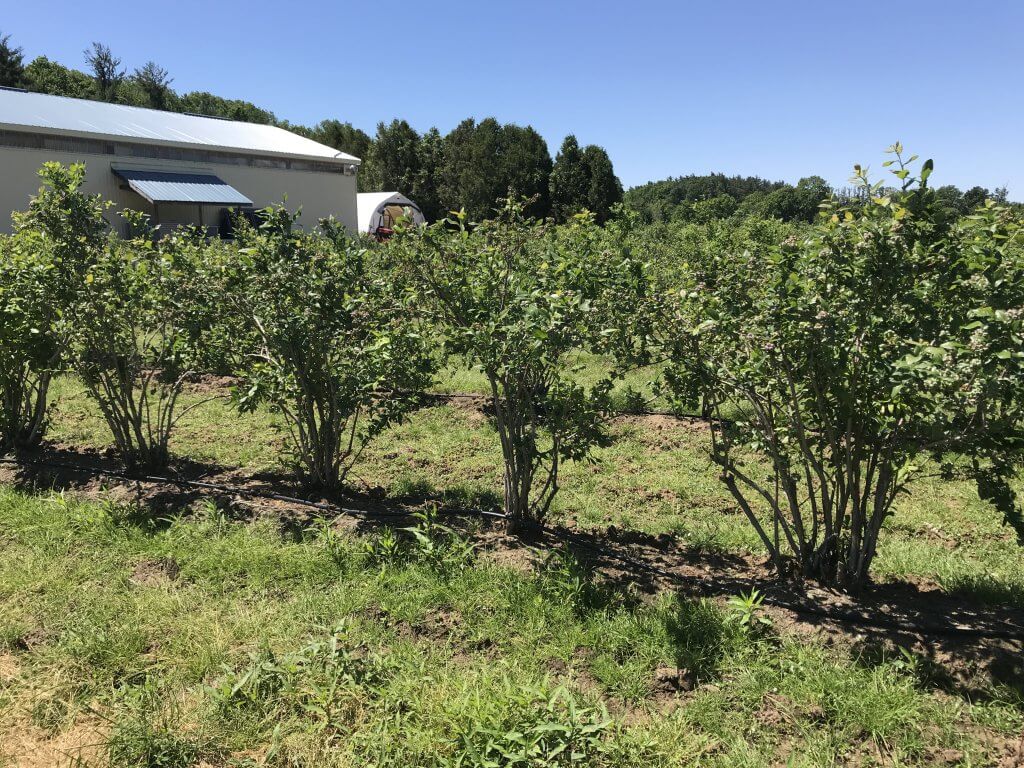
    There were initial concerns that such dramatic pruning would reduce production per acre and require trellising to prevent berries weighing down the smaller bushes. However, in 2017 (and thereafter) they found that the quality of the berries was greatly improved and noted fewer hours spent culling berries during packing. Financially, the growers felt they came out ahead.

    Application Technology

    In 2018 they replaced their old, inefficient KWH sprayer with a low profile axial with conventional hydraulic nozzles to permit greater control of the spray. The KWH design was intended for standard fruit trees. It produced >100 mph air and an Extremely Fine spray quality and was therefore a bad fit with the planting architecture and canopy morphology of highbush blueberry.

    They considered a cannon-style sprayer hoping to spray multiple rows in a single pass but given the desire for improved coverage and reduced waste, they elected to drive every row using a low-profile axial.

    Fore: An old KWH air shear sprayer. Rear: Low profile axial sprayer with conventional hydraulic nozzles.

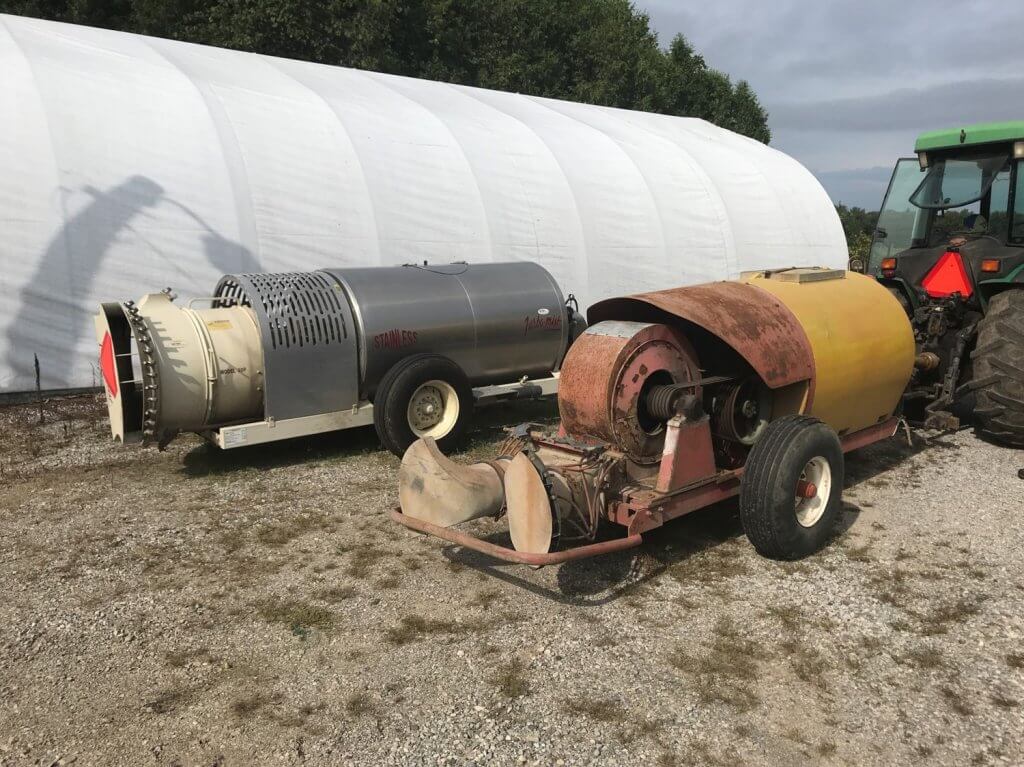
    The new sprayer was more reliable, quieter, and more fuel efficient. Further, the old sprayer leaked and the air-shear nozzles did not respond when shut down at the end of rows. Eliminating these sources of waste represented a savings of ~20% of the spray volume traditionally used per acre.

    Crop-Adapted Spraying

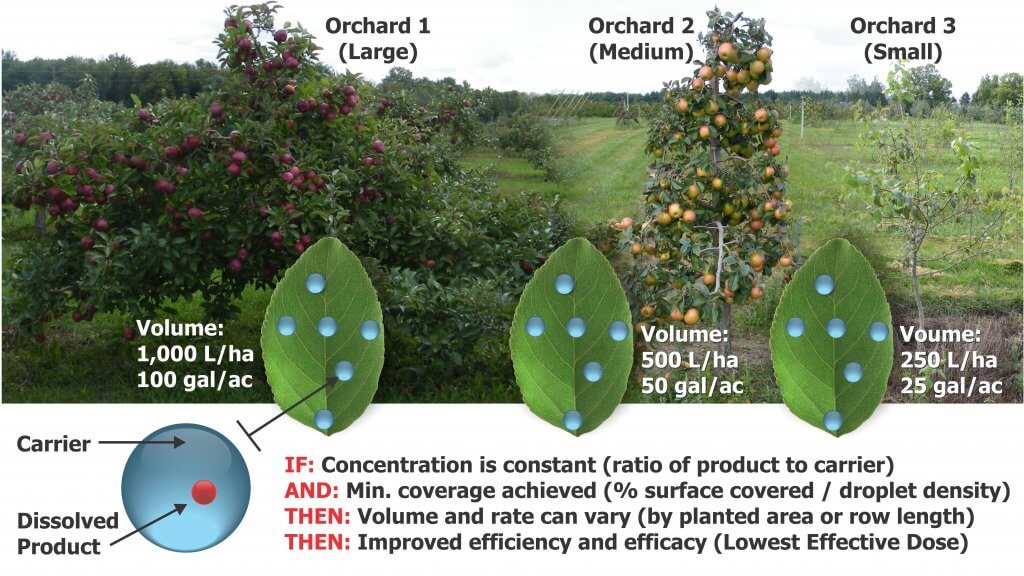
    The redundancy inherent to product label rates for three-dimensional perennial crops has long been recognized. In response, rate adjustment (or dose expression) methods have been developed to improve the fit between rate and canopy coverage (e.g. Tree-Row Volume, PACE+, DOSAVIÑA). Each has value, but their adoption has been slow because they are region- or crop-specific and they can sometimes be quite complicated.

    CAS lends structure and repeatably to the informal rate adjustment methods already used to spray three-dimensional perennial crops (e.g. Making pro rata changes by engaging/disengaging nozzles in response to canopy height or altering travel speed in response to canopy density).

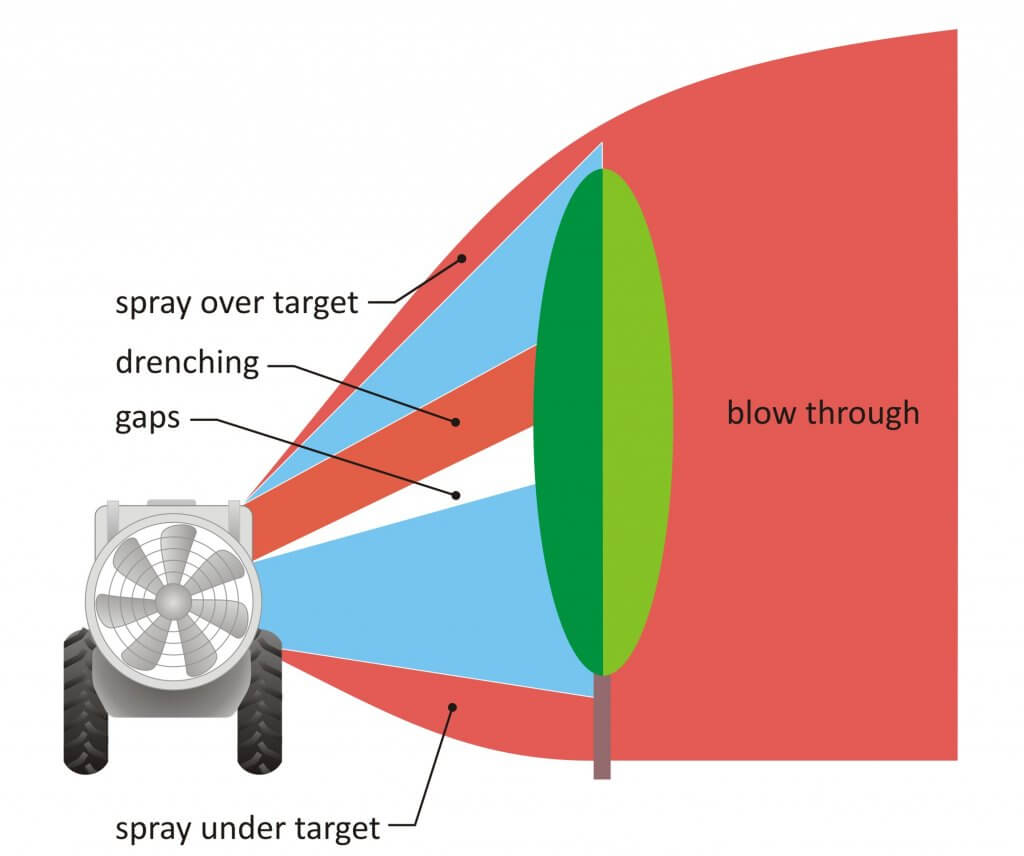
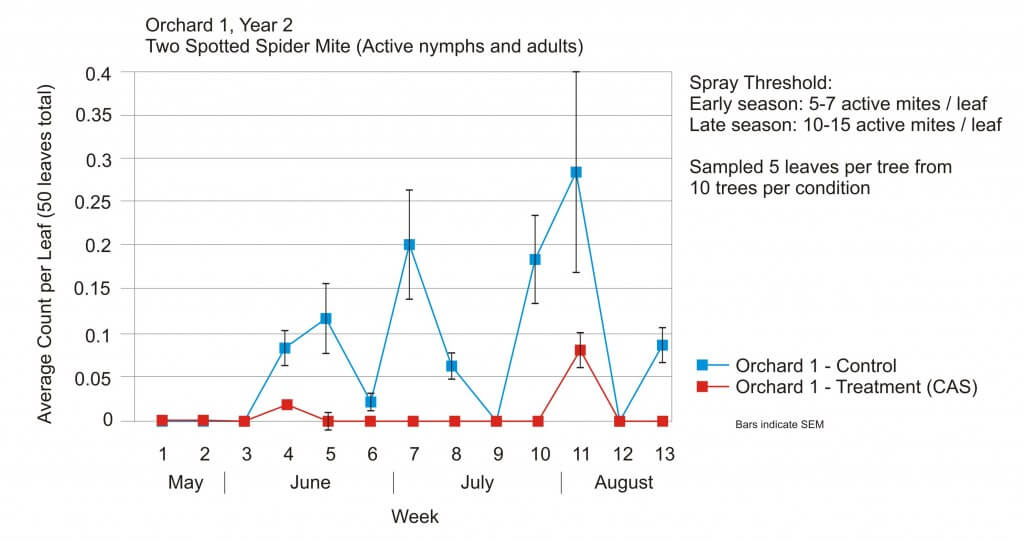
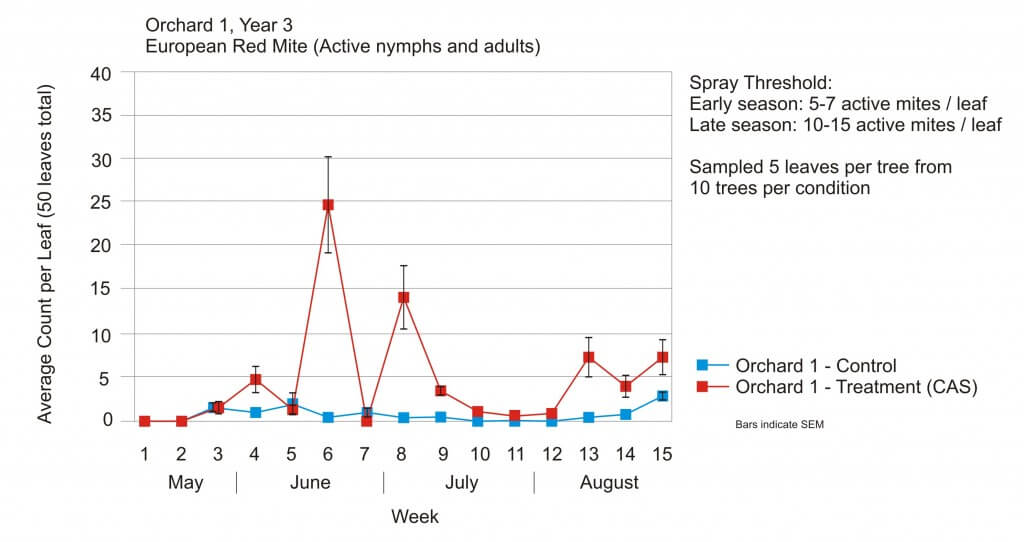
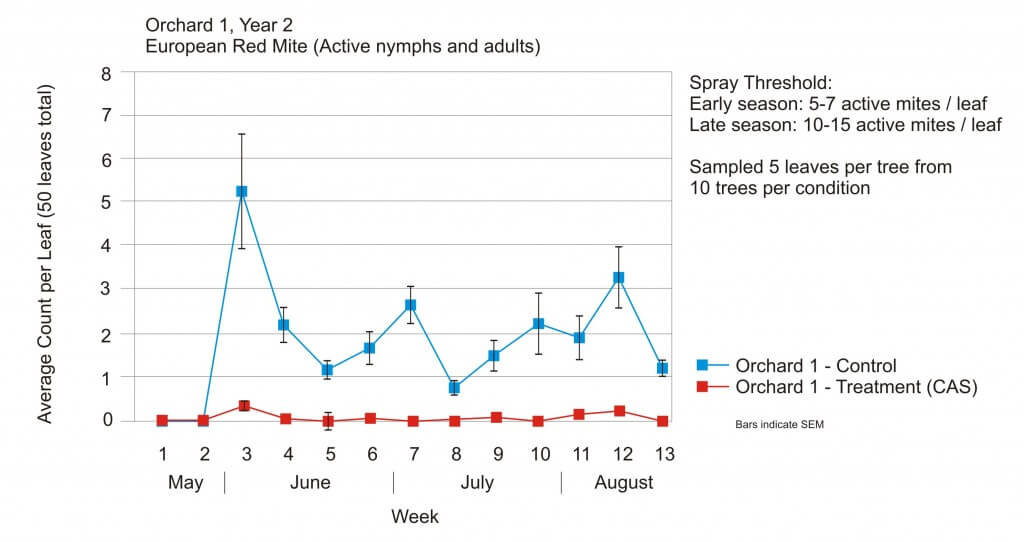
    The CAS method relies on the use of water sensitive paper to confirm a minimal coverage threshold of 85 deposits per cm2 as well as 10-15% area covered throughout a minimum of 80% of the canopy. Using this protocol, we calibrated air energy and direction, travel speed and liquid flow distribution. This process is covered in detail here and in the new edition of Airblast101. In that first year we reassessed coverage every few weeks between April and June using water-sensitive paper.

    Spray volume / Pesticide

    By matching the sprayer calibration to a well-managed canopy, the growers were able to go from ~1,000 L/ha to ~400 L/ha of spray mix. The ratio of formulated product-to-carrier remained the same, but less spray was warranted per acre. Stated differently, the grower mixed the spray tanks per usual, but drove further on a tank.

    This also saved an estimated 15 hours of filling/spraying time per year, which translates to reduced operator fatigue and exposure as well as reduced manhours and equipment hours.

    The decision of what and when to apply was at the growers’ discretion. Chemistry was rotated and applications were made according to IPM in early morning (if there were no active pollinators) to avoid potential drift due to thermal inversions. The following image shows what those papers looked like in June of the first year.

    Example of water sensitive paper coverage on a windy day (worst case scenario) in June, 2018.

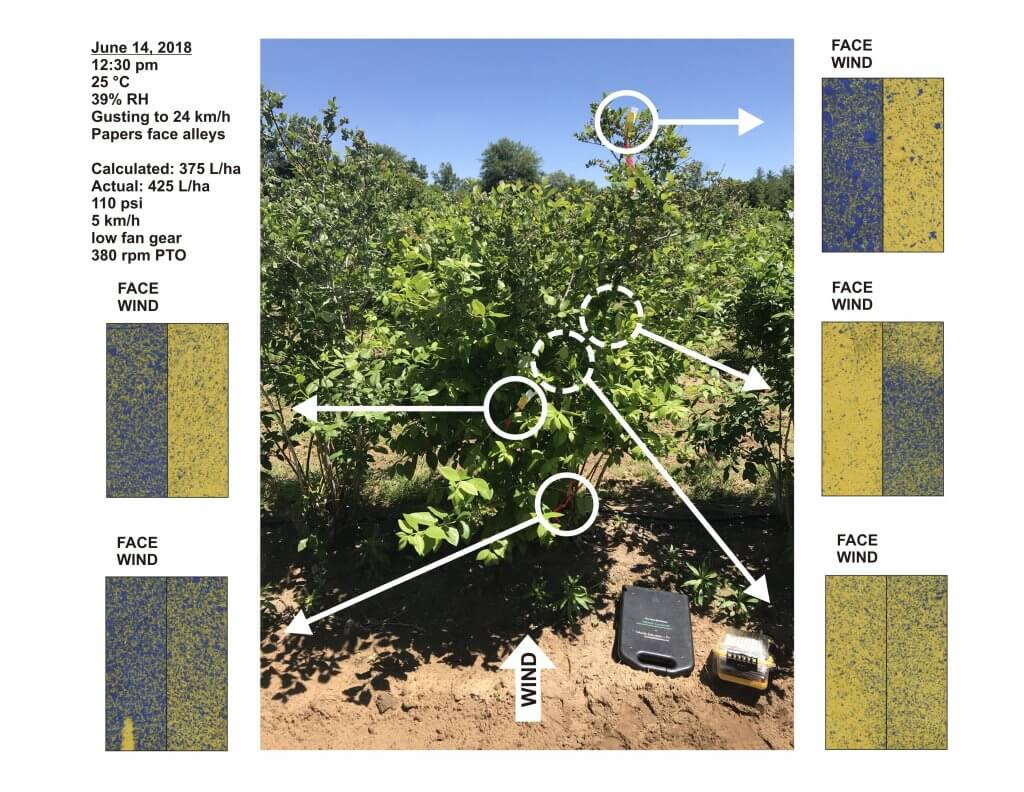
    Note how little spray escapes the target rows in the following video. The wind was too high for spraying, but we were only using water and saw it as an opportunity to test a worst-case scenario. Air-induction hollow cones were used in the top nozzle position on each side so droplets were large enough to fall back to ground if they missed the top of the canopies.

    SWD monitoring

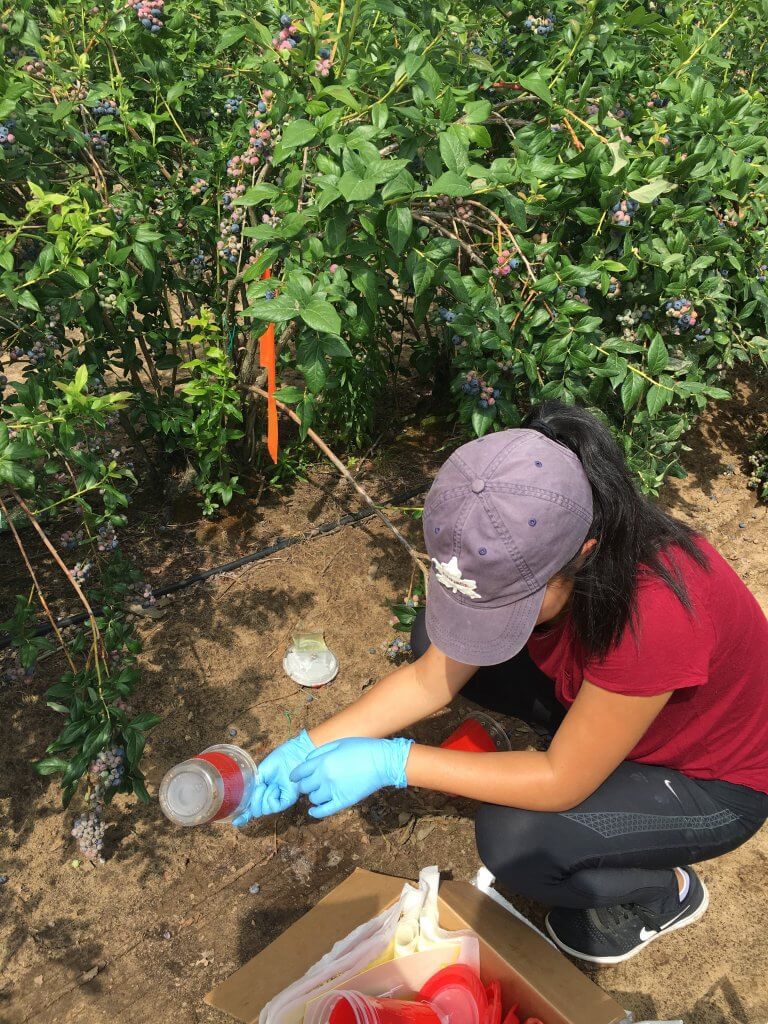
    SWD represents a serious economic threat to blueberry operations. Traps were placed in the operation (three in the crop and one in an unmanaged wild host along a treeline) and monitored weekly. Traps were also placed in surrounding horticultural operations which were employing standard pest control practices. This not only provided regional information about SWD activity but allowed us to compare the level of SWD control from the Crop-Adapted Spraying approach.

    • In 2018 the comparison included up to 16 other sites that were berry and tender fruit.
    • In 2019 the comparison included 10-12 sites (depending on the week) and they were berry and tender fruit sites.
    • In 2020 the comparison included 4 other sites (blueberries, raspberries and cherries).

    2020 & 2021 – Covid 19 and Heavy Rain

    In agriculture, every year is an adventure, but 2020 and 2021 were exceptionally difficult and the circumstances should be considered when deciphering the results. Covid-19 has had a significant impact on global agriculture.

    In 2020, fearing a reduction in the availability of seasonal labour, the operation pruned their bushes heavily. This was done to reduce the yield in order to make harvest manageable.

    In 2021, labour was once again secure. Given the heavy pruning the year previously there was no need to prune again, so the crops densified. This coincided with abnormally high levels of precipitation to create significant anthracnose issues. Additional fungicide applications took place that raised costs, but the grower maintained CAS-optimized rates and sprayer settings.

    Quantitative Results

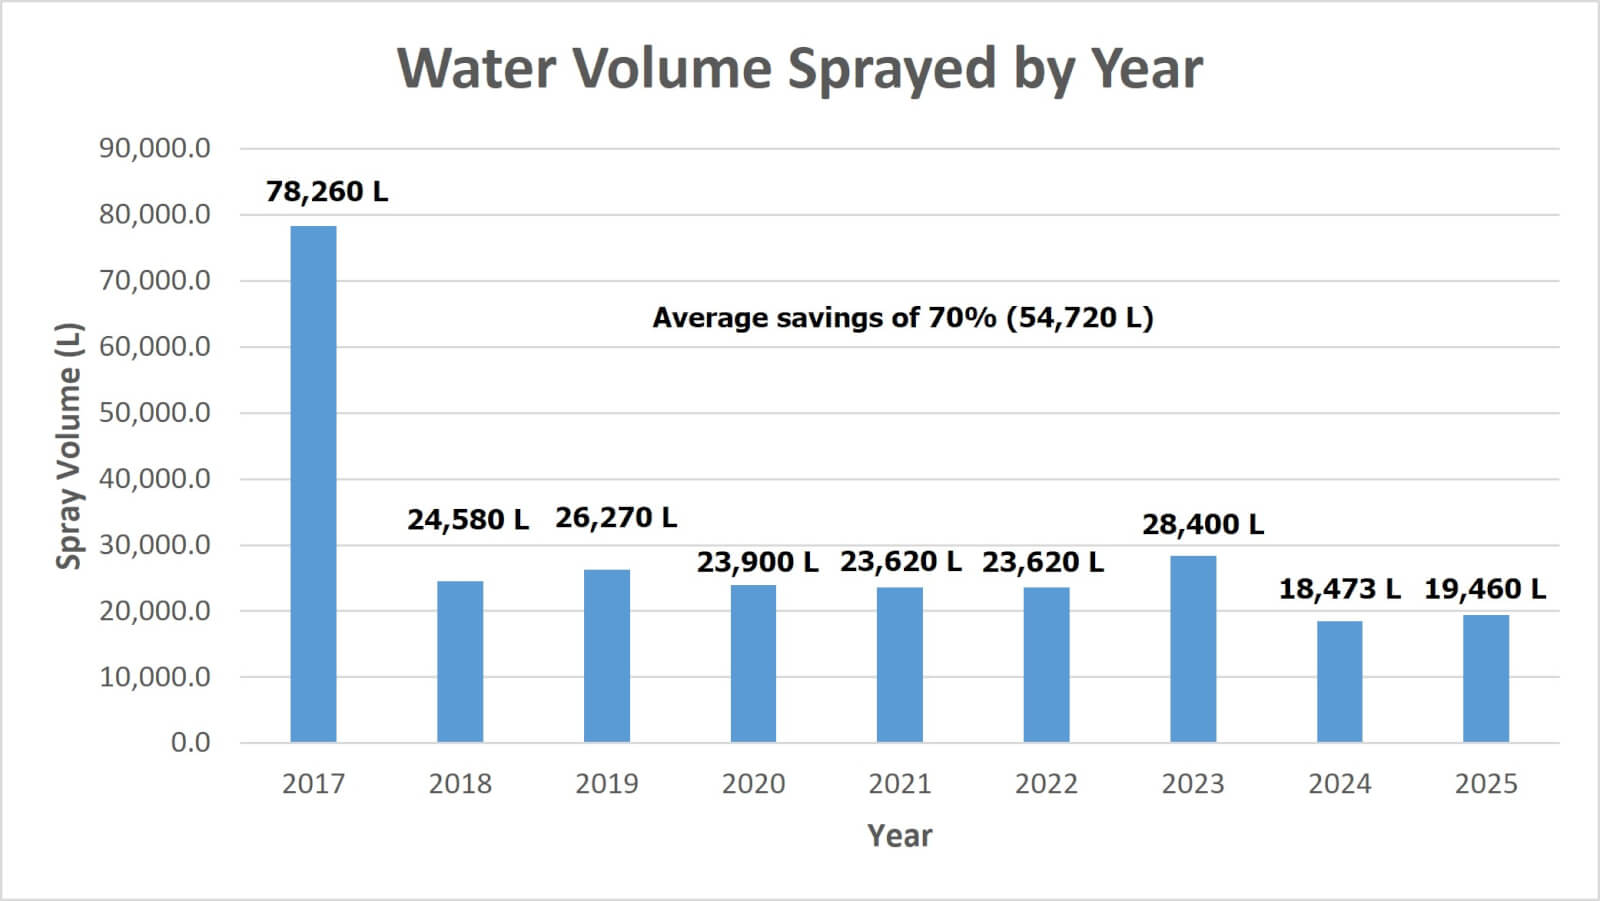
    Prior to replacing their sprayer, and adopting CAS, the operation sprayed about 78,260 L/yr. Their average savings in spray volume (water) has been 54,720 L/yr, or 70%.

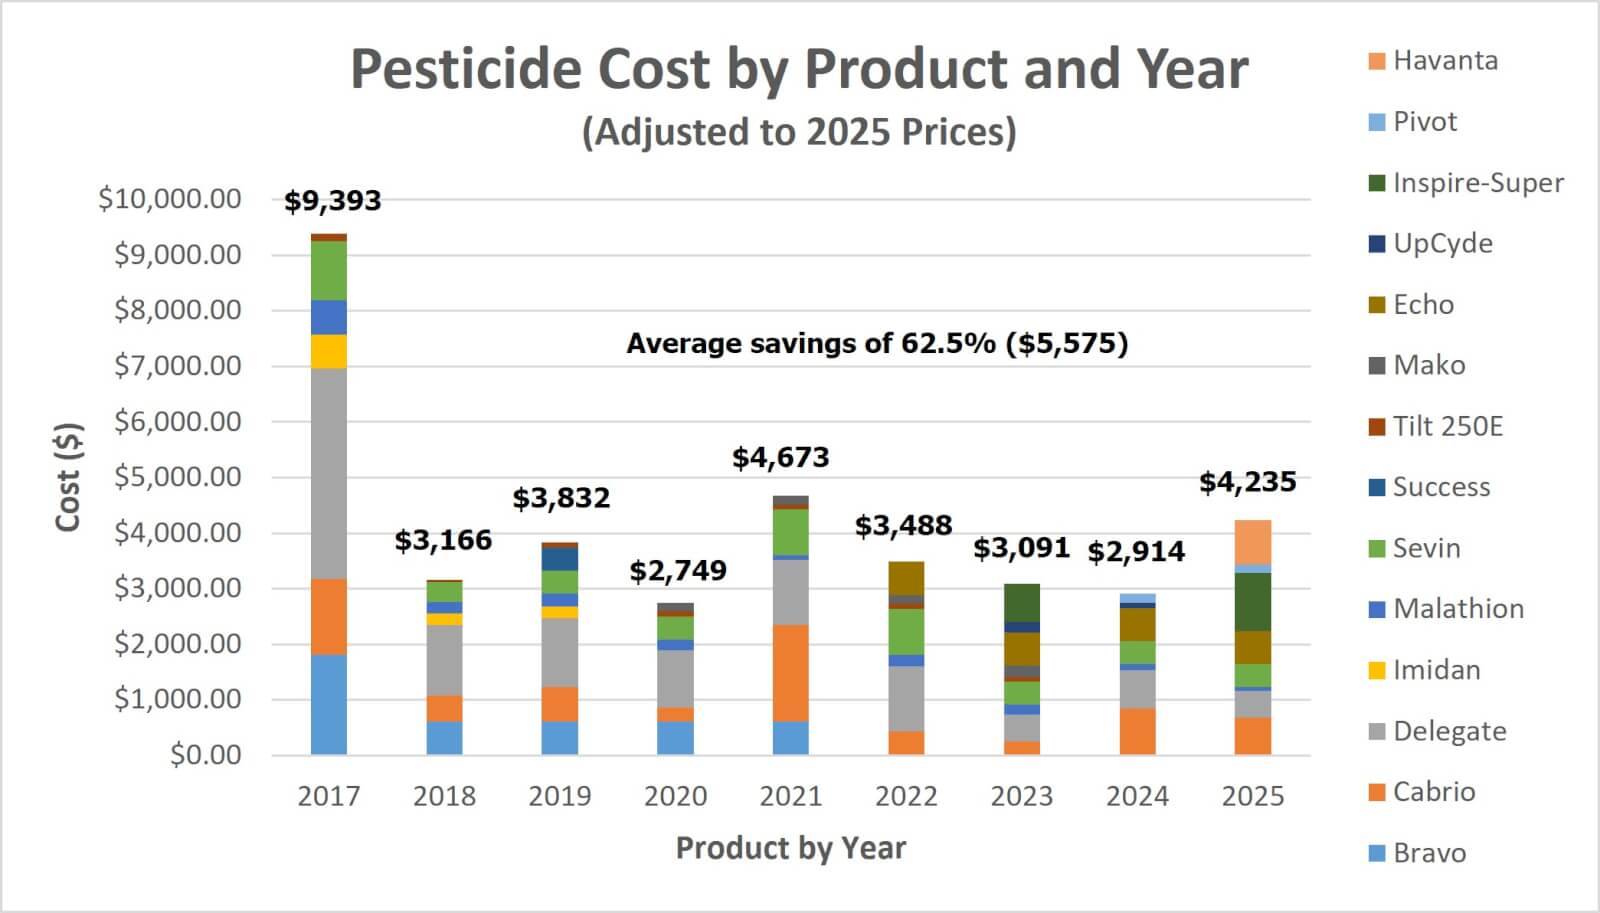
    In terms of pesticide savings, we compare each year to the 2017 baseline. In order to make for a fair comparison, we update pesticide prices each year using current costs. Therefore, the 2017 total has increased by about $2,600.00 (wow). Their average savings represents $5,575.00 CAD/yr or 62.5%.

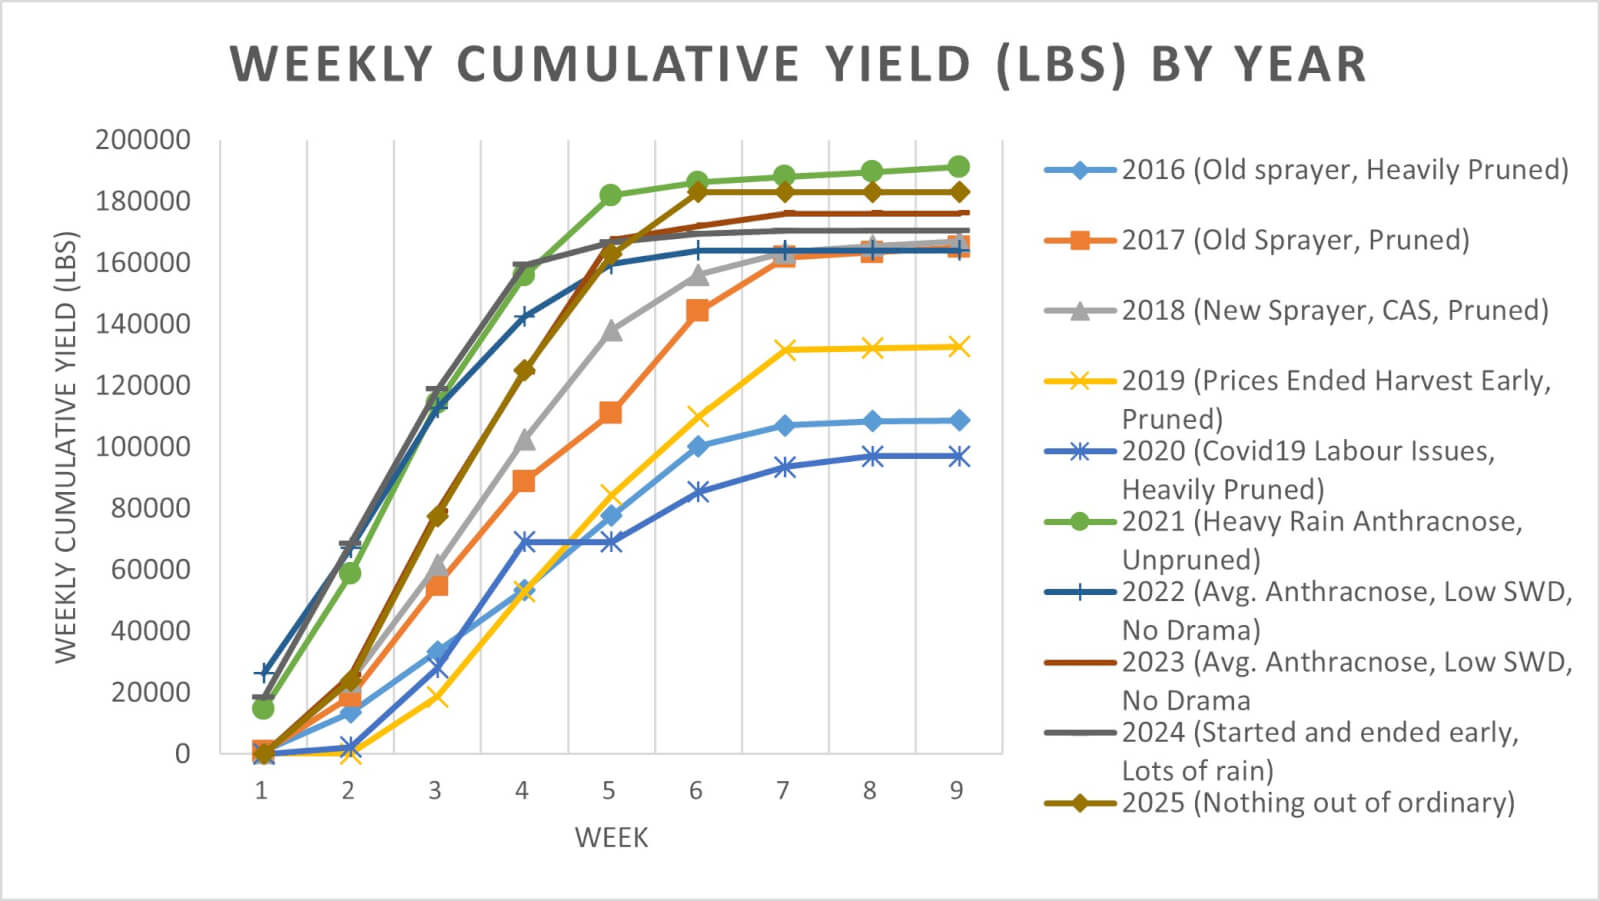
    Yield is more difficult to interpret due to mitigating circumstances in 2019 and 2020:

    • In 2016, prior to any changes, they harvested 12,076 flats (about 9lb of fruit each).
    • In 2017, following the canopy management changes, harvest increased to 18,335 flats (~50% increase).
    • In 2018, using CAS, harvest was essentially unchanged compared to 2017, which was excellent.
    • In 2019, harvest started a month late compared to previous years. Further, blueberry prices were low, and the operation elected to stop harvesting a month early. However, when those issues are factored in, the harvest was comparable.
    • 2020 was particularly challenging for agriculture and with the possibility of reduced labour due to the pandemic, the operation elected to prune heavily and reduce their yield.
    • 2021 saw unpruned bushes (following the heavy pruning in 2020) and abnormally high levels or precipitation which created anthracnose issues. As a result, more applications were made than any other year on record, but maintained the CAS-optimized rates and sprayer settings.
    • 2022 was (thankfully) fairly typical. Low SWD, average anthracnose and no drama.
    • 2023 was very much like 2022 with low SWD, average anthracnose and no drama.
    • 2024 saw a LOT of rain. The season started and ended early, but yields were par. “Pivot” replaced “Tilt”.
    • 2025 was pretty average all things considered. No drama whatsoever. “Inspire-Super” was added to product list.

    Trap counts for SWD were only performed during three years of the CAS study, so we are only able to present 2018-2020 data. It should also be noted that while the presence of SWD in an operation represents an impact on yield, there is not necessarily a correlation between the number of SWD captured the amount of damage.

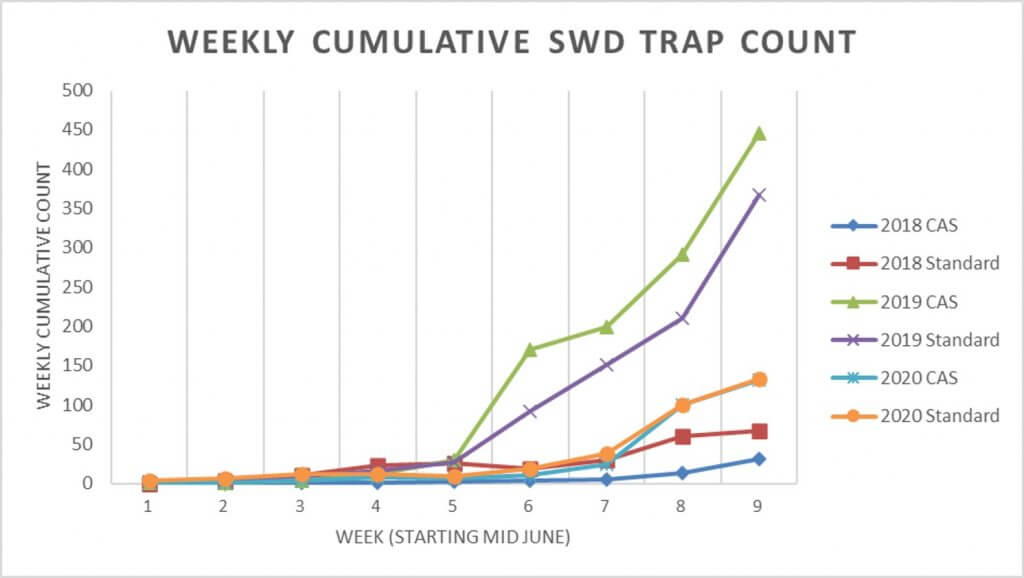
    In 2018 and 2020, average counts were higher in the surrounding operations employing standard practices (STD) compared to the CAS trial. In 2019, average counts were higher in the CAS trial. When total average counts are compared, the difference is negligible. Berries were tested regularly by the growers and the damage due to SWD was within acceptable limits. It should also be noted growers monitored and reported satisfactory disease control throughout the study.

    We have not applied any statistical rigor, but the trend suggests that the level of control provided by the CAS method was comparable to conventional methods. This conforms with our previous results in Ontario apple orchards and similar evaluations of optimized application methods world wide.

    Qualitative results

    Beyond the quantifiable results, the growers reported qualitative benefits:

    • Customers of the U-pick portion of the operation regularly enquire about pesticides. The operation’s reduction in pesticide use became a positive speaking point and aligned with the grower’s philosophy about reduced environmental pesticide loads.
    • While many blueberry growers experienced a market shortage of certain fungicides in 2018, this operation returned unused product to the distributor.
    • Growers reported less early-season disease damage, which saved considerable time on the packing line because there was less fruit to cull. Disease levels rose to typical levels later in the season, but there was still a net savings in labour.

    Conclusion

    The success enjoyed in this berry operation was a result of several canopy management and crop protection changes. This is a situation where the whole equaled more than the sum of its parts – it could only be achieved by making holistic changes to the operation. At the end of three years the growers themselves stated:

    “Based on my experience losing multiple crops to SWD, I can say with absolute certainty it works. <The results are> superior to what I expected. What we are doing is successful.”

    Here’s a narrated PowerPoint presentation of this study (includes data up to 2020):

    The monitoring portion of this project was funded by Niagara Peninsula Fruit and Vegetable Growers Association, Ontario Grape and Wine Research and Ontario Tender Fruit Growers in collaboration with private consultants.

  • OrchardMAX

    OrchardMAX

    2016_Orchard_Max_Logo

    OrchardMAX won the 2016 Canadian Agri-Marketing Association’s “Certificate of Merit” in the Mobile Apps Category.

    2022 Update

    OrchardMAX was developed in 2016. iOS and Android have moved on since then, so the links to the app no longer function. Maintaining this app for new operating systems requires a capitol expense which, presently, we have not explored. If you have some interest in exploring the model, reach out to jason@sprayers101.com and we’ll send you a copy that will work on Excel.

    What is OrchardMAX?

    OrchardMAX is a free app developed by the Ontario Ministry of Agriculture, Food and Rural Affairs to improve sprayer efficiency and effectiveness in apple orchards. The app is based on the Crop-Adapted Spraying (CAS) model, which was tested in semi-dwarf and high-density apple orchards in Ontario and Nova Scotia from 2013 to present day. The primary goal of the app is to help the sprayer operator achieve consistent coverage, no matter the architecture of the orchard block, throughout the season. Research has demonstrated that following the process improves coverage while reducing wasted spray by an average of 20% over the season.

    OrchardMAX will:

    • Accept Metric or US Imperial units
    • Create an inventory of your orchard airblast sprayers
    • Create an inventory of your orchard blocks
    • Determine optimal sprayer settings based on the average size, shape and density of the trees in the block
    • Propose a pesticide dose for each block, including ideal nozzle rates, water volume and product(s) per tank
    • Develop a permanent spray record that can be emailed to the user for archival
    • Calculate work rates and estimate productivity

    OrchardMAX won’t:

    • Exceed label rates
    • Calibrate your sprayer
    • Confirm spray coverage
    • Account for environmental conditions such as wind, humidity or temperature
    • Advise a volume below 400 L/ha (about 42.5 US g/ac)
    • Advise a dose that is less than 1/2 the label rate (that may seem low, but consider a first-year planting)

    Recognizing that this app can only approximate ideal sprayer settings based on data entered by the user, sprayer adjustments are still required on the part of the sprayer operator. Specifically, the sprayer operator must still calibrate and adjust the sprayer air to match the tree and the environmental conditions and confirm coverage using water-sensitive paper.

    Why you should try it

    Financial savings: The app will help you match your sprayer settings to the crop you’re trying to protect. That means you will find out if you are over- or under-spraying the tree canopy and by how much. This information, combined with feedback from water-sensitive paper, will improve canopy coverage and very probably improve the quality of the apple crop. Additionally, the app may lead to reduced pesticide volumes, which reduces environmental contamination and saves money.

    Explore different spraying scenarios: Perhaps you’re considering a new planting and you would like to know how many tanks it would take to spray an orchard block for a given speed, or row spacing. Perhaps you are considering a sprayer with a larger tank to reduce the number of refills, or a smaller tank to prevent rutting and you want to see how that affects your spray efficiency. Maybe you’re considering decreasing your fill time by using a tender or nurse truck. Enter the parameters and see how it affects your spray day BEFORE you invest.

    Create permanent spray records: The app will create a library of spray records that are emailed directly to you.

    How it works

    Enter Farmer/Owner information
    Enter Farmer/Owner information

    Like any new practice, you have to put in a little time and effort to realize the full benefit of the app. Try it on a few blocks in the first year, make the changes to your spray program and review the results. As you get used to this new method for spraying, and see the improvement, you can continue to expand its use to the entire operation.

    First you have to enter information about your operation. This only has to be done once.

    1. Enter your profile information
    2. Complete the Inventory
    3. Information for each sprayer in your operation
    4. Information about each sprayer operator
    5. Information about each physiologically different orchard block (e.g. Trellised Gala on 10′ rows is quite different from mature semi-dwarf Empires)

    Now you are ready to calculate rates for a spray day.

    1. Choose the Sprayer, Operator and Block from your Inventory
    2. Decide if you want to use label-rate, or an optimized rate based on tree size
    3. Determine if you will spray every row, or alternate rows (You cannot choose to optimize your rate AND spray alternate rows)
    Select sprayer, operator and block from inventory, then enter spray-day data to calculate rate and sprayer settings.
    Select sprayer, operator and block from inventory, then enter spray-day data to calculate rate and sprayer settings.

    Enter information about the tree shape and density (This accounts for pruning and time-of-season). This is mostly visual, where the user chooses from a series of pictures

    • Enter label rate and preferred rate for each pesticide in the spray mix

    The software then lets you know how much carrier and/or pesticide can be saved if you nozzle your sprayer according to it’s prescription.

    • From a nozzle catalog, enter the nozzle rates for each position within 5% of OrchardMax’s prescription

    The software then assembles a simple spray record, including all the rate adjustments and sprayer settings, which is emailed to you for your permanent records.

    Where can I get it?

    Select your operating system (images below) and you will be taken to the respective store and begin downloading. Please rate the app so we know it’s being used and can work to improve it. Please opt in to provide us with usage information so we can see how it’s being used – this is entirely private, and we will not contact you.

    NOTE: These links may no longer function. Contact jason@sprayers101.com if you’d like to learn more about the model or to try the Excel version.

    The OrchardMAX app was developed by AgNition Inc. with funding from Growing Forward 2.

  • Crop-Adapted Spraying (CAS) and an Apple Orchard Case Study

    Crop-Adapted Spraying (CAS) and an Apple Orchard Case Study

    An orchard spraying scenario

    Here’s a common situation: An orchardist following IPM identifies a pest that poses an economic threat. It’s an annual pest and spraying is really a matter of when, not if. The operation is 150 acres and runs three airblast sprayers; two have a tower and one does not. Multiple varieties are planted in several blocks on different rootstocks and they are at different stages of maturity. The newer blocks are trellised high density trees and the older blocks are semi-dwarfs on different row spacing. Let’s also imagine the pruning team hasn’t finished yet, so some trees are not pruned.

    The orchardist turns to the pesticide label to decide how to spray such variable targets. It prescribes a range of doses per planted area (not canopy size), depending on the pest pressure. It advises the orchardist to use “enough water” to ensure “good coverage” without incurring “runoff”.

    The orchardist recognizes that the label is vague, and elects to rely on what has worked historically: A water-soluble pouch is dropped into each tank (dose is close enough), and each sprayer operator is instructed to drive at an efficient speed (get it done because rain is coming), spraying until the tank is empty. They say that if a tank is running low before the job is done, speed up and stretch it. If the spray is overshooting a younger planting, they suggest turning off the top nozzles and/or driving faster.

    Airblast operators face this situation regularly. The question is: “Is there a problem with spraying this way if it results in a respectable crop of quality fruit?” Agricultural engineers specializing in application technology in Spain, Australia, Great Britain and the United States say there is a problem, and on behalf of Canada, I completely agree with them.

    Canopy and Sprayer Variability

    The fundamental problem is inconsistent spray coverage and avoidable waste (of time, water and pesticide) due to variability. Our scenario notes multiple sprayer operators, different models of sprayer, and a range of varieties, orchard architectures and canopy management practices. The label does not allow for any of these factors, adhering to a rate based on planted area and remaining silent on water volume.

    International peer-reviewed journal articles stretching back to the sixties have conclusively demonstrated order-of-magnitude differences in the area-density of orchard canopies from one acre to the next. There can even be fold-differences in canopy area-density in the same planting as the season progresses. A label prescribing a fixed dose based on the area planted is not appropriate for any vine, bush, cane or tree crop, and the result is that more crops are over- or under-sprayed than receive appropriate coverage.

    Let us not forget the variability that comes from a poorly adjusted sprayer. I won’t to attempt to quantify the impact (although some researchers have suggested order-of-magnitude differences from sprayer to sprayer). Instead, let’s illustrate it as a conceptual “before and after”:

    Before: Potential spray loss and inconsistency before adjusting sprayer to match the canopy
    After: Coverage variability reduced and unnecessary waste mostly eliminated.

    Beyond the immediate impact on efficiency, variability makes it difficult to diagnose pesticide effectiveness. As an example, there was a scab outbreak in Ontario in 2009 that elicited questions about timing, weather, product choice and resistance. There was very little attention given to spray coverage, which to my mind should have been the first question if only to eliminate it as a potential culprit. This is because each operation interprets labels differently, and very few confirm coverage in any quantifiable way. This practice makes it more difficult to identify a cause when crop protection fails.

    Optimizing pesticide rates

    That was a lot of preamble to describe an issue that many orchardists are already aware of. What is needed is a way to adjust the amount of pesticide per unit ground area (i.e. the label’s prescription) to achieve consistent foliar coverage for canopies of varying shape and density. The concept is visualized in the following figure. In addition, the method has to be simple, intuitive and effective.

    Many models have been proposed to tackle the dose expression issue, including Tree-Row Volume, Leaf Area Index, Leaf Wall Area, PACE+ and DOSAVIÑA. There are advantages and disadvantages to each method. Standing on the shoulders of giants, we combined aspects of each of these models, including incorporating coverage factor research from USDA ARS work in nurseries, to develop the Crop-Adapted Spraying (CAS) method. It is neither complicated nor sophisticated. It formalizes a series of qualitative calibration techniques and the objective is to achieve a target foliar coverage pattern. When achieved with sufficient accuracy, pesticide efficacy is maintained and waste is greatly reduced.

    Caveats

    Perhaps I shouldn’t point out flaws before I describe the model’s effectiveness, but it’s important to understand that CAS relies on a few critical assumptions.

    The first assumption is that the sprayer operator’s typical ratio of formulated product to carrier is appropriate. We need a starting point for adjusting the amount of pesticide per unit planted area, and unless the label specifies a concentration (i.e. a ratio of formulated product to water) or a minimum amount of product per planted area, this is a reasonable starting point. The appropriateness of this assumption is evidenced by a history of satisfactory pest control in the orchard.

    The second assumption lies in defining a threshold for sufficient coverage, and this is a real challenge. Applications can be concentrate or dilute. Some products translocate in the leaf or redistribute on the leaf surface while others do not. Even the droplet size employed (e.g. A mist blower’s fines compared to Medium-Coarse droplets produced by an air induction nozzle) will affect dose, bioavailability and how long residues are active. So, how does one draw a universal line in the sand and say “this much is enough”?

    Our threshold for suitable foliar coverage has evolved through experience, literature review and independent experimentation in several countries and in multiple 3D cropping systems. We propose 10-15 % surface coverage and a minimum of 85 droplets per cm2on a minimum 80% of the canopy. This standard is intended to be practical, versatile and robust in order to safely represent sufficient coverage for most foliar insecticides and fungicides. It is not suitable for ultra-low volume sprayers (e.g. misters, foggers, air-shear), nor is it intended to be a rigorous, scientific absolute.

    For example, a drench application, such as streptomycin or dormant oils, will obviously require more coverage. Plant growth regulators like thinners, stop-drops and foliar nutrients have their own unique criteria. Products that work through vapour redistribution (e.g. some forms of sulfur) and bio-rational products have a minimal dose threshold that must be ensured per planted area, no matter the water volume used. In these cases, Crop-Adapted Spraying may not be appropriate.

    So while it is the nature of models that they may not hold in every situation, this threshold has proved successful in multiple Ontario apple (later in this article) and highbush blueberry operations.

    The method

    The method is a simple and iterative approach that allows growers to adjust the product rate and sprayer output in relation to canopy and sprayer effects on deposits. Follow these steps to adjust the sprayer and optimize coverage. Only do so in conditions you would normally spray in.

    Step 1

    The sprayer should receive all seasonal maintenance prior to first use and undergo a visual inspection before each spray day.

    Step 2

    Park the sprayer in an alley between rows of trees and tie 25 cm (10 in) lengths of ribbon along the air outlet. That would be the deflectors on a low profile axial sprayer, the hubs of multifan systems or the ducted outlets on towers. Turn on the air and extrapolate where the air is aimed. Adjust the air to just overshoot the top of the canopy.

    Step 3

    It is important that the spray slightly overshoot the canopy height. It is less important to spray the lowest point of the canopy as secondary deposition tends to provide sufficient coverage. This may change if fruit weighs down the branches. Ensuring a full swath, turn off any nozzles that are not required. For small and medium canopy sizes, consider using air-induction hollow cones in the top positions of each boom to reduce drift. You may have to increase the rate in those positions to compensate for the fact that nozzles producing larger droplets produce fewer droplets.

    Step 4

    Affix 25 cm (10 in) ribbons to the upwind and far side of one or more trees. At minimum, affix them at the treetop and along the widest portion of the canopy. With the tank half-full of water, drive past in the spraying gear at the ideal RPMs with the air on. A partner in the next alley should see the highest ribbon move. Ideally the other ribbons will waft as well, but in large, dense canopies they may not. In this case, ensure leaves are moving beyond the trunk. No ribbons should strain straight-out.

    This will determine if more/less air is required from the airblast sprayer. The operator can change fan speed (e.g. fan gear), or adjust the sprayer’s travel speed. Lower speed causes air to go higher and deeper and vice versa. In some cases, operators can reduce fan speed by reducing the tractor PTO revolutions by gearing up and throttling down. When air is corrected, determine ground speed in the orchard using smartphone GPS app or a calibration formula.

    Step 5

    Place and interpret water-sensitive papers per this article. If coverage is excessive, reduce output in corresponding nozzle positions (by replacing them with lower rate nozzles). If you see less than ideal coverage, increase the nozzle rates in those positions.

    Be aware that excessive coverage may be unavoidable in the outer edge of the canopy, given that spray must pass through to get to the centre. It is not unusual to see half the deposition mid-canopy when the outside is saturated. Also be aware that ambient wind speed and humidity have significant impacts on coverage. Therefore, only test coverage in conditions similar to your typical spraying conditions.

    Step 6

    When the canopy grows and fills in sufficiently (usually after petal fall), you may have to reassess coverage to reflect a larger, denser canopy with more surface area. Given the critical nature of early season fungicide applications, it may be preferable to have slightly excessive coverage early season and allowing it to self-correct as the season proceeds. If you are suspicious that the spray is being stretched too thin or you are unsatisfied with the coverage, increase the output.

    For high density trees, there may be no need to increase output mid-season. Early in the season, wind travels relatively unimpeded in a high-density orchard and will blow spray off course, reducing coverage and requiring higher water volumes or possibly more air to compensate. As the trees fill in, the average wind speed is reduced and more spray can impact on the target.

    Mixing and Work Rate

    When the correct sprayer settings and volumes have been determined, the operator will mix their spray tank as they would for their typical application. The sprayer will likely cover more orchard than it has in the past, and the operator will have to re-assess how many tanks are required pre and post petal-fall. If your sprayer is employs conventional hydraulic nozzles (that is, it is not a low-volume sprayer), it is not advisable to go below 400 L/ha (~40 gpa).

    This is where OrchardMAX (the free CAS calculator app) can help the operator ballpark the correct rates for each nozzle position and estimate work rate, tanks required, and any potential savings in product.

    Yes. There’s an app for that.

    Apple Orchard Case Study

    Three Ontario apple orchards (and one Nova Scotia orchard) agreed to test the model. A block of trees was randomly selected from each operation to serve as the treatment condition. These trees received spray according to the CAS model. The rest of the orchard was sprayed according to the grower’s traditional methods. The orchards included several varieties and represented both semi-dwarf and high density plantings.

    OrchardTypical spray volume (Control)CAS spray volume (Treatment)% SavingsVarieties (age)Orchard StructureYears in study
    Orchard 1486 L/ha373 L/ha23%Gala + g. Del (~10 yr old)High density3
    Orchard 2748 L/ha478 L/ha &

    608 L/ha = 543 L/ha

    28%Macs + Empires (~30 yr old)Semi-dwarf3+
    Orchard 3577 L/ha

    (660 L/ha)

    407 L/ha39%

    (38%)

    Gala + Fuji (~20 yr old)High density2
    Nova Scotia544 L/ha416 L/ha33%Jonogold (~10 yr old)High density1+

    According to the model, each grower sprayed anywhere from 20-35% less per hectare in the CAS block than in their traditionally-sprayed block. In many cases, the overall canopy coverage was improved in the CAS block compared to the traditional method simply by aiming formally wasted spray into the canopy, and reducing volume in those areas that were unnecessarily drenched.

    A scout was dispatched to monitor insect and disease activity each week for ~15 weeks. They observed a typical IPM scouting protocol and were not informed which block was the traditional control and which was CAS treatment. Data was transformed where appropriate for analysis of variance. In almost every case, there was no significant difference in counts between the CAS treatment and the grower’s traditionally-sprayed control (p=0.05). In those few cases where a pest had higher counts in the CAS block, the counts were so far below a spray threshold as to be insignificant.

    If we look more closely at the three (of 128) ANOVA comparisons of control to treatment, we see that economic thresholds are rarely an issue, and essentially, difference between control and treatment are moot.

    2015_TSSM_O1_Y2
    2015_ERM_O1_Y3
    2015_ERM_O1_Y2

    This study was repeated over three years. Having examined the data to determine if three years of optimized doses had any effect on pest populations, results suggest no such effect.

    Apples were randomly sampled for destructive analysis at harvest and the total counts of any and all damage are shown below. This is simply a tally, and no statistical significance is implied. Note that Orchard 3 was only involved in the study for two years, and unfortunately a killing frost destroyed their harvest in their second year, so we didn’t have much to harvest.

    Apple_data_3_years

    An important part of knowledge transfer is whether or not growers will choose to adopt a method once the instructor is gone. By year two the biggest challenge was ensuring the orchardists in the study continued to spray the control block at their traditional volumes! They were more than willing to adopt the method wholesale and all three did so starting in 2016. Further, colleagues in Nova Scotia performed their own CAS trial for two years, and reported no significant difference in pest activity or apple quality. They accomplished this simply by following a written protocol.

    The orchardist’s enthusiasm, the ability for the study to be replicated without my direct involvement, and the successful results speak to the viability of the method.

    We would like to thank the researchers that developed the methods CAS is based upon, statistician Behrouz Eshani, the orchards that cooperated in the study, my OMAFRA colleagues and the OMAFRA summer students that scouted those orchards for three years.

    More information

    This method of application is really no more sophisticated than the pro rata practice of turning off nozzles that are aiming at the ground or above the target. It will take time for operators to get comfortable with the new volumes (and potentially reduced dosage) and regular scouting is highly encouraged to confirm they are achieving control.

    The maintenance, calibration and operation of an airblast sprayer is an involved process. Collectively, the sprayer setup, weather and crop morphology all influence the coverage obtained from an application. A fundamental understanding of application technology is required before attempting to optimize dosage using the CAS method. We suggest grabbing a copy of the second edition of Airblast101 – Your Guide to Effective and Efficient Spraying. The digital version is a free download, but you can buy a hardcopy as well.

    Finally, take a few minutes to watch this video by AAMS-Salvarani. In many European countries such as Belgium , France and Germany, sprayers must be calibrated regularly. While there is no mention of air speed adjustments, many of the steps in this video correspond with the airblast adjustments relating to Crop-Adapted Spraying.