This case study is taking place on a 15 acre highbush blueberry operation in southern Ontario. In 2016, considerable pressure from spotted-wing drosophila (SWD) prompted the growers to make changes to their crop management practices and their spray program. They employed a three-pronged approach to improving crop protection:
- Significant changes to canopy management and picking / culling practices
- Investing in a new sprayer
- Adopting the Crop-Adapted Spraying (CAS) method of dose expression
We have been tracking pesticide use, water use and yield compared to historic values. We also monitored spotted-wing drosophila catches both in crop and in wild hosts along the border of the operation for three years.
Canopy Management
In 2016 the operation made the following changes to their canopy management practices:
- They performed their first-ever heavy pruning and planned to to maintain an ideal crop density by removing ~30% plant material annually. This more-or-less took place.
- They regularly collected and buried culled and dropped berries.
- They picked cleanly and more frequently.
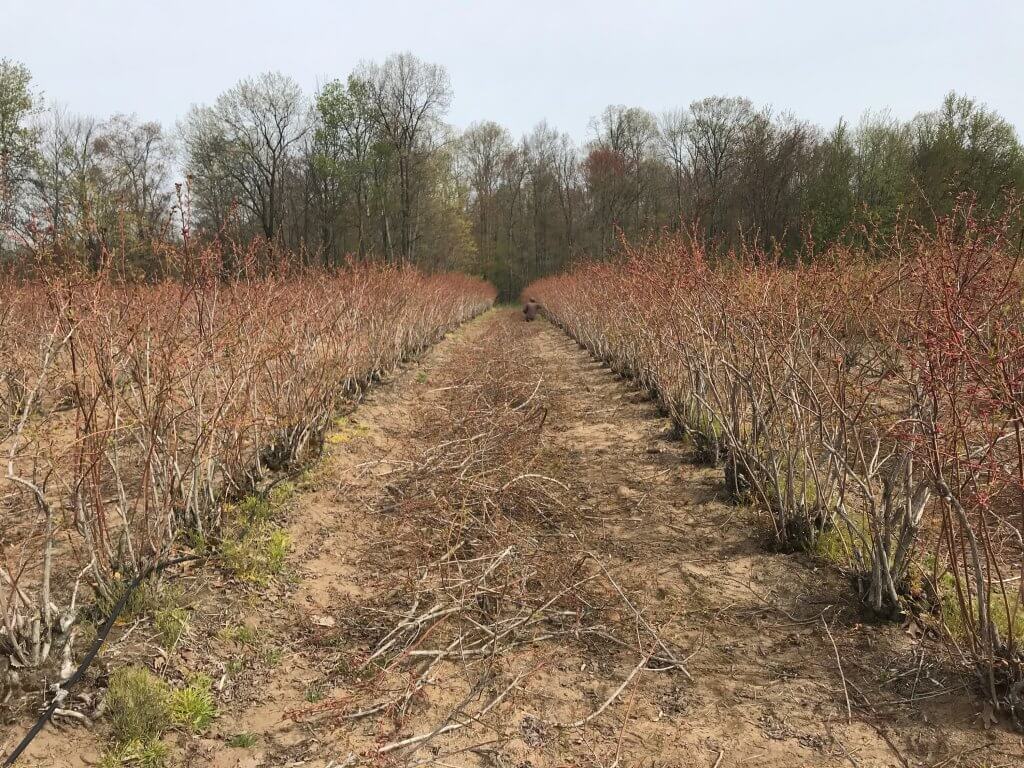
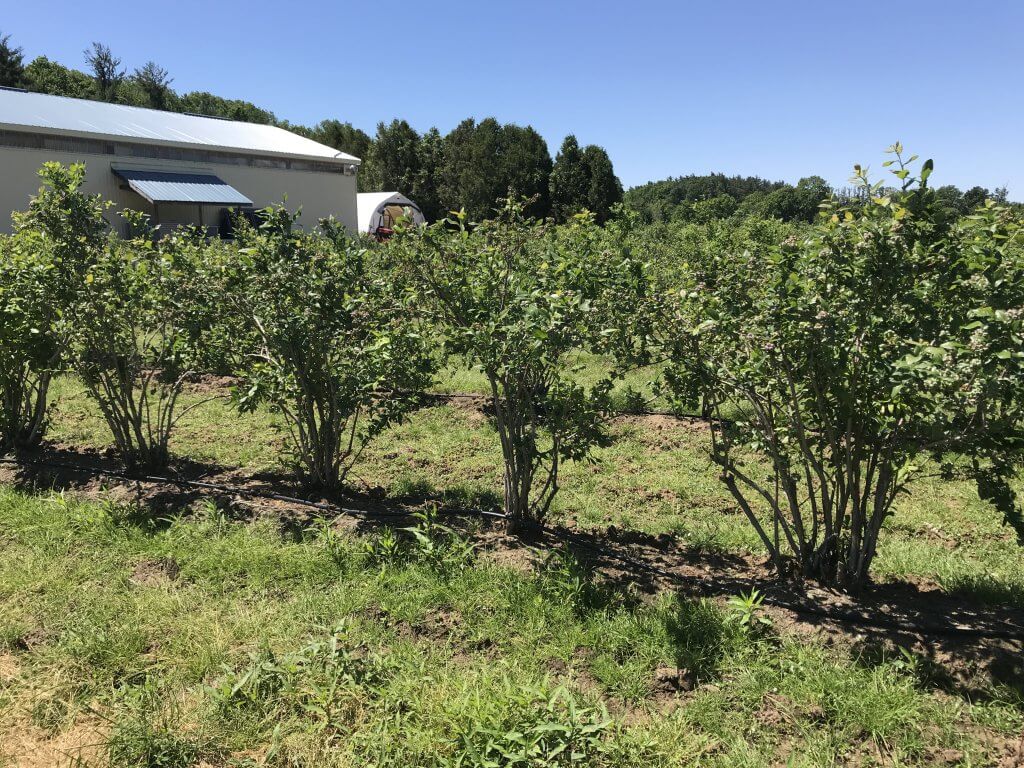
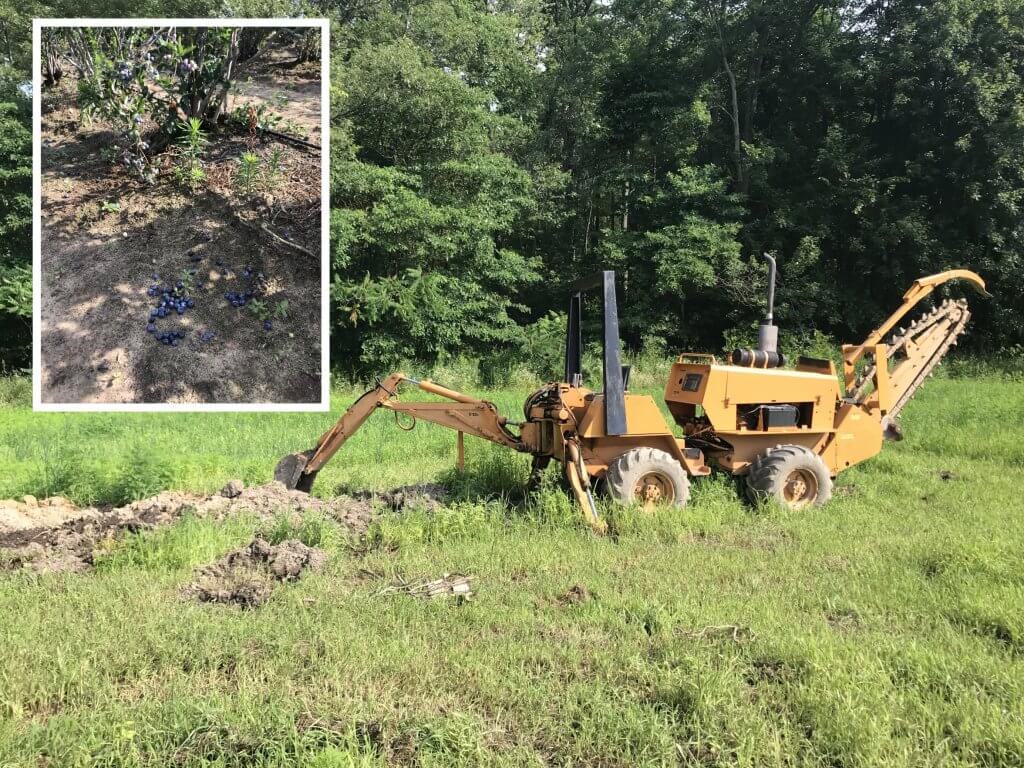
There were initial concerns that such dramatic pruning would reduce production per acre and require trellising to prevent berries weighing down the smaller bushes. However, in 2017 (and thereafter) they found that the quality of the berries was greatly improved and noted fewer hours spent culling berries during packing. Financially, the growers felt they came out ahead.
Application Technology
In 2018 they replaced their old, inefficient KWH sprayer with a low profile axial with conventional hydraulic nozzles to permit greater control of the spray. The KWH design was intended for standard fruit trees. It produced >100 mph air and an Extremely Fine spray quality and was therefore a bad fit with the planting architecture and canopy morphology of highbush blueberry.
They considered a cannon-style sprayer hoping to spray multiple rows in a single pass but given the desire for improved coverage and reduced waste, they elected to drive every row using a low-profile axial.
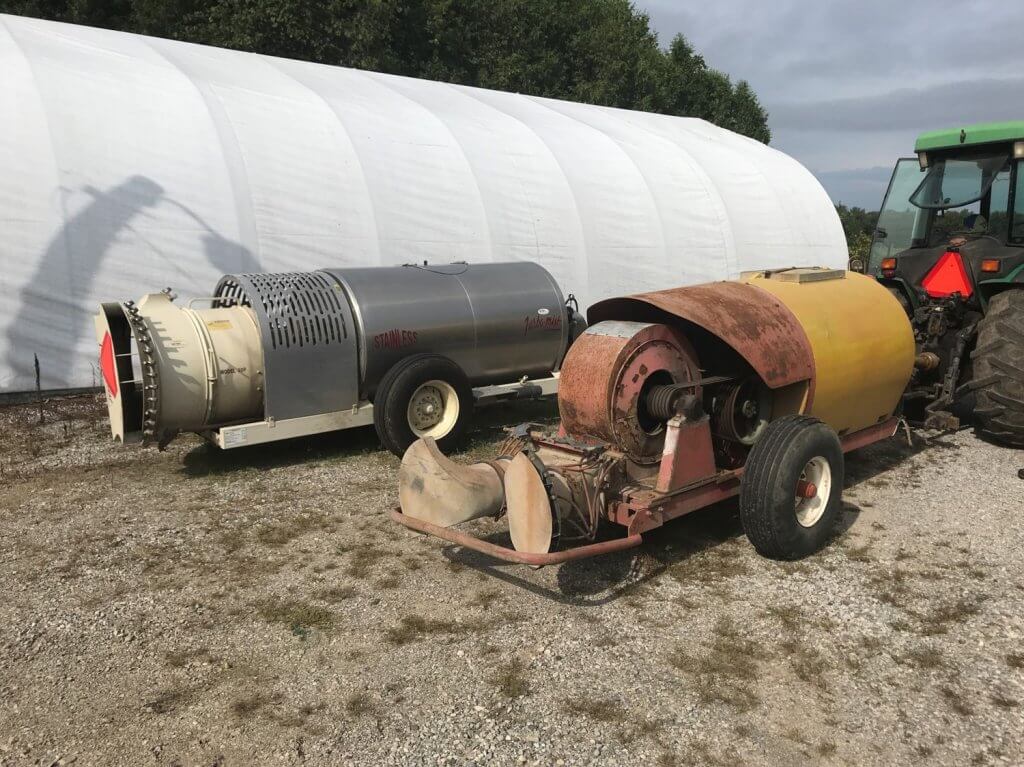
The new sprayer was more reliable, quieter, and more fuel efficient. Further, the old sprayer leaked and the air-shear nozzles did not respond when shut down at the end of rows. Eliminating these sources of waste represented a savings of ~20% of the spray volume traditionally used per acre.
Crop-Adapted Spraying
The redundancy inherent to product label rates for three-dimensional perennial crops has long been recognized. In response, rate adjustment (or dose expression) methods have been developed to improve the fit between rate and canopy coverage (e.g. Tree-Row Volume, PACE+, DOSAVIÑA). Each has value, but their adoption has been slow because they are region- or crop-specific and they can sometimes be quite complicated.
CAS lends structure and repeatably to the informal rate adjustment methods already used to spray three-dimensional perennial crops (e.g. Making pro rata changes by engaging/disengaging nozzles in response to canopy height or altering travel speed in response to canopy density).
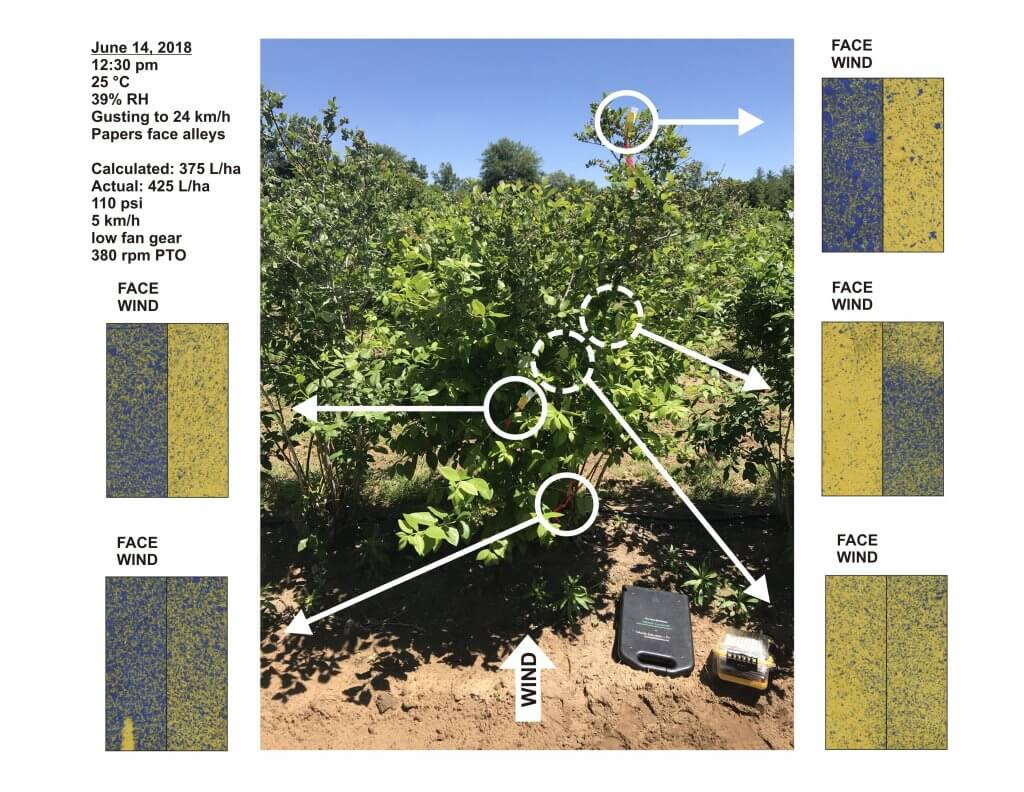
The CAS method relies on the use of water sensitive paper to confirm a minimal coverage threshold of 85 deposits per cm2 as well as 10-15% area covered throughout a minimum of 80% of the canopy. Using this protocol, we calibrated air energy and direction, travel speed and liquid flow distribution. This process is covered in detail here and in the new edition of Airblast101. In that first year we reassessed coverage every few weeks between April and June using water-sensitive paper.
Spray volume / Pesticide
By matching the sprayer calibration to a well-managed canopy, the growers were able to go from ~1,000 L/ha to ~400 L/ha of spray mix. The ratio of formulated product-to-carrier remained the same, but less spray was warranted per acre. Stated differently, the grower mixed the spray tanks per usual, but drove further on a tank.
This also saved an estimated 15 hours of filling/spraying time per year, which translates to reduced operator fatigue and exposure as well as reduced manhours and equipment hours.
The decision of what and when to apply was at the growers’ discretion. Chemistry was rotated and applications were made according to IPM in early morning (if there were no active pollinators) to avoid potential drift due to thermal inversions. The following image shows what those papers looked like in June of the first year.
Note how little spray escapes the target rows in the following video. The wind was too high for spraying, but we were only using water and saw it as an opportunity to test a worst-case scenario. Air-induction hollow cones were used in the top nozzle position on each side so droplets were large enough to fall back to ground if they missed the top of the canopies.
SWD monitoring
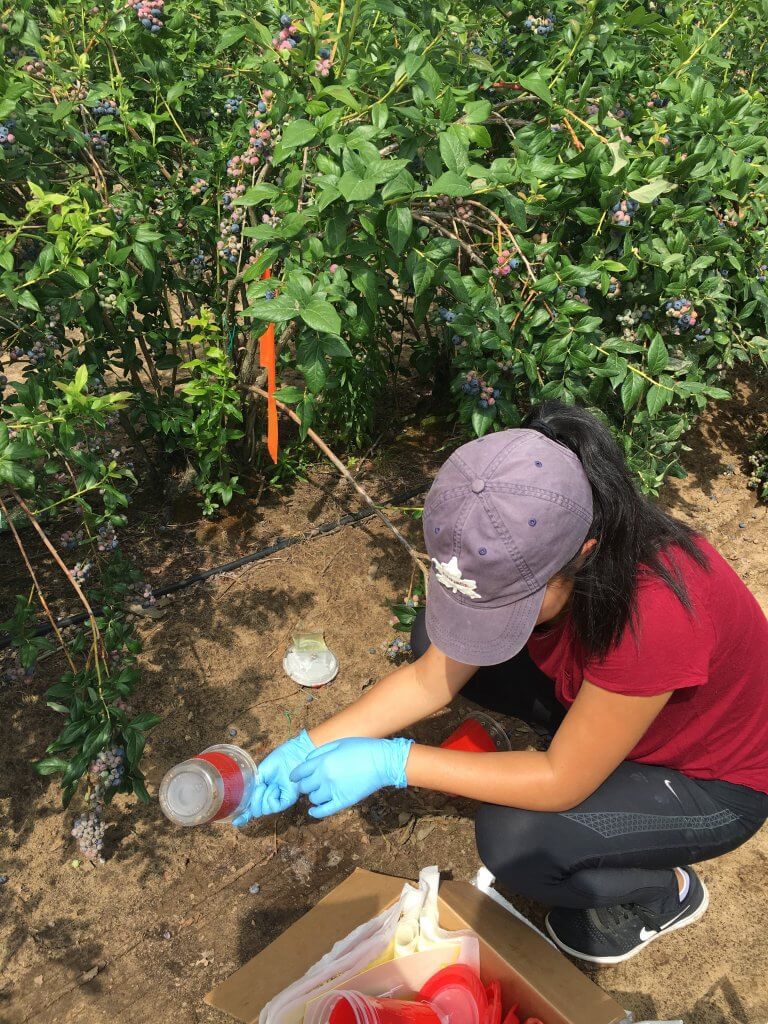
SWD represents a serious economic threat to blueberry operations. Traps were placed in the operation (three in the crop and one in an unmanaged wild host along a treeline) and monitored weekly. Traps were also placed in surrounding horticultural operations which were employing standard pest control practices. This not only provided regional information about SWD activity but allowed us to compare the level of SWD control from the Crop-Adapted Spraying approach.
- In 2018 the comparison included up to 16 other sites that were berry and tender fruit.
- In 2019 the comparison included 10-12 sites (depending on the week) and they were berry and tender fruit sites.
- In 2020 the comparison included 4 other sites (blueberries, raspberries and cherries).
2020 & 2021 – Covid 19 and Heavy Rain
In agriculture, every year is an adventure, but 2020 and 2021 were exceptionally difficult and the circumstances should be considered when deciphering the results. Covid-19 has had a significant impact on global agriculture.
In 2020, fearing a reduction in the availability of seasonal labour, the operation pruned their bushes heavily. This was done to reduce the yield in order to make harvest manageable.
In 2021, labour was once again secure. Given the heavy pruning the year previously there was no need to prune again, so the crops densified. This coincided with abnormally high levels of precipitation to create significant anthracnose issues. Additional fungicide applications took place that raised costs, but the grower maintained CAS-optimized rates and sprayer settings.
Quantitative Results
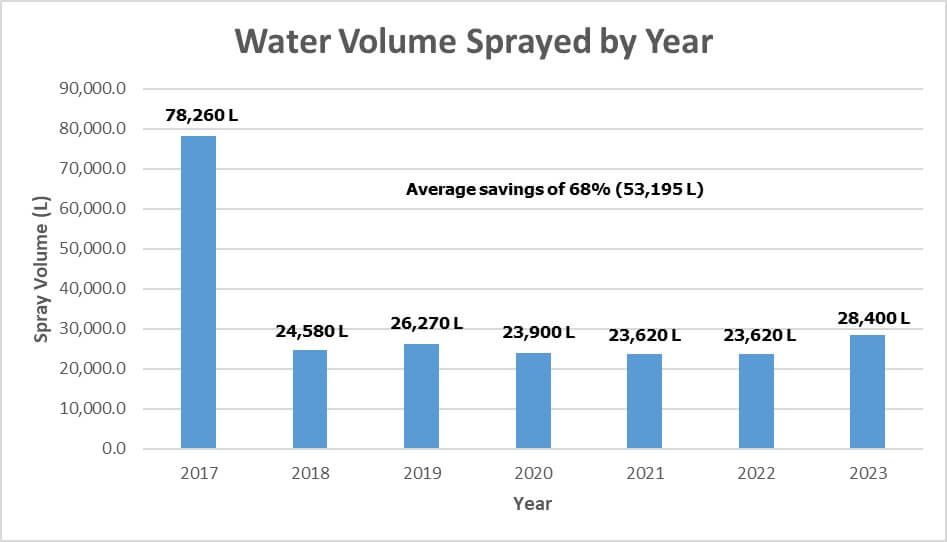
Prior to replacing their sprayer, and adopting CAS, the operation sprayed about 78,260 L/yr. Their average savings in spray volume (water) has been 53,195 L/yr, or 68%.
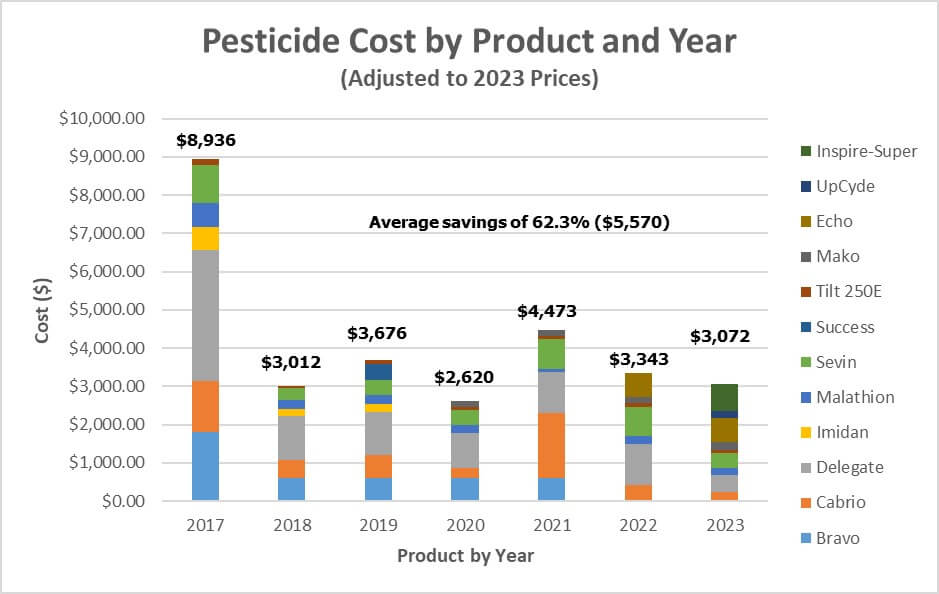
In terms of pesticide savings, we compare each year to the 2017 baseline. In order to make for a fair comparison, we update pesticide prices each year using current costs. Therefore, the 2017 total has increased by about $2,200.00 (wow). Their average savings represents $5,570.00 CAD/yr or 62.3%.
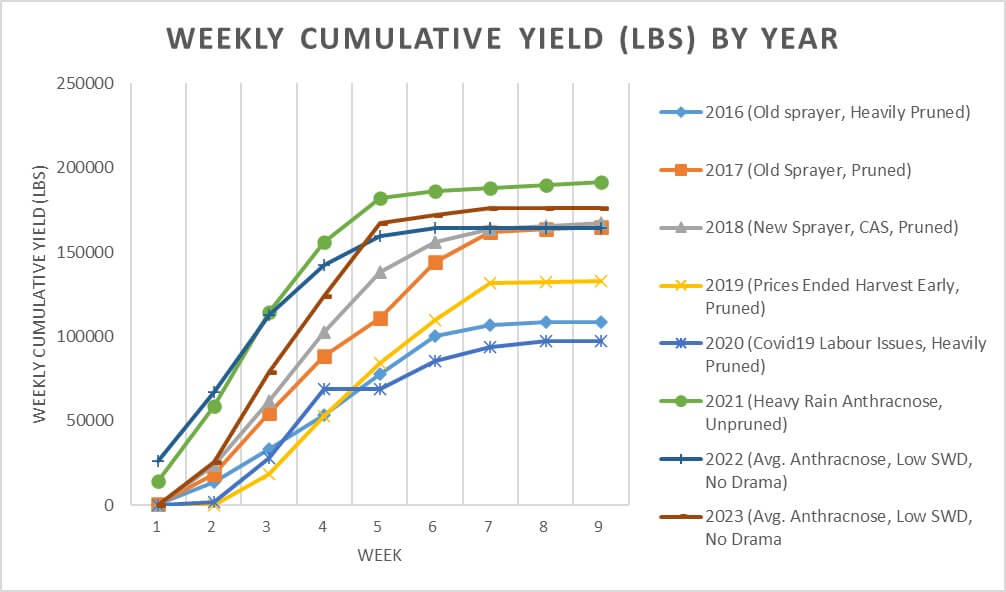
Yield is more difficult to interpret due to mitigating circumstances in 2019 and 2020:
- In 2016, prior to any changes, they harvested 12,076 flats (about 9lb of fruit each).
- In 2017, following the canopy management changes, harvest increased to 18,335 flats (~50% increase).
- In 2018, using CAS, harvest was essentially unchanged compared to 2017, which was excellent.
- In 2019, harvest started a month late compared to previous years. Further, blueberry prices were low, and the operation elected to stop harvesting a month early. However, when those issues are factored in, the harvest was comparable.
- 2020 was particularly challenging for agriculture and with the possibility of reduced labour due to the pandemic, the operation elected to prune heavily and reduce their yield.
- 2021 saw unpruned bushes (following the heavy pruning in 2020) and abnormally high levels or precipitation which created anthracnose issues. As a result, more applications were made than any other year on record, but maintained the CAS-optimized rates and sprayer settings.
- 2022 was (thankfully) fairly typical. Low SWD, average anthracnose and no drama.
- 2023 was very much like 2022 with low SWD, average anthracnose and no drama.
Trap counts for SWD were only performed during three years of the CAS study, so we are only able to present 2018-2020 data. It should also be noted that while the presence of SWD in an operation represents an impact on yield, there is not necessarily a correlation between the number of SWD captured the amount of damage.
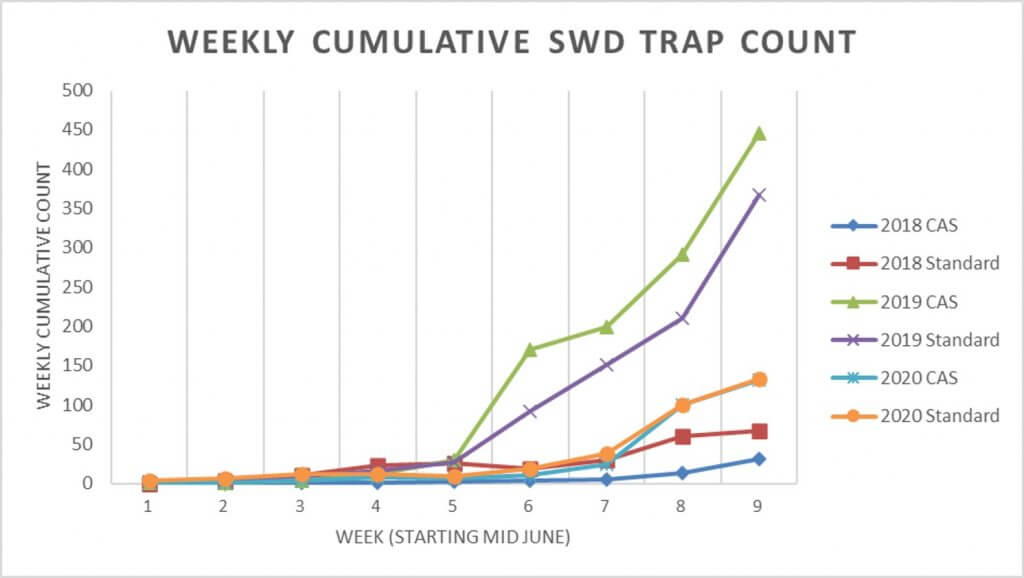
In 2018 and 2020, average counts were higher in the surrounding operations employing standard practices (STD) compared to the CAS trial. In 2019, average counts were higher in the CAS trial. When total average counts are compared, the difference is negligible. Berries were tested regularly by the growers and the damage due to SWD was within acceptable limits. It should also be noted growers monitored and reported satisfactory disease control throughout the study.
We have not applied any statistical rigor, but the trend suggests that the level of control provided by the CAS method was comparable to conventional methods. This conforms with our previous results in Ontario apple orchards and similar evaluations of optimized application methods world wide.
Qualitative results
Beyond the quantifiable results, the growers reported qualitative benefits:
- Customers of the U-pick portion of the operation regularly enquire about pesticides. The operation’s reduction in pesticide use became a positive speaking point and aligned with the grower’s philosophy about reduced environmental pesticide loads.
- While many blueberry growers experienced a market shortage of certain fungicides in 2018, this operation returned unused product to the distributor.
- Growers reported less early-season disease damage, which saved considerable time on the packing line because there was less fruit to cull. Disease levels rose to typical levels later in the season, but there was still a net savings in labour.
Conclusion
The success enjoyed in this berry operation was a result of several canopy management and crop protection changes. This is a situation where the whole equaled more than the sum of its parts – it could only be achieved by making holistic changes to the operation. At the end of three years the growers themselves stated:
Based on my experience losing multiple crops to SWD, I can say with absolute certainty it works. <The results are> superior to what I expected. What we are doing is successful.”
Here’s a narrated PowerPoint presentation of this study (includes data up to 2020):
The monitoring portion of this project was funded by Niagara Peninsula Fruit and Vegetable Growers Association, Ontario Grape and Wine Research and Ontario Tender Fruit Growers in collaboration with private consultants.