Tag: fan angle

  • What’s the Cost of Poor Deposit Uniformity?

    What’s the Cost of Poor Deposit Uniformity?

    We’ve heard it often: calibrate your nozzles to be sure your boom output is uniform across its entire width. The downside of poor uniformity is obvious: strips of over- or under-application causing problems with pest control or crop tolerance. A graduated cylinder held for 30 s under each nozzle is the approach of choice. Several electronic versions exist to make the job easier, for example the Spot On.

    But there’s more to the story. Nozzle calibration only ensures volumetric uniformity from nozzle to nozzle. It serves to identify worn, plugged, or damaged nozzles, and little else.

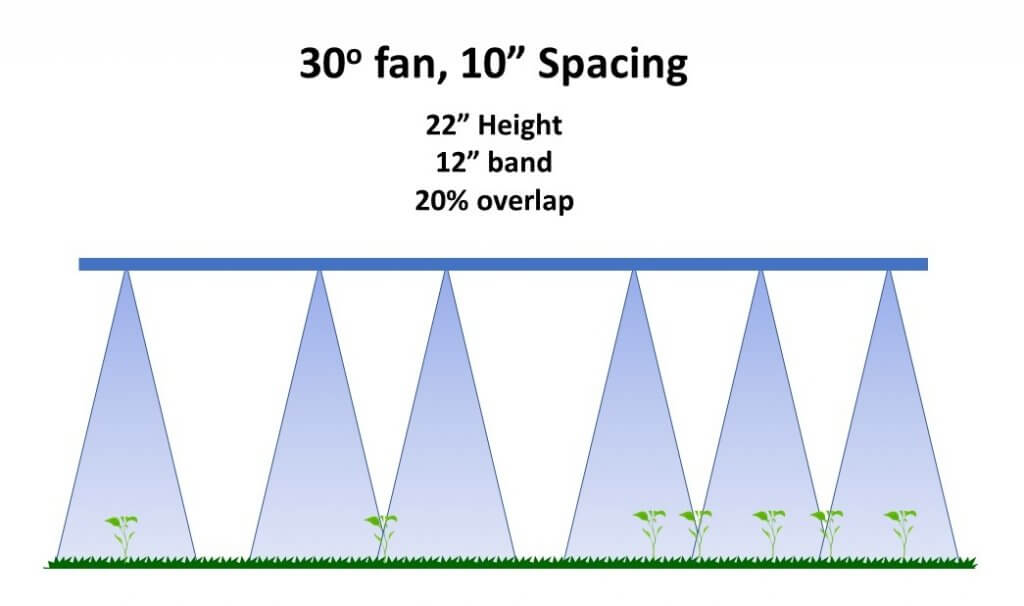
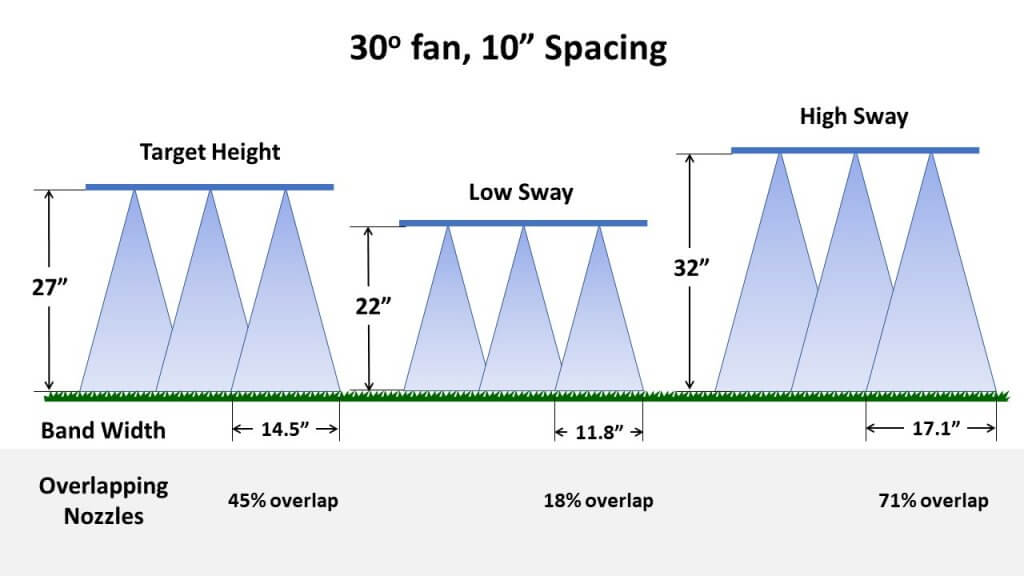
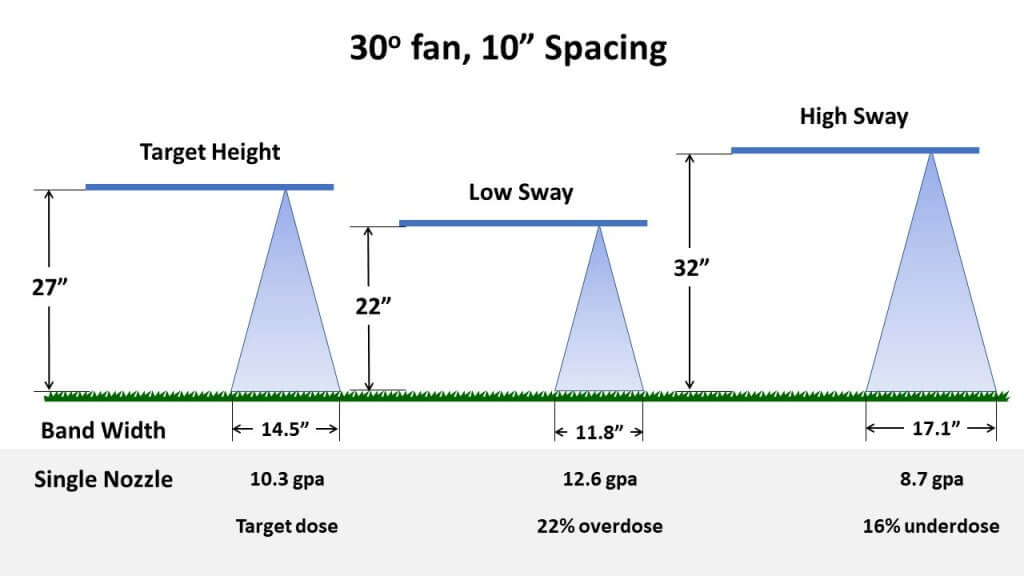
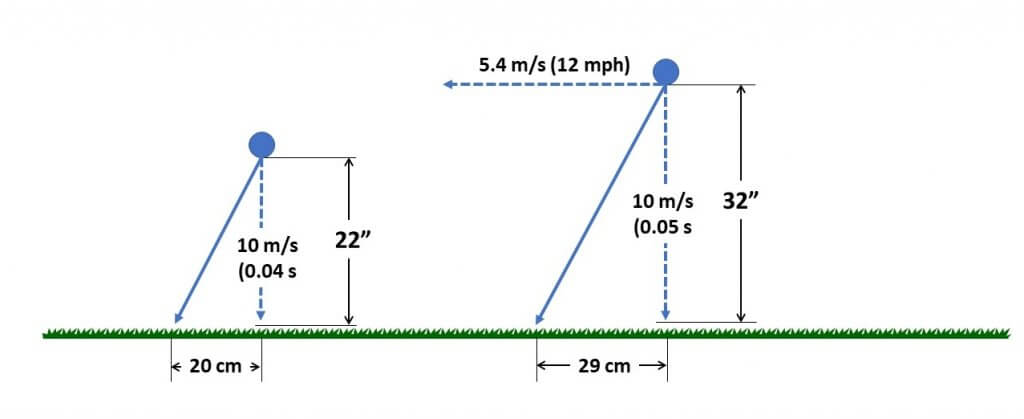
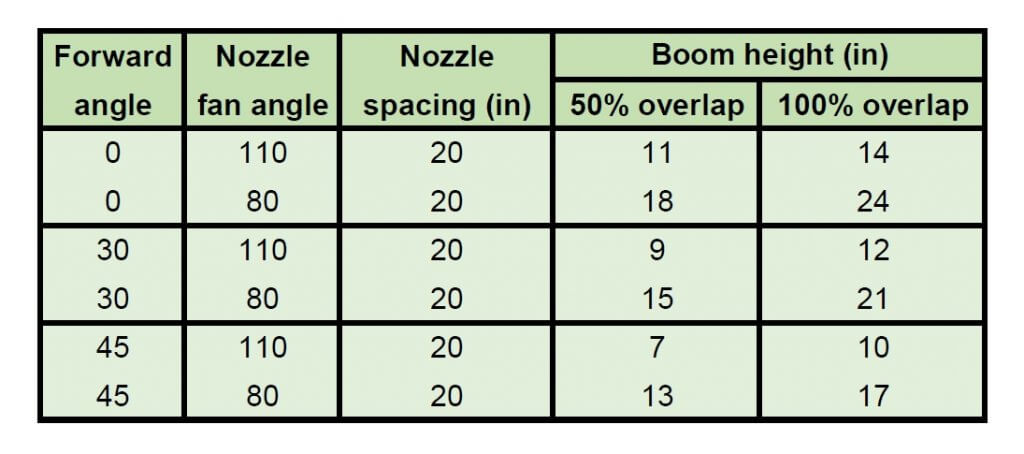
    After release, the spray is atomized and distributed across a wider area with a properly developed pattern. An operator adjusts boom height or spray pressure to generate proper overlap for a given fan angle at the target height. Unfortunately, the uniformity of this pattern can’t be measured with a graduated cylinder, so we’ve traditionally used a “patternator”, a flat collector placed under a few nozzles that uses a series of channels to show the peaks and valleys of the volumetric distribution. Both calibration and patternation are done with a stationary spray boom. Nozzle manufacturers employ both methods to ensure their products meet international uniformity standards before marketing.

    A spray patternator determines the uniformity of a stationary boom’s spray distribution (Photo: TeeJet)

    Burt even that isn’t enough. We can have good volumetric distribution but still have inconsistent coverage in places. To identify those regions, we need a way to measure small amounts of spray deposit under a moving boom, ideally in the canopy we intend to treat. Here we have a few options. We can place a tracer (dye, salt, etc.) in the tank, and collect spray on small collectors placed throughout the area to be treated. We collect the samples, wash them, and analyze the solvent for the tracer. This requires special equipment and takes time. It’s useful, but only measures dose, not droplet size or density.

    Plastic straws can act as collectors of sprays under field conditions.
    Monofilament strings can be used to collect spray over long distances.

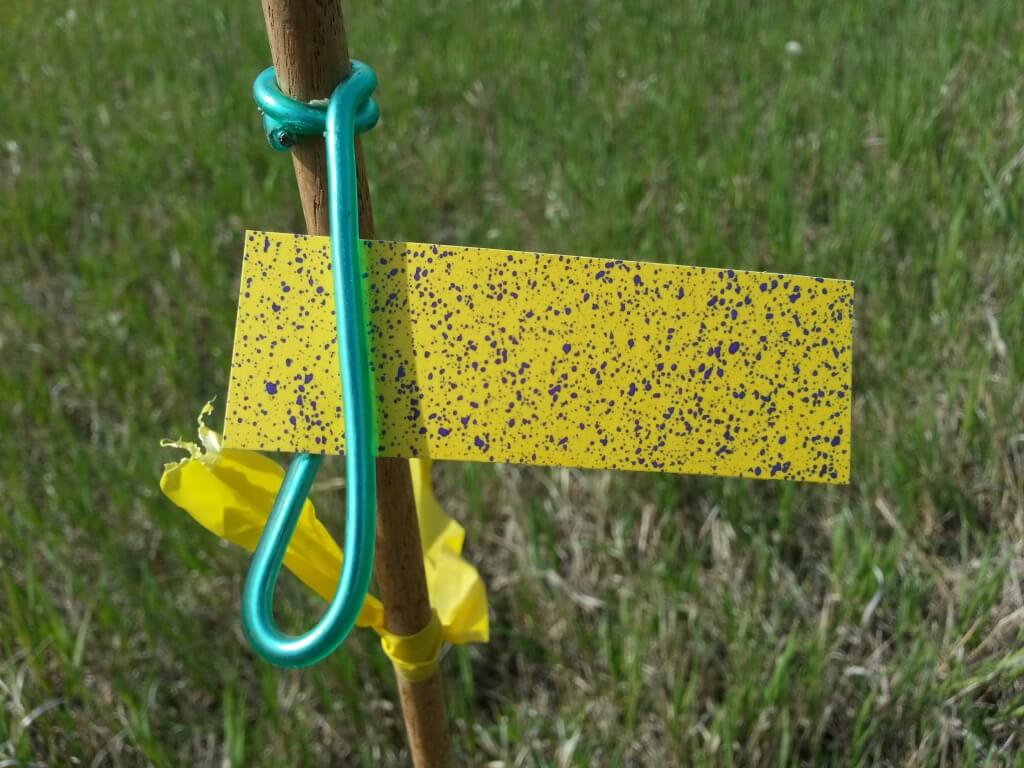
    A faster way is to use water-sensitive paper, about which we’ve written here and here. Using WSP is fast and easy, and it can provide additional information such as the number of droplets per unit area, or the total percent of the area covered, or even the size of the deposits, with the right equipment. We call this “coverage”, and believe this to be one of the two components of good pest control (the other being “dose”, the total amount of material deposited). Because the world isn’t fair, WSP isn’t great at quantifying dose.

    Water-Sensitive paper provides a quick visual indication of the deposit, not just amount but also qualitative aspects such as droplet size and distribution.

    The industry has done a good job of identifying the dose required for good control, and this is reflected in the rate recommendations on a label. But there are a few gaps. They don’t tell us, for example, what “good coverage” is, despite often telling us to “ensure” it.

    Back to Deposit Uniformity

    We quantify deposit uniformity by calculating the Coefficient of Variation (CV) of a series of measurements. The CV is defined as the standard deviation of these measurements, expressed as a percent of the mean value.

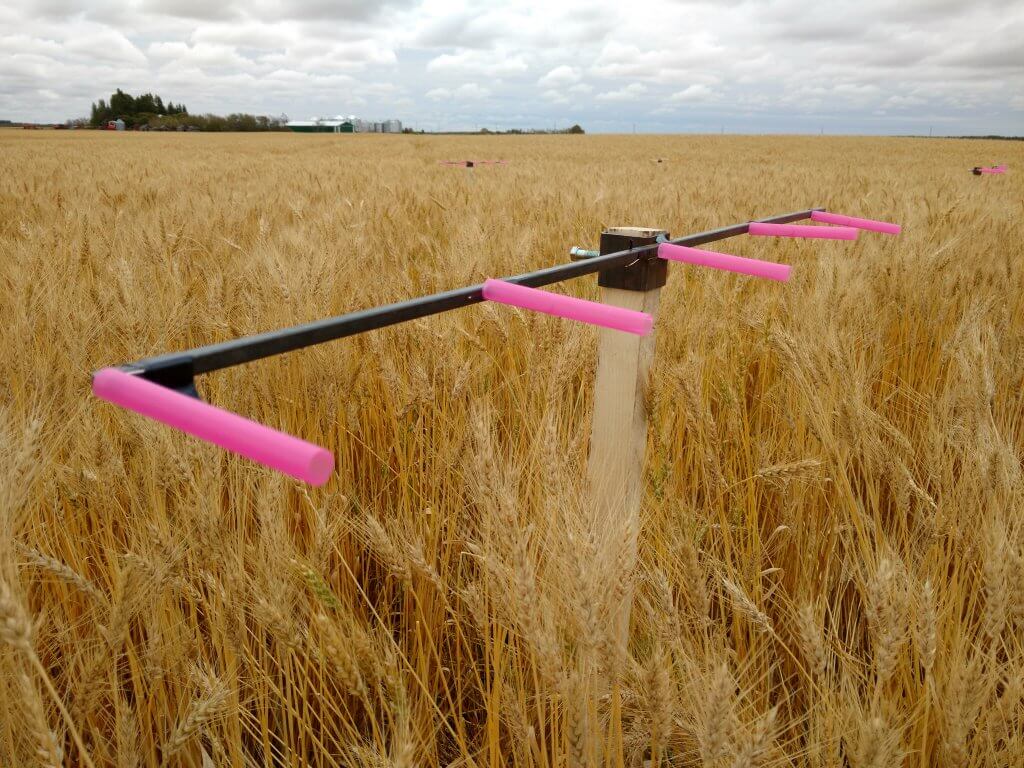
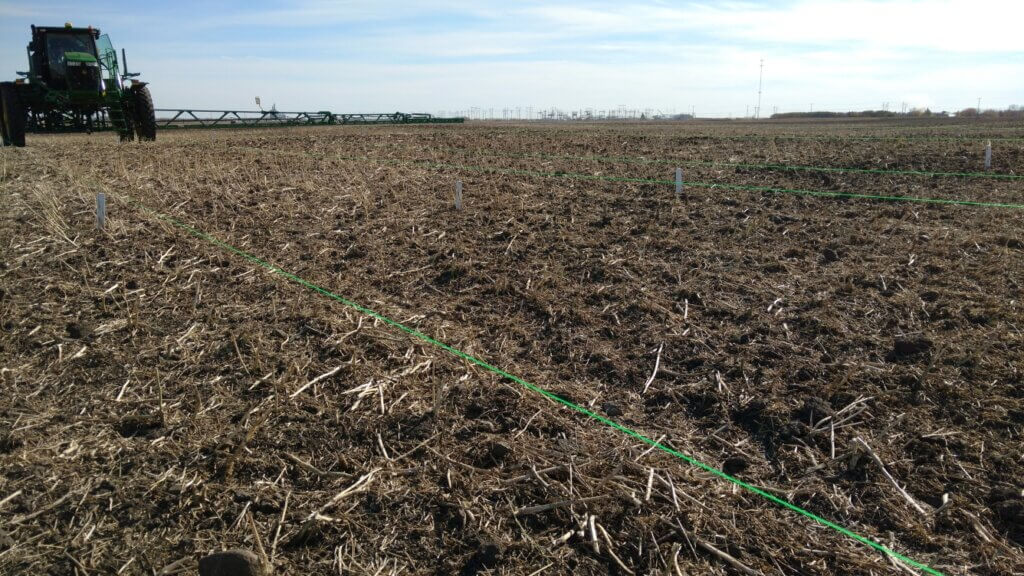
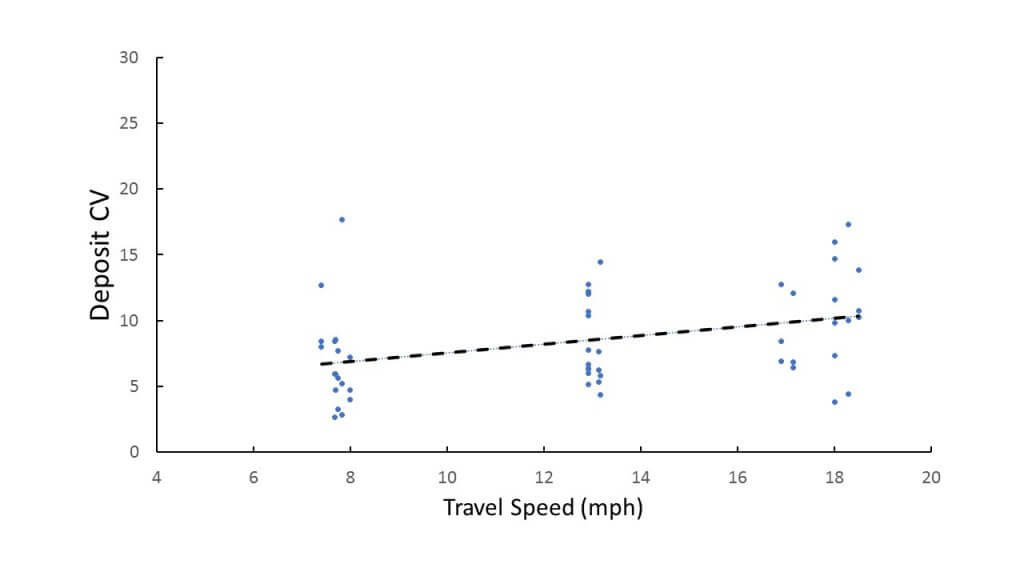
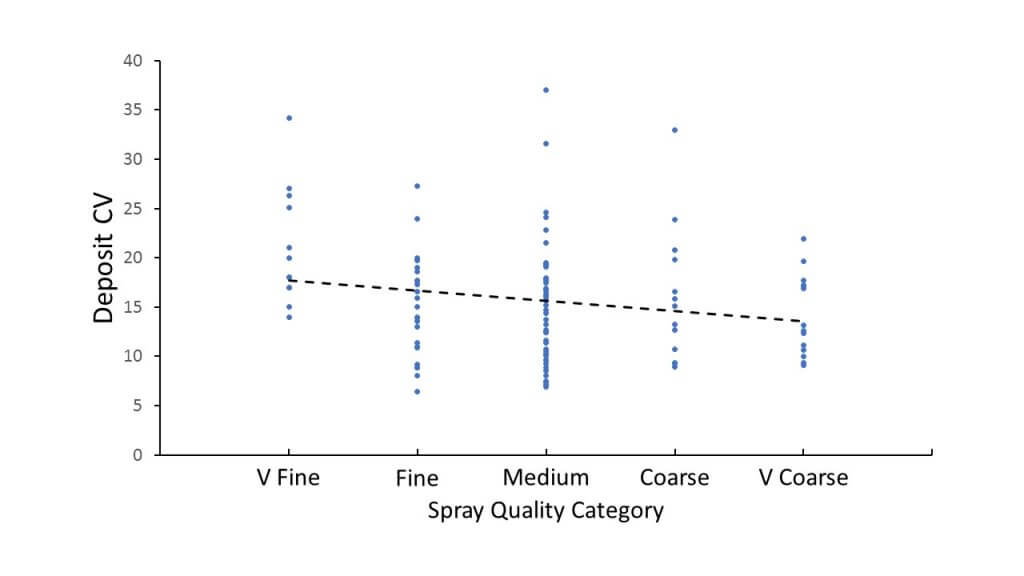
    Because it’s hard to measure, it’s easy to ignore. But here are a few basics our research has told us: (In the first three examples, deposits were measured under a spray boom using petri plate or drinking straw samplers. There was no interference from a canopy. The last example was taken from within a canopy.)

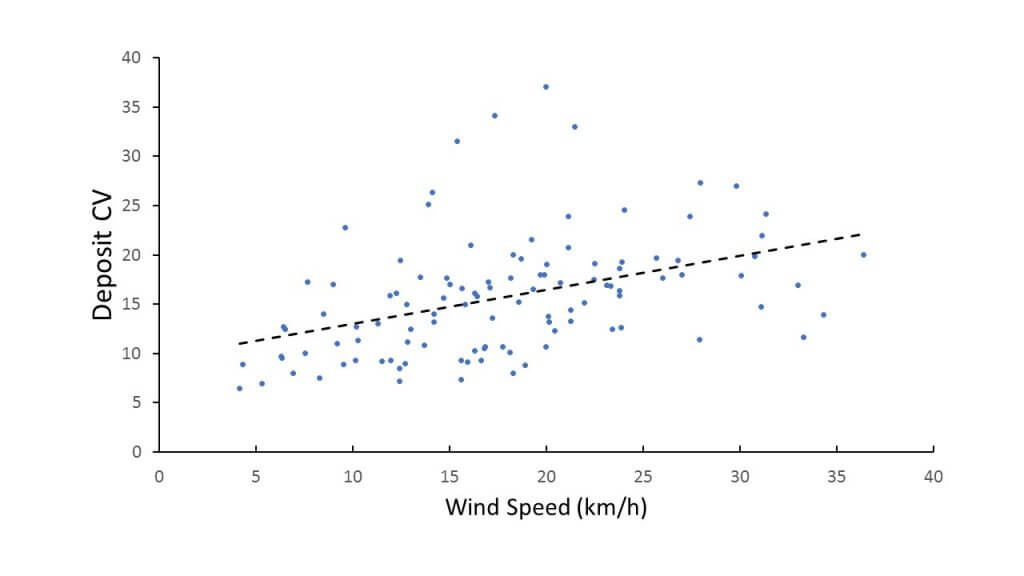
    • When measuring the deposited dose, the CV under a boom tended to rise with increased wind speed. This is no surprise, as it reflects that more wind has a greater chance to displace spray from its intended destination.
    Spray deposit uniformity, observed during various spray drift studies, tended to decrease with higher wind speeds.
    • Higher booms and increased travel speed also tended to increase deposit CV.
    Faster travel speeds during spray drift studies tended to decrease uniformity.
    • Finer sprays tended to increase deposit CV. This makes sense, as the finer droplets are more easily displaced by air movement.
    Coarser sprays created more uniform deposits possibly because they were more resistant to turbulent displacement.
    • Deposits were reduced and became more variable deeper in a broadleaf canopy. Again this makes sense, as there are a lot of obstacles to clear and canopies themselves are by no means uniform.
    Deposit amount was lower in the canopy, as expected. But the lower deposit was also more variable.

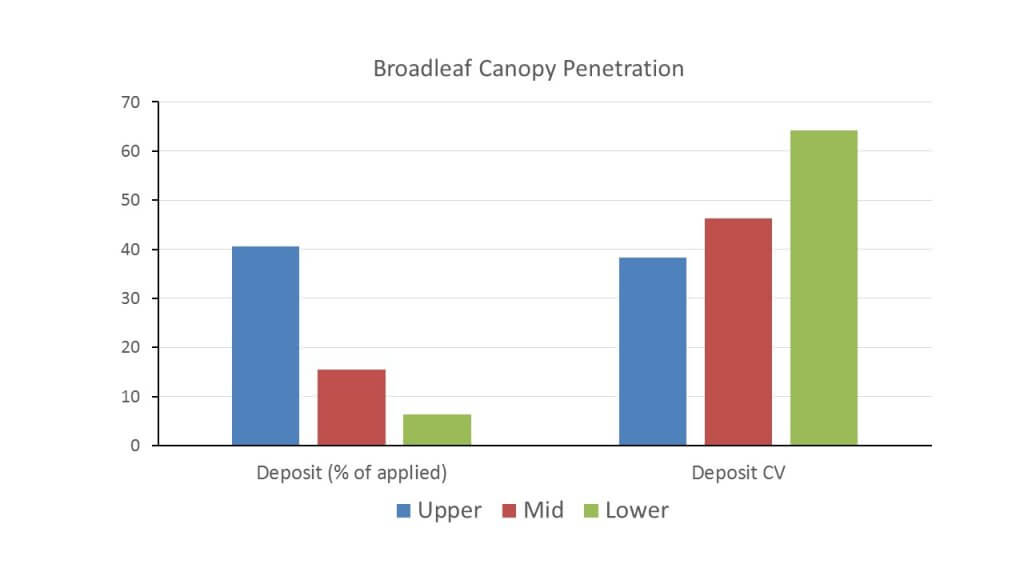
    Also note that the CV in the canopy was quite a bit higher (40 – 60%) than for the exposed targets (10 – 20%). That’s another challenge.

    To recap, the best uniformity was achieved with low booms (as long as patterns overlap sufficiently), slow speeds, low winds, and coarser sprays. It’s easy to see that current spray practice isn’t always conducive to uniform deposits.

    Deposit variability as captured by a 2 mm diameter string with two sprayer configurations.

    So What?

    Why does uniformity matter? It matters because more variable deposits are less efficient. They require higher doses for the same effect as uniform deposits. Here’s why:

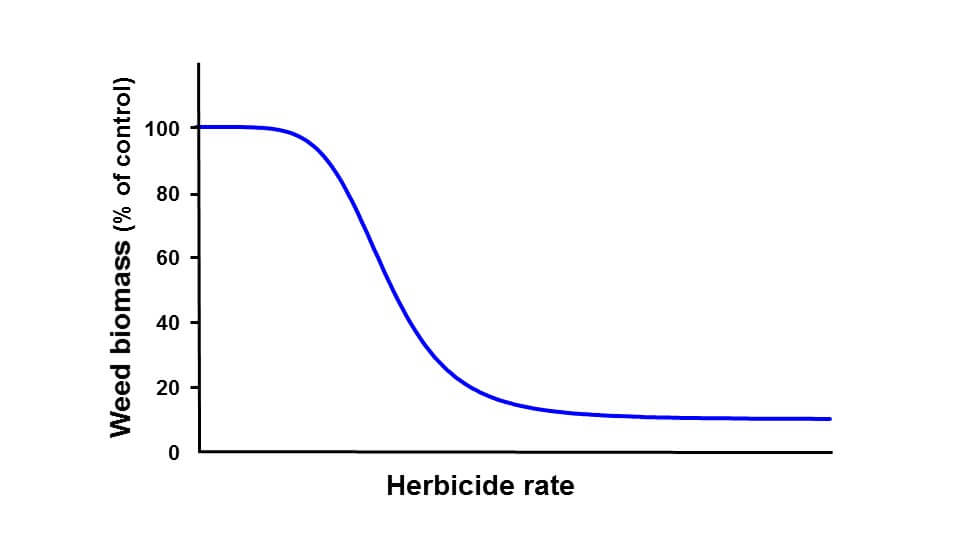
    The figure below shows a typical dose response curve for a herbicide. On the y-axis, we see weed biomass, on the x-axis herbicide dose. At low pesticide doses, not much happens. (In fact, we often see a slight increase in biomass with very low herbicide doses.) As we increase dose, biomass begins to decline, and as dose increases further, the effect begins to taper off. At a certain dose, no further biological response is possible.

    A typical dose response curve for a herbicide.

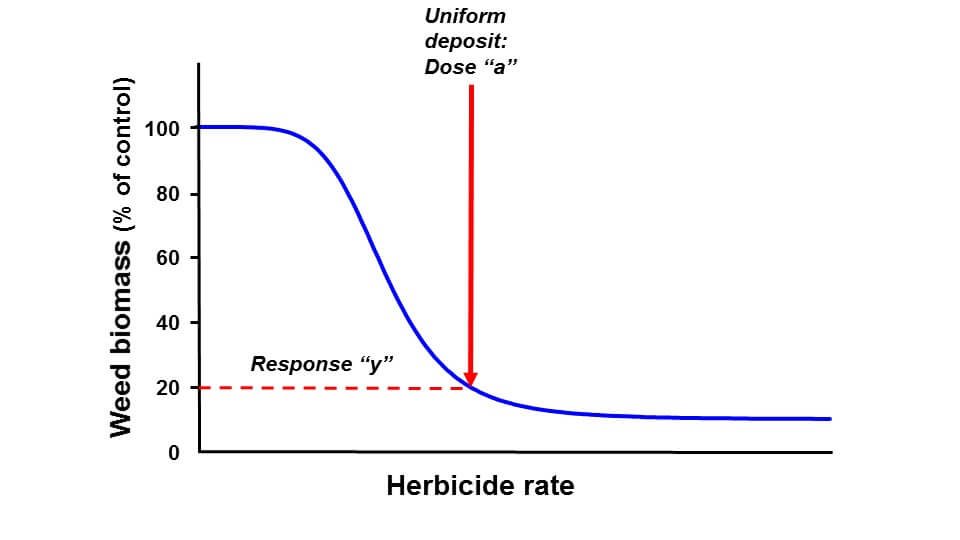
    In the next figure, we see that application of a uniform dose “a” results in biomass “y”, about 20% of untreated.

    A dose response curve represents the weed biomass that resulted from any applied dose.

    Next, we apply the same average dose, but we do it non-uniformly. At some locations under the boom, the deposit may be 40% higher or lower than average. The result is response “z”. Weed control is worse, as bad as it would have been at a lower uniformly applied dose (effective dose “b”).

    A variable dose across a field results in many individual weed biomasses because of deposit variation. The net result is lower control.

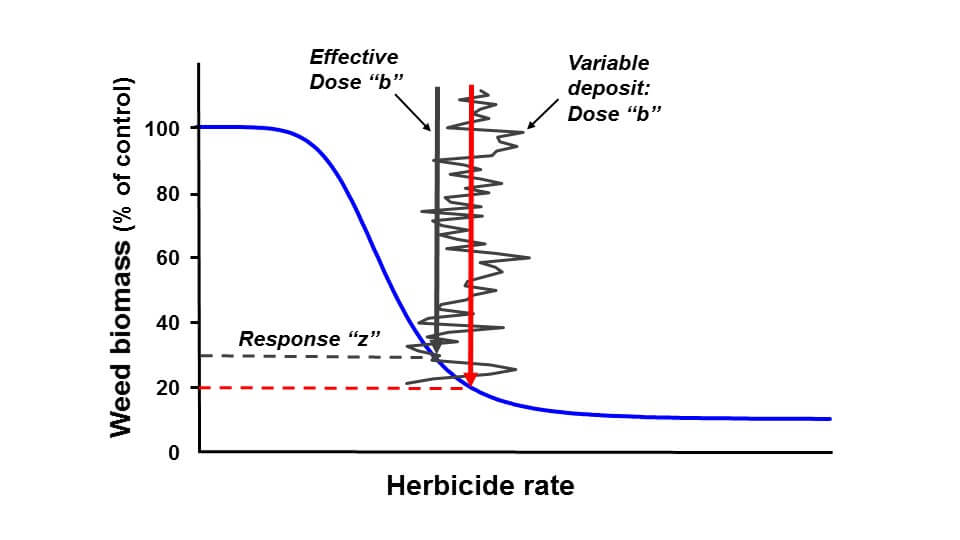
    This effect only happens when the effective dose is near the lower inflection point of the dose response curve. Perhaps we’re shaving rates. Perhaps the weather is challenging the herbicide’s performance. Or perhaps the weed is difficult to control. Under those conditions, any gain in performance with a higher dose is less than the penalty from a lower dose.

    There are two ways to correct this performance loss. One is to apply a higher herbicide rate. It’s commonly done, as insurance against – you guessed it – variability, and it’s one reason why label rates have some flexibility. The second way is to improve deposit uniformity. In effect, better uniformity allows for rate reductions.

    Label rates are typically in the flat region of the dose response curve to allow for variable conditions in weed susceptibility, weed growth stage, growing conditions, and deposit variability.

    Take Home Message

    Uniform spray deposition improves overall control. Our examples used herbicides, but the same is true for fungicides and insecticides. It’s true for field crops as well as fruit and vegetable sprays.

    Uniformity is especially important when the application is done under adverse conditions in which the pesticide performance is challenged. It’s a fundamental part of good application practice.

    It’s not always easy to improve uniformity. But at least it should be measured. Without measuring it, an applicator may never know how much product is being wasted. Have a look at the Crop Adapted Spraying approach Jason is using, it’s a template for all sorts of applications.

    What can you do? The easiest task is to record the flow from each nozzle. The results might be surprising. Ensuring proper and consistent boom height is also important. Using water-sensitive paper to visualize the quality of the job would be icing on the cake. And adjusting application method, with uniformity as a goal…that gets you a gold star.

  • Spray Patterns for Spot Sprays

    Spray Patterns for Spot Sprays

    Spot spraying promises to dramatically cut herbicide use. Data from Green-on-Brown (GoB) sprays suggest at least 50% and possibly 90% savings are possible, depending on weed density and the system employed. These savings are significant. But system performance depends on the nozzle selection even more than for broadcast sprays. What are the issues?

    Pattern Width

    Spot sprays represent a unique mix of single nozzle banding and multiple nozzle broadcasting on the same boom at different times and locations, depending on what the weedy spots require. Both need to be optimized to get the best performance and savings out of such a system.

    Even (Banding) Nozzles

    Let’s say the spot spray boom has a spacing of 10” (25 cm) and is carried by wheels to ensure consistent height. An operator would want the spray pattern to have a very similar width as the nozzle spacing. A 30 degree even fan angle would create a band of about 10” wide at a boom height of 19” (48 cm, download a worksheet that solves this for any fan angle and boom height here). Assuming a travel speed of 12 mph (20 km/h) and a pressure of 40 psi (2.75 bar), an 03 sized nozzle would apply 14.9 US gpa (139 L/ha) in these 10” wide bands.

    But most applicators would be uncomfortable with zero overlap, and would prefer to raise the boom to allow, say, 20% overlap. This would ensure targetting of taller weeds that appear exactly between two sprays, for example. At 22” (56 cm) boom height, the pattern would be about 12” (30 cm) wide and affording 1” overlap on either edge.

    Spot spray booms activate any number of nozzles depending on the weed locations.

    Because the application is diluted by the extra pattern width, the applied volume is now 12.4 US gpa (116 L/ha), about 20% less than before. This change is easily accommodated by mixing the product more concentrated in the tank. The downside is that the overlap in banded sprays receives twice the dose, and this is less than ideal.

    Tapered (Overlapping) Nozzles

    A possible solution is to employ tapered flat fans that are the standard type on broadcast booms. These produce more of their volume in the centre, diminishing at the edges, to allow for overlapped patterns and thus functioning better when more than one nozzle is activated. In addition, the extra coverage from a wider pattern is not as wasteful as it is from an even pattern type since it comprises less volume. A single nozzle spray, however, would have a higher dose in the centre than at the edges, since a single pattern has a bell-shaped volume distribution. (note: a single nozzle moving through air loses some of its volume from the centre and places it at the edges, due to aerodynamics of the fan shape. That levels out the bell shape somewhat.)

    Broadcasting

    When more than one nozzle is triggered by the sensor, the spot spray of that region is just a small section of a broadcast boom. The average dose is now related to the nozzle spacing, not the actual band width as it was for a single nozzle. The wider the section of nozzles that are activated simultaneously, the less inefficiency a wider individual pattern creates because it’s only wasted on the outside edges of the outside nozzles.

    Clearly, a sprayer that sometimes functions as a single nozzle spot spray, and at other times as a broadcast boom requires some compromises. Monitoring the activation of nozzles and learning from the relative frequency of single vs multiple nozzle activations will be useful to optimize the configuration. But when boom height is constant, a good compromise solution is possible.

    Suspended Booms

    A more challenging situation arises from suspended booms that do not hold a consistent height. Let’s assume a boom height variance of 10” (5” in either direction), and a wish to retain 20% overlap at the lowest height to avoid misses from a 30 degree nozzle.  The lowest height would have about a 12” pattern width, achieved at 22”. The boom would be set 5” higher, 27” (69 cm). At this height, a 30 degree fan would produce a band width of 14.5” (37 cm), producing a 45% overlap. If the boom sways up to 32” (81 cm), the pattern width would be 17.1” (43 cm).

    For multiple adjacent nozzles, boom height determines overlap, and a minimum overlap must be achieved even when the boom sways low.
    For single nozzles, boom height determines band width and therefore dose.

    This is where it gets tricky. At suboptimal heights, the difference between a single band and a section of overlapping patterns increases. Do we calculate the tank mix for the rate a single nozzle delivers within its band, or for a set of nozzles activated simultaneously? If we knew that the majority of activations are for a set of two or more nozzles, we could opt to assume an application rate of a boom section with 10” spacing. An 03 nozzle at 40 psi and 10” spacing would apply 14.9 gpa (139 L/ha). But when a single nozzle is activated, the application volume in the 14.5” band is just 10.2 US gpa (95 L/ha), and the plants that triggered just a single nozzle would be under-dosed.

    At the top of the sway (32”), a single nozzle’s wider pattern would deliver about 8.7 gpa (81 L/ha) , another 16% less spray volume than at 27”. At the low end of its sway, the band is 12” wide, applying about 12.4 gpa (116 L/ha) , 23% higher than the 10.2 gpa rate at the 27” boom height.

    It’s clear that to take advantage of the potential savings of spot spraying, and to ensure good success with single nozzle activation, consistent and accurate boom heights are essential.  I’m not sure how much more obvious a development priority can be.

    Band Length

    Spot sprays allow the user to select the length of band that the spray is activated for. Shorter band lengths require more targetting certainty. If booms and travel speeds are both low, an individual detected weed can be targetted accurately with relatively short band lengths because relatively little can happen to displace the spray during its short journey. But as booms and travel speeds are higher, the time that the spray arrives at the target is more difficult to predict and longer band lengths need to be programmed. For example, wind can push the spray off its target. Or the faster speeds impart more of a horizontal vector to the spray, causing it to land further away from the point of release.

    The variances in where the spray lands along the direction of travel depend on droplet speed and boom height. A conventional flat fan nozzle produces an initial droplet velocity of about 20 m/s. These droplets slow at a rate dependent on their size and whether they’re entrained in the spray plume. At 45 cm below the nozzle, larger droplets are still moving at 10 m/s. Smaller droplets are only moving at 1 to 2 m/s.

    Droplets take time to reach their target, and the spray band length must accommodate variance in this time arising from different from boom heights or droplet speeds.

    Let’s assume an average droplet speed of 10 m/s for the journey. At that speed, the spray takes about 0.05 s to travel the 0.7 m (27”) from nozzle to target. During that time, the sprayer going 12 mph (5.6 m/s) moves about 0.25 m forward, as do the larger droplets from the released spray. If the boom sways down to 22” or up to 32”, the distance travelled by the sprayer is 0.2 and 0.3 m, respectively. In other words, the band length would need a buffer of 10 cm to accommodate the variability of the beginning and end of the band.

    Overall Efficiency

    Are these numbers such a big deal?  You might say that we’re already cashing in on some big savings here, so why sweat the details?

    It’s the principle and the resources. If we’re talking about individual nozzle band width and its change with boom height, accommodating boom sway means applying more than necessary on average to avoid under-dosing when booms sway high. The examples used here show a potential dose variance of 40% with a boom sway of 10”, a modest assumption. That’s a big number to leave on the table. If we had a constant boom height, we could decide what overlap we wanted and minimize these losses.

    One of the features on most spot sprayers is to turn on all nozzles of a section that exceed a certain boom height. While this prevents under-dosing and ensures an area is treated even when the sensor is outside of its optimal range, it is possibly an unnecessary use of product.

    If we’re talking band length, adding 10 cm to a band length of 50 cm is 20% over-application. That can also add up.

    The key to being efficient with spot sprays is accurate and consistent boom height. We know we can do that with a wheeled boom. But show me a suspended boom that can deliver on this, and I see an instant industry leader in spot spray application.

  • How Spot Spraying will Affect Sprayer Design

    How Spot Spraying will Affect Sprayer Design

    Some years ago, a friend recommended that I read The Tipping Point by Malcolm Gladwell. In this book, Gladwell tries to understand why some things catch on, and others don’t. It’s a compelling read full of Gladwell’s trademark stories and his knack to deftly interpret scientific studies. He talks of connectors, mavens, and salesmen, as well as the “stickiness factor”, a measure of how memorable something is, as keys to success of products and ideas. I think of the book often as I ponder the many good ideas in agriculture, many of which never see widespread adoption.

    One of these good ideas is spot spraying. Green-on-brown detection was first introduced in the early 1990s. Anyone remember the Concord DetectSpray? It was great but had bad timing, as resistance wasn’t a big issue and glyphosate prices were about to slide. Green-on-brown grew to the NTech (later Trimble) WeedSeeker a few years later. Rometron’s WEEDit built on Trimble’s success and found widespread adoption in Australia in the past ten years. Spot spraying did not gain any traction in North America during this time.

    Australia is unique in many ways, not the least of which is their summer spraying practice. Summer is the hot, dry season where land is typically fallow and weeds are kept in check with herbicide sprays (aaaah, the serenity). Making several passes over a field, combined with the need to control some larger and hardy plants, is expensive, and a spot spray saves much of the cost. The savings can be put to use with more effective herbicide tank mixes that delay the onset of herbicide resistance. Spot sprays pay for themselves in short order Down Under.

    It’s more of a challenge in the northern plains of North America, where the fallow season involves snow cover and burnoff occurs in a short window before seeding and sometimes after harvest. But nonetheless, spot sprays have a fit for many of the same reasons.

    WEEDit is the first system to make serious inroads in North America, with several dozen systems having been retrofitted to high-clearance sprayers. High detection accuracy and hardware reliability is proven in three seasons.

    On March 2, 2021, John Deere entered the Green-on-brown spot spray area with See & Spray Select. This not to be mistaken as competition. Instead, the entry of a major brand provides validation of the concept like only a large manufacturer can. Yes, we’ve reached a tipping point.

    While the first Green-on-brown units are becoming established, Green-on-green, the ability to detect weeds within a crop, continues to be developed around the world. French startup Bilberry has made enough gains in Australia to bring its product to market with Agrifac, where it’s called AIC Plus. In farmer field trials, they have achieved 90 per cent detection accuracy of wild radish in Western Australia, and claim that they are ready for broadleaf weed identification in wheat, barley and oats. Bilberry’s technology will also be seen on Australia’s Goldacres and France’s Berthoud. Other startups, notably Israel’s Greeneye Technology, plan to introduce a Green-on-green system in the U.S. in the near future. Amazone, the German farm equipment giant, partnering with Xarvio and Bosch, announced plans at Agritechnica to have a commercial unit for sale by 2021.

    This technology will have significant impact on sprayer design philosophy. At present, productivity is synonymous with capacity, and large tanks with commensurate heavy and powerful tractor units dominate. Spot spraying savings will depend on weed density and hardware resolution, but 50 per cent to 90 per cent reductions in spray volume can be expected. A 1,600-gallon tank would no longer be necessary. The savings in frame weight and horsepower would be significant, as would the time savings from less intense tendering demands. These savings would offset the lower driving speeds that accompany sensing technologies, and, overall, provide a lower bar for autonomous operation. We may see lighter specialty spot sprayers.

    The savings in brute size will be countered by increased sophistication. Better boom height management is essential for spot spraying, not just for the sensor to properly see the target and estimate the time needed for the boom to reach that spot, but also for the spot spray itself to deliver the right dose. In any fan spray, band width at ground level changes with height, and that, of course, is related to dose. Trailed booms can address this issue easily.

    But not everyone wants a specialty spot sprayer that would require an extra pass over the field. With growing utility of soil residual herbicides, dual tank sprayers—small tank for the spot spray, large tank for the broadcast residual—make sense. Large sprayer frames can accommodate an additional smaller tank, second pump, and plumbed boom easily.

    Plant detection and identification bring other opportunities. Adjusting dose for plant size is one of the first, or for harder to control weed species.

    Spot sprays rely on fast, precise response of the nozzle, and this provided by fast-reacting solenoids that are part of pulse-width modulation (PWM) systems. On a broadcast sprayer, these solenoids can change the emitted dose instantly, within a certain envelope, by altering the duty cycle of the pulse. This, however, works best in the context of a boom with overlapping spray patterns. A single band spray would not change dose with duty cycle as easily.

    Higher dosing would be an opportunity for multiple nozzle bodies that are able to spray one, two or more nozzles in the same spot simultaneously. These are already widely available and popular in Europe.

    This also brings direct injection into play. Current systems introduce the active ingredient into the boom upstream of the nozzles, affording it time to mix into the water. For true spot spray utility, though, direct injection ought to be at the nozzle. Only then can custom mixes and rates be applied on a spot basis. It’s been done before, if only to show how difficult it would be to deliver uniform doses to a spot spray machine.

    Spot spray sensors have agronomic benefits. By recording the location sprayed, weed patches can be mapped. As plant identification becomes possible, it’s conceivable to obtain plant species and stage distribution maps from the spray pass That would turn the sprayer into a high-resolution crop scouting tool. As machine learning and sensor sophistication grows, other plant and soil parameters can be mapped. The agronomic value of such maps, especially if created over the course of the growing season, is immense. Of course, data density, handling, storage, and analysis will constrain this.

    If the past has taught us anything, it’s that there seems to be a appetite for investment in farm equipment. Sprayers have been the most-used implement on the farm for some time, and their popularity continues despite sharp price increases. These new capabilities will only add value to these implements. Prepare for sticker shock, followed by acceptance and adoption.

    What will a future spot sprayer look like? Although it will have tanks and booms, the level of electronic sophistication will make it so much more versatile we can’t yet imagine all the ways in which it might be used. But it seems to me the situation has tipped and we’re already accelerating toward that future.

  • John Deere See & Spray Select

    John Deere See & Spray Select

    On March 2, 2021, John Deere entered the optical spot spray (OSS) market with its first product, See & Spray Select™. This “Green on Brown” system identifies green material on a non-green background and is thus suited for pre-seed burnoff, chem fallow, or post harvest. It is competing for the same market space as Cropland’s WEEDit and Trimble’s WeedSeeker, but uses a slightly different approach.

    At the heart of the See & Spray system is a relatively simple RGB camera that is mounted directly to the boom and looks about 1.5 m ahead.  When this camera detects a spot of green colour, it assumes that this is a plant and activates a nozzle in line with that plant. John Deere says the weed size threshold is about ¼” (6 mm), and is evaluating its experimental data to identify exceptions to that rule of thumb.

    See & Spray Select uses an RGB camera to detect weeds (Image courtesy John Deere)

    In 2017, John Deere conducted a highly publicized acquisition of Blue River Technologies, a start up that pioneered artificial intelligence (AI) plant identification and coined the term “See & Spray”. However, the technology John Deere announced this time originated with the University of Southern Queensland near Toowoomba, Australia. The university’s Centre for Agricultural Engineering had received some initial seed financing from Sugar Research Australia, Cotton Research and Development Corporation, and Hort Innovation, and eventually partnered with John Deere. This is yet another example of the value of farmer investments in research.

    Blue River contributed to this project but remains committed to its path of developing Green on Green OSS through machine learning. John Deere says this first product is part of an evolution of spraying with ever-increasing precision that will culminate in spot spraying weeds within a canopy.

    The pixels in the See & Spray camera chip are mapped during its initial calibration, allowing the processor to know which nozzle to turn on. There are two user-selected modes. In “Single Nozzle” Mode, the system turns on as few nozzles as possible. If the weed is directly under a nozzle, just that nozzle is turned on. Should the weed be in between two nozzles, both will be turned on. In “Overlapping” Mode, a detection will turn on at least three, and up to six adjacent nozzles. This mode is intended for herbicides that contain specific nozzle recommendations on the label, such as dicamba. By fitting these tips on the spot spray location, the required overlap and subsequent coverage can be guaranteed to be compliant with that label, a unique feature of See & Spray.

    The number of nozzles activated by a weed detection depends on the location of the weed relative to the nozzles, and the mode selected by the user (Image courtesy John Deere)

    In all modes, the user can specify the distance before and after the detected plant that the nozzle will spray. This feature is useful when boom height varies or when travelling faster to provide extra assurance that the target will be covered by the spray. The boom height range for See & Spray is 26 to 47” (66 to 120 cm), and the maximum travel speed with nozzles pointed down is 12 mph.

    Installation of a 40 degree angled adaptor allows sprays tom be emitted backwards, and increases the spray speeds to 16 mph due to the extra distance and time afforded the sensors andoin processors to make a decision.

    See & Spray has a built in contingency for suboptimal conditions, for example when the boom falls outside its height range, or the nozzle speed (not tractor) exceeds the 12 or 16 mph maximum in a turn, or a light or sensor or processor fault occurs. Called “Fallback Mode”, the boom can be configured to shut off, or to go into broadcast mode (using the spot spray nozzles) at that time. These types of insurance are a necessary part of an OSS on the market today.

    To prevent fallback mode from occuring unecessarily, operators often choose to reduce their tractor speed one or two mph to allow for yaw without triggering all the nozzles.

    No OSS system is perfect. Tiny weeds, or those obscured from camera view by crop residue, may be missed. The contingency for WEEDit is “Combined Mode”, where the entire boom emits a broadcast spray at a user-determined fraction of the full dose, while still maintaining spot spray capability at the full dose when a detection occurs. The reduced dose is sufficient to control the smallest weeds, whereas the spot spray is emitted at the full label rate for the larger ones. This capability is made possible through Pulse-Width Modulation (PWM) control of each nozzle.

    John Deere has developed a mode of its ExactApply system to create the same outcome. Called “A & B Mode”, the rear nozzle (B location on the ExactApply nozzle body) is being activated by See & Spray. The front nozzle (A location) can be asked to spray simultaneously over the entire boom width. By choosing a smaller nozzle, a fraction of the label rate can be applied as a broadcast while maintaining spot spray capability. The broadcast boom is pulse-width modulated and retains the swath control and turn compensation of ExactApply. This mode also makes it easier to ensure coverage of these smaller weeds by selecting a finer, wider (110 degree) angles spray on the broadcast boom, and retaining a coarser, narrower fan angle banding nozzle for the spot application. The spot spray does not use PWM, relying on conventional speed and pressure to ensure the correct rate.

    If planning to use A & B Mode, a user would first need to decide if they will calculate the spot spray dosing on a single or a multiple activated nozzle system. If priorizing the single nozzle actiation, one would first determine the band width of that nozzle, and size the nozzle accordingly. The band width should be ar close to the nozzle spacing as possible to maximize savings. Say the sprayer has 15″ spacing, and the nozzle’s band width is 20″. Now, whenever multiple nozzles are activated, they would operate as a 15″ spacing and would over-apply 20/15 = 1.33, or 33%. Say you want to apply 15 gpa (you may need to boost the spot spray volume to allow you to cut that with the broadcast feature). You can do it with the band (and overdose when using multiple nozzles, or apply 15 gpa with the multiple nozzles, underdosing by 28% when a single nozzle is activated. Or split the difference.

    The next step is to select the application rate of the broadcast. If you want to apply 30% of the spot spray rate using the broadcast nozzles, size these accrodingly to apply 5 gpa.

    For band- and spot-sprays, the width of the spray pattern at the target height determines the dose, therefore careful selection is advised. A worksheet that shows boom heights at various fan angles and nozzle spacings is downloadable here. TeeJet and Hypro offer a selection of narrower flat fan tips, but none yet in a low-drift design. Other nozzles are in development. Agrotop has already developed a low-drift “Spot Fan”, and MagnoJet, a Brazilian ceramic nozzle supplier, has 30 and 40 degree low drift tips for sale. Wilger has develped the DX series ComboJet tips in 20, 40, and 60 degree fan angles, in a low drift (pre-orifice design that works with PWM.

    The camera sensing threshold can be adjusted to optimize a specific target. For example, to specify a certain weed size, that weed can be held in view of the sensor and the user can adjust the sensitivity until the weed is properly detected. As with any higher sensitivity, this runs the risk of more false detections, resulting in over-application. But it gives the user some knowledge that an important weed stage is being targeted properly.

    The See & Spray camera relies on ambient light conditions, and John Deere recommends it not be used within 30 minutes of dawn or dusk. Both WEEDit and WeedSeeker, in contrast, can operate under any light conditions.

    One of the challenges of running a OSS boom is the unpredictable fluctuation in flow requirement, which can theoretically range from just a few nozzles spraying to the whole boom activated in less than one second. While this extreme example is rare, a sophisticated and fast-responding pressure-based flow capability is nonetheless required. WEEDit uses a Ramsay Valve into their units to handle this challenge, whereas John Deere is relying on its existing plumbing design.

    As a factory install, the See & Spray is fully integrated into the Series 4 display and is tied into JD Link. As a result, it can generate a high resolution map that shows each spot spray activation, by nozzle. The agronomic utility of this capability is significant, as it provides a very high resolution plant density map. This capability is also inherent in WEEDit and most green on Green systems available..

    See & Spray Select is a factory option and comes integrated into the 4600 series monitor (Image courtesy John Deere)

    It’s no secret that I believe optical spot sprays represent the future of pesticide application (see here). And it’s great news to see John Deere enter the OSS area with a factory installed option. As an influential force in ag, it lends credence to the concept and will benefit all other companies vying for this space. As they say, a rising tide raises all ships.

  • Boom Heights at Fan Angles Worksheet

    Boom Heights at Fan Angles Worksheet

    Use this spreadsheet to calculate the minimum boom heights needed for various applications.

    Some caution:

    • The values are theoretical and assume the fan angles are accurate. Some nozzles don’t produce the advertised fan angle. Enter your actual angle in the spreadsheet
    • The theory assumes that the droplets at the edge of the fan always move in their projected direction. In fact, after some distance (say 50 to 75 cm, gravity pulls the droplets down and the pattern no longer widens at the same rate. The rate of pattern collapse depends on the droplet sizes.
    • Use the 0% overlap column to help with banding nozzle pattern width. Simply use the nozzle spacing column to enter your desired band width.
    • Note that angling the nozzles forward or backward decreases your minimum boom height, but depending on the deflection of the spray in the wind, this too has limits.
    • Too high a boom obviously increases drift. But patternation from overlap isn’t affected that much, largely because the pattern is now subject to aerodynamics.