We’ve heard it often: calibrate your nozzles to be sure your boom output is uniform across its entire width. The downside of poor uniformity is obvious: strips of over- or under-application causing problems with pest control or crop tolerance. A graduated cylinder held for 30 s under each nozzle is the approach of choice. Several electronic versions exist to make the job easier, for example the Spot On.
But there’s more to the story. Nozzle calibration only ensures volumetric uniformity from nozzle to nozzle. It serves to identify worn, plugged, or damaged nozzles, and little else.
After release, the spray is atomized and distributed across a wider area with a properly developed pattern. An operator adjusts boom height or spray pressure to generate proper overlap for a given fan angle at the target height. Unfortunately, the uniformity of this pattern can’t be measured with a graduated cylinder, so we’ve traditionally used a “patternator”, a flat collector placed under a few nozzles that uses a series of channels to show the peaks and valleys of the volumetric distribution. Both calibration and patternation are done with a stationary spray boom. Nozzle manufacturers employ both methods to ensure their products meet international uniformity standards before marketing.

Burt even that isn’t enough. We can have good volumetric distribution but still have inconsistent coverage in places. To identify those regions, we need a way to measure small amounts of spray deposit under a moving boom, ideally in the canopy we intend to treat. Here we have a few options. We can place a tracer (dye, salt, etc.) in the tank, and collect spray on small collectors placed throughout the area to be treated. We collect the samples, wash them, and analyze the solvent for the tracer. This requires special equipment and takes time. It’s useful, but only measures dose, not droplet size or density.
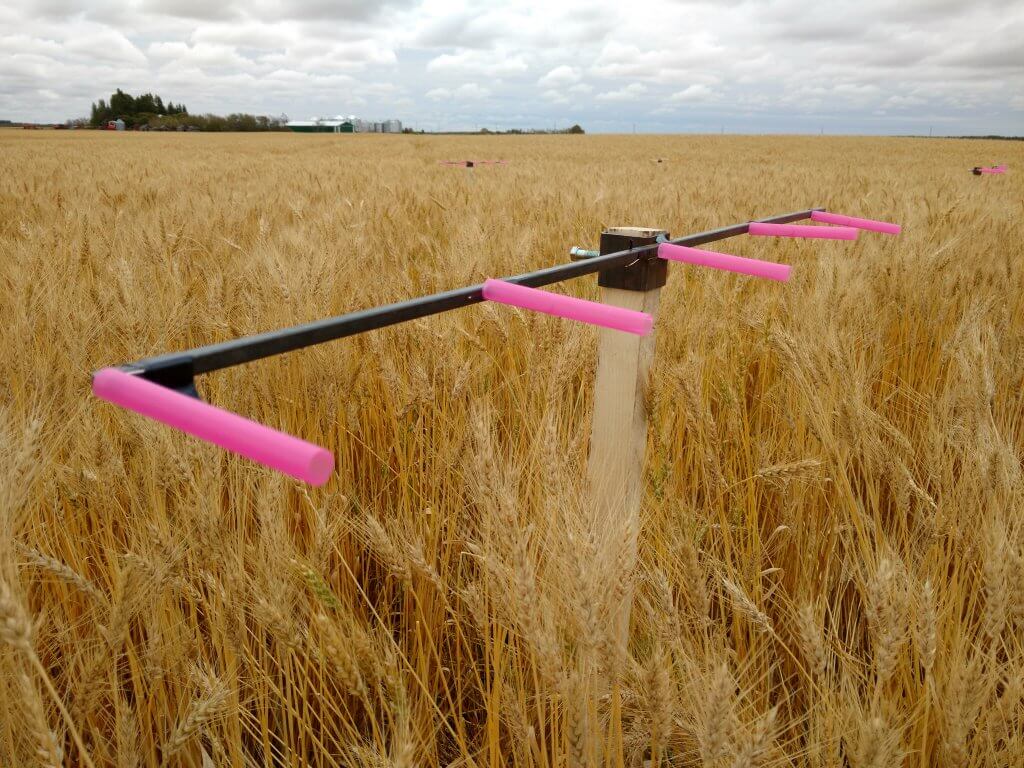
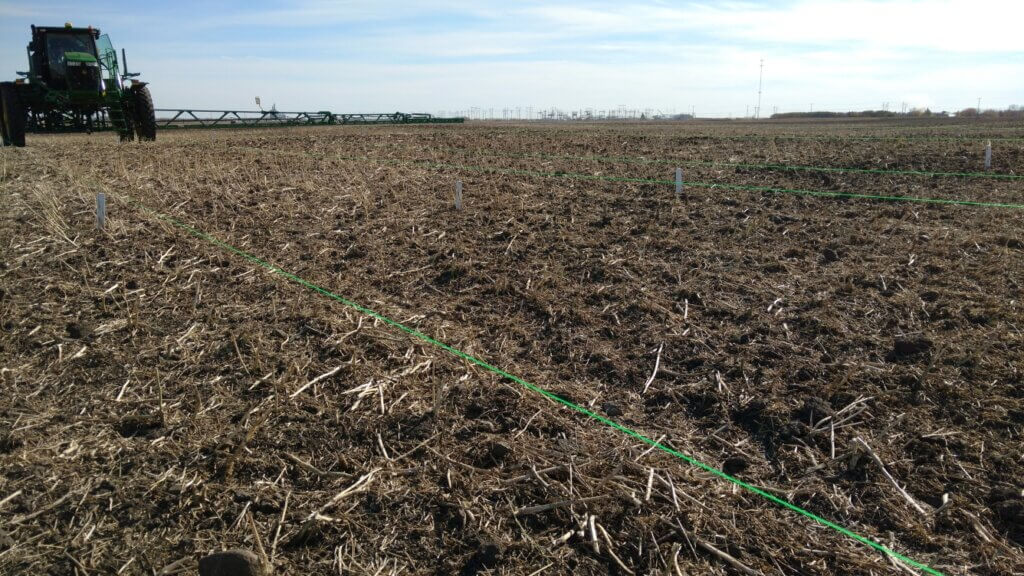
A faster way is to use water-sensitive paper, about which we’ve written here and here. Using WSP is fast and easy, and it can provide additional information such as the number of droplets per unit area, or the total percent of the area covered, or even the size of the deposits, with the right equipment. We call this “coverage”, and believe this to be one of the two components of good pest control (the other being “dose”, the total amount of material deposited). Because the world isn’t fair, WSP isn’t great at quantifying dose.
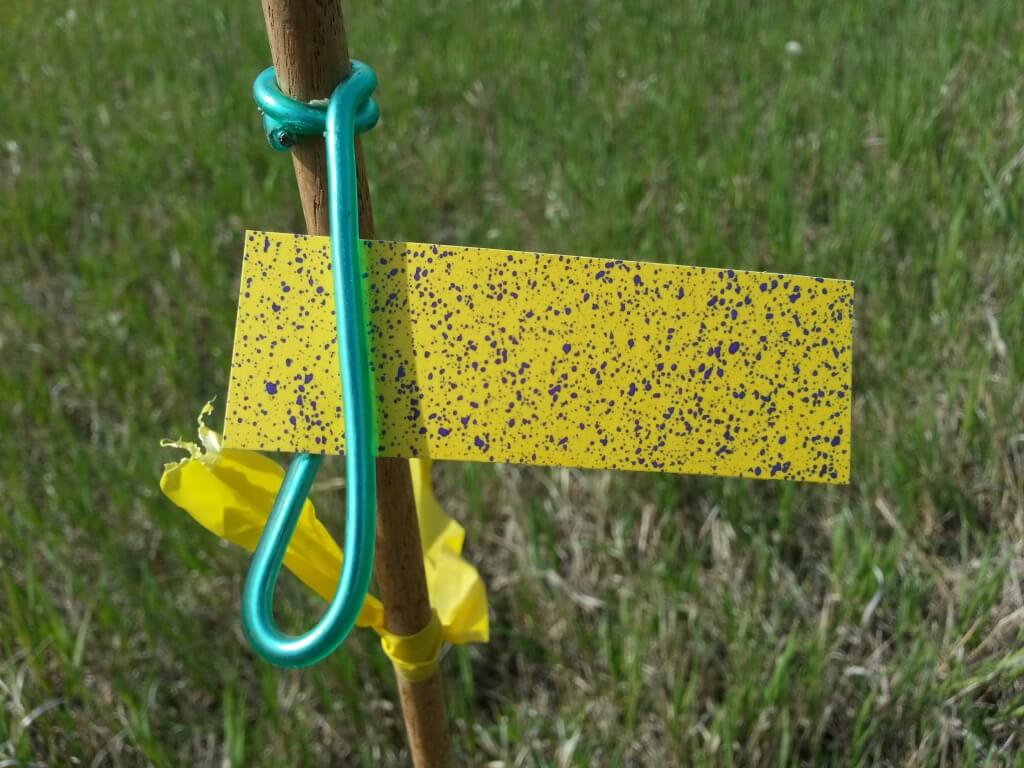
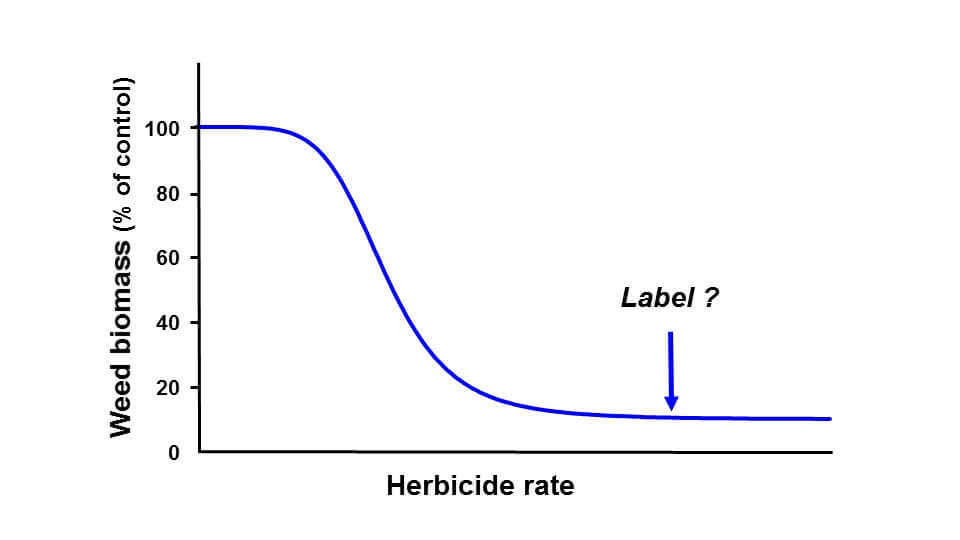
The industry has done a good job of identifying the dose required for good control, and this is reflected in the rate recommendations on a label. But there are a few gaps. They don’t tell us, for example, what “good coverage” is, despite often telling us to “ensure” it.
Back to Deposit Uniformity
We quantify deposit uniformity by calculating the Coefficient of Variation (CV) of a series of measurements. The CV is defined as the standard deviation of these measurements, expressed as a percent of the mean value.
Because it’s hard to measure, it’s easy to ignore. But here are a few basics our research has told us: (In the first three examples, deposits were measured under a spray boom using petri plate or drinking straw samplers. There was no interference from a canopy. The last example was taken from within a canopy.)
- When measuring the deposited dose, the CV under a boom tended to rise with increased wind speed. This is no surprise, as it reflects that more wind has a greater chance to displace spray from its intended destination.
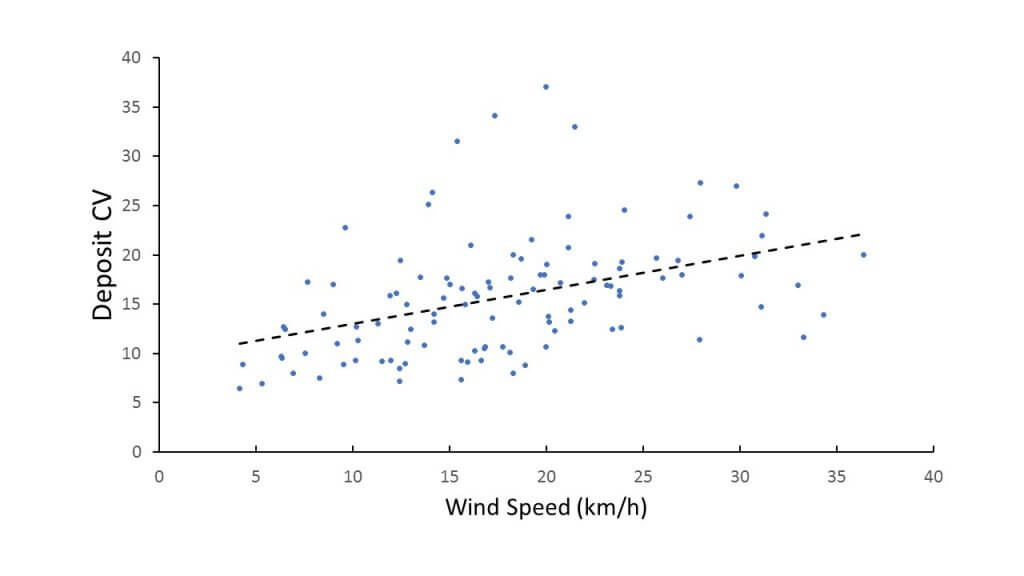
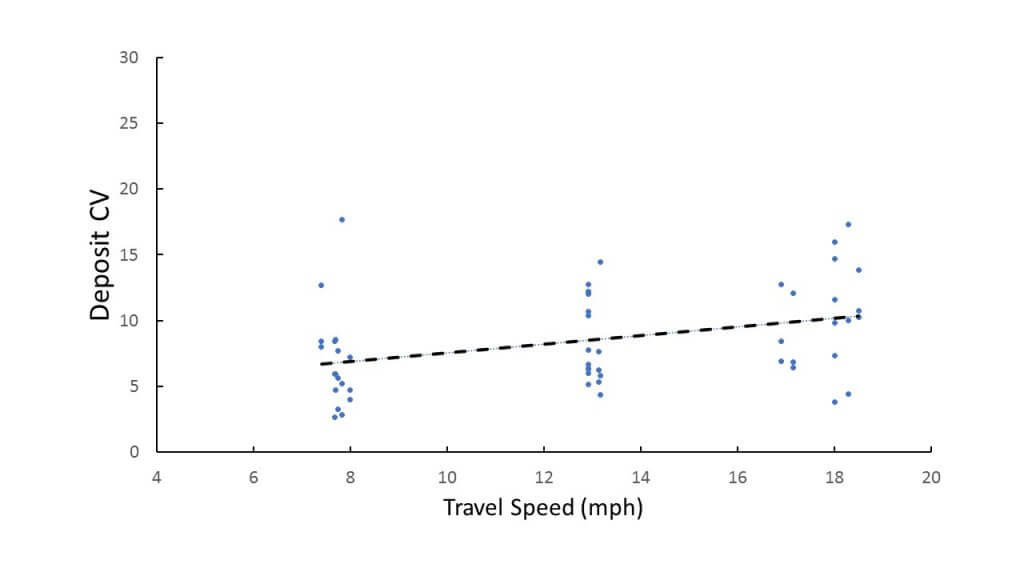
- Higher booms and increased travel speed also tended to increase deposit CV.
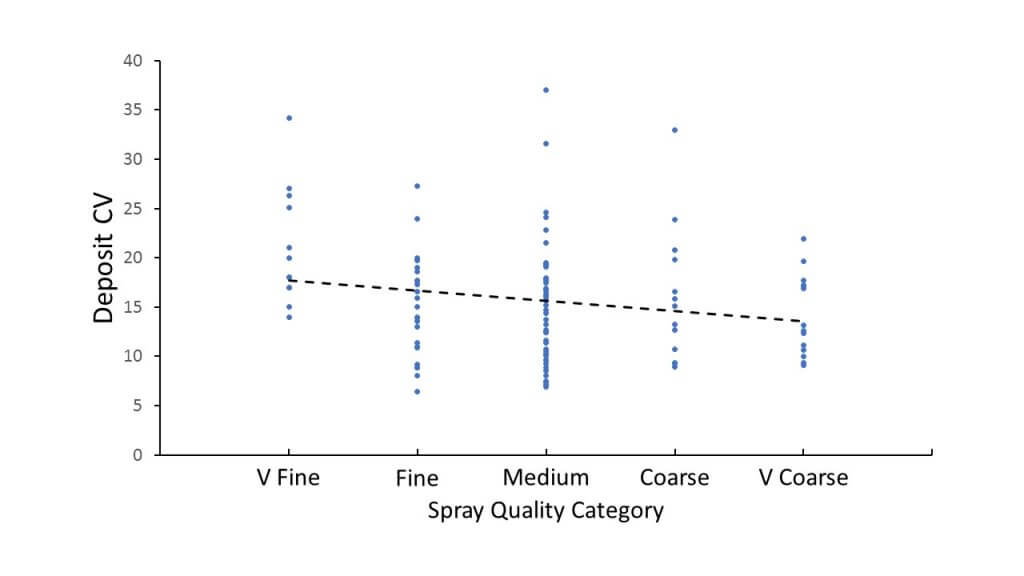
- Finer sprays tended to increase deposit CV. This makes sense, as the finer droplets are more easily displaced by air movement.
- Deposits were reduced and became more variable deeper in a broadleaf canopy. Again this makes sense, as there are a lot of obstacles to clear and canopies themselves are by no means uniform.
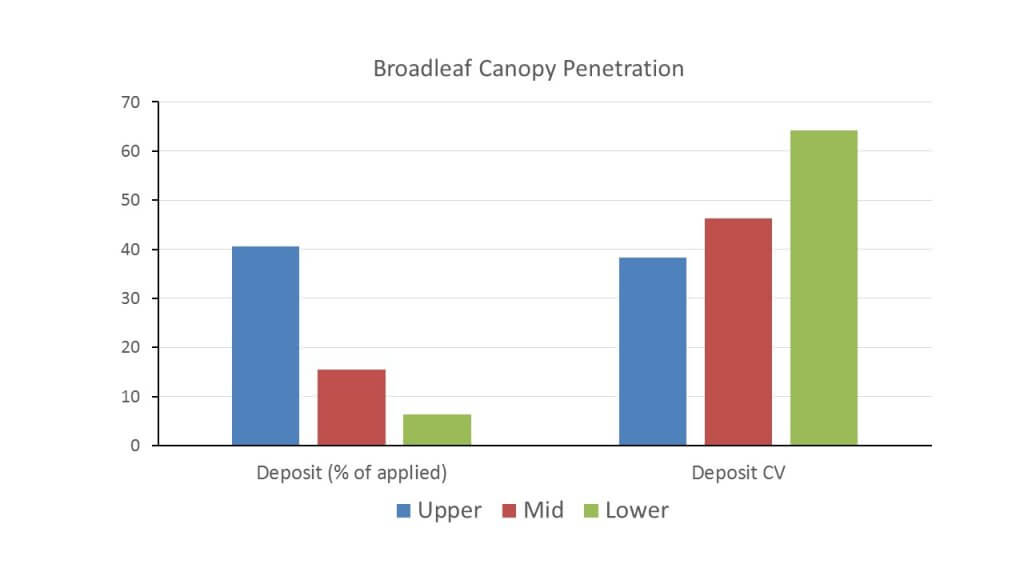
Also note that the CV in the canopy was quite a bit higher (40 – 60%) than for the exposed targets (10 – 20%). That’s another challenge.
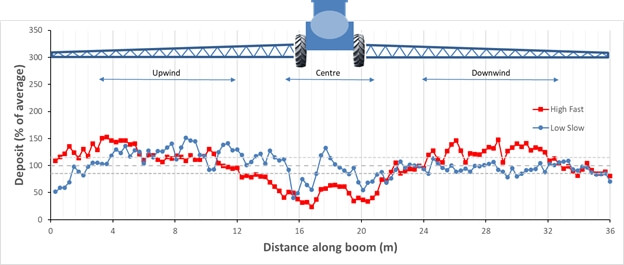
To recap, the best uniformity was achieved with low booms (as long as patterns overlap sufficiently), slow speeds, low winds, and coarser sprays. It’s easy to see that current spray practice isn’t always conducive to uniform deposits.
So What?
Why does uniformity matter? It matters because more variable deposits are less efficient. They require higher doses for the same effect as uniform deposits. Here’s why:
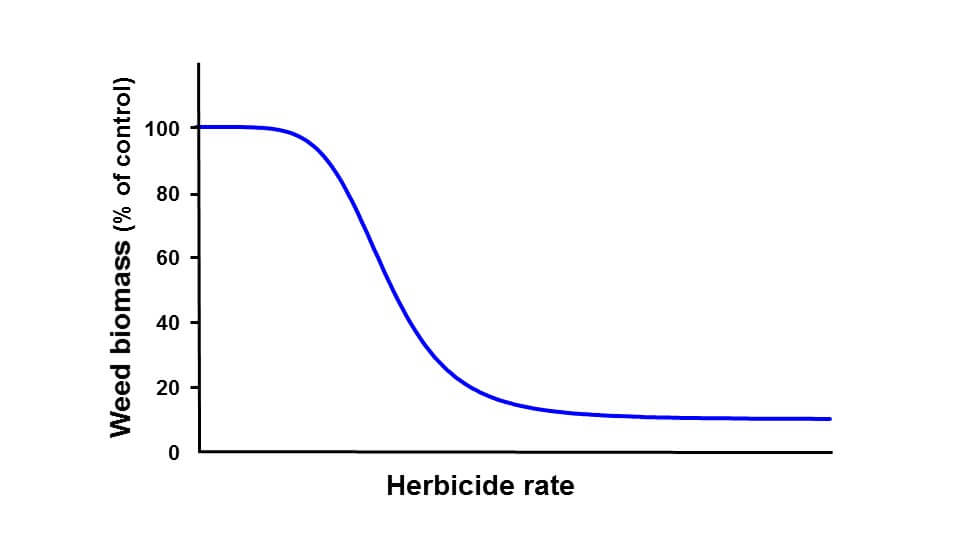
The figure below shows a typical dose response curve for a herbicide. On the y-axis, we see weed biomass, on the x-axis herbicide dose. At low pesticide doses, not much happens. (In fact, we often see a slight increase in biomass with very low herbicide doses.) As we increase dose, biomass begins to decline, and as dose increases further, the effect begins to taper off. At a certain dose, no further biological response is possible.
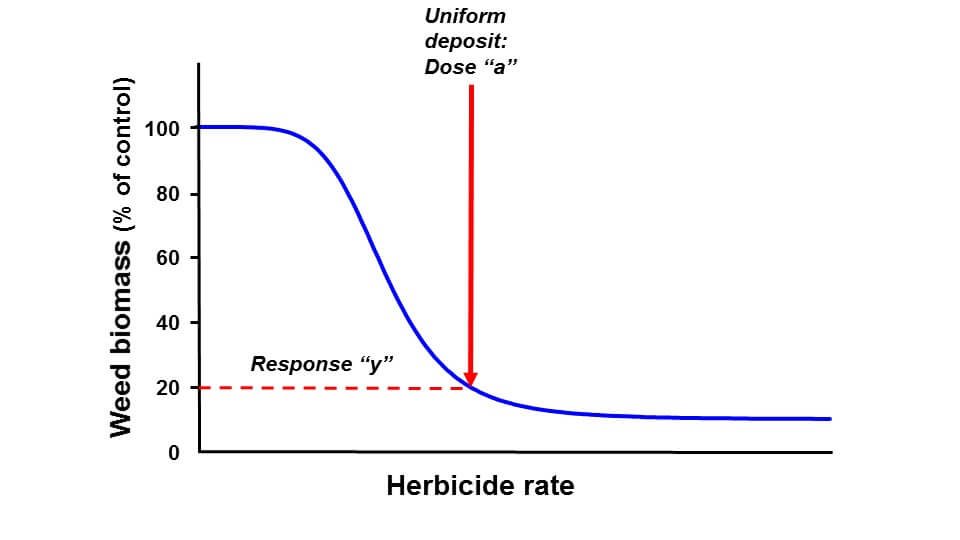
In the next figure, we see that application of a uniform dose “a” results in biomass “y”, about 20% of untreated.
Next, we apply the same average dose, but we do it non-uniformly. At some locations under the boom, the deposit may be 40% higher or lower than average. The result is response “z”. Weed control is worse, as bad as it would have been at a lower uniformly applied dose (effective dose “b”).
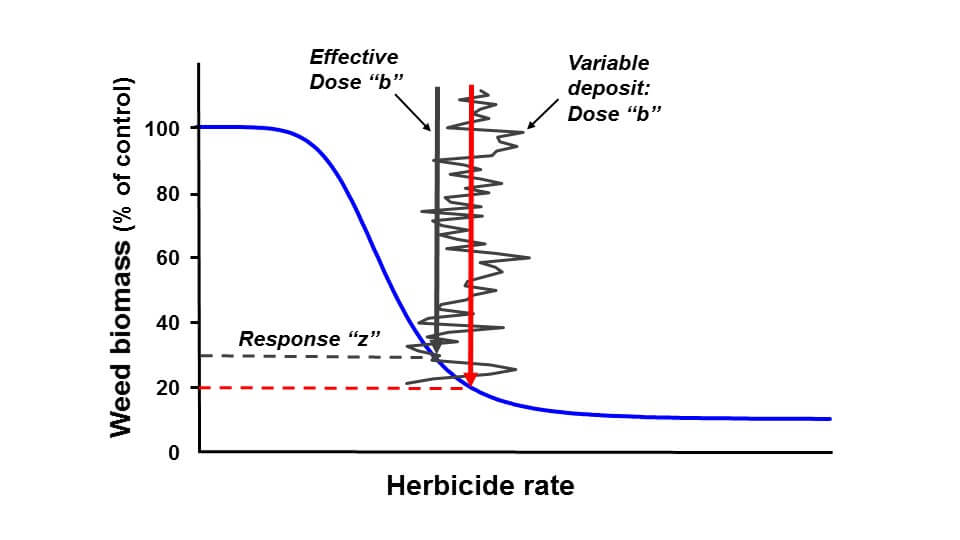
This effect only happens when the effective dose is near the lower inflection point of the dose response curve. Perhaps we’re shaving rates. Perhaps the weather is challenging the herbicide’s performance. Or perhaps the weed is difficult to control. Under those conditions, any gain in performance with a higher dose is less than the penalty from a lower dose.
There are two ways to correct this performance loss. One is to apply a higher herbicide rate. It’s commonly done, as insurance against – you guessed it – variability, and it’s one reason why label rates have some flexibility. The second way is to improve deposit uniformity. In effect, better uniformity allows for rate reductions.
Take Home Message
Uniform spray deposition improves overall control. Our examples used herbicides, but the same is true for fungicides and insecticides. It’s true for field crops as well as fruit and vegetable sprays.
Uniformity is especially important when the application is done under adverse conditions in which the pesticide performance is challenged. It’s a fundamental part of good application practice.
It’s not always easy to improve uniformity. But at least it should be measured. Without measuring it, an applicator may never know how much product is being wasted. Have a look at the Crop Adapted Spraying approach Jason is using, it’s a template for all sorts of applications.
What can you do? The easiest task is to record the flow from each nozzle. The results might be surprising. Ensuring proper and consistent boom height is also important. Using water-sensitive paper to visualize the quality of the job would be icing on the cake. And adjusting application method, with uniformity as a goal…that gets you a gold star.