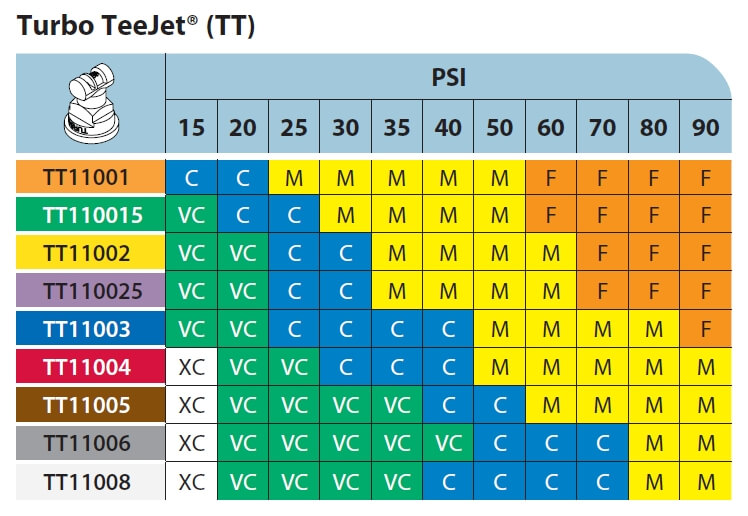
- Hydraulic atomizers create unstable liquid sheets that break into ligaments and droplets; nozzle geometry and liquid properties control droplet formation.
- Air shear from travel speed or wind further destabilizes sheets; nozzle orientation relative to airflow strongly influences droplet fineness.
- Rotary atomizers produce more uniform, controllable droplets; higher speed or lower flow yields finer sprays but have limited high flow capacity.
- Describe sprays volumetrically: use DV0.1, DV0.5 (VMD), DV0.9 and relative span to capture dose, drift risk, and size distribution.
This text was generated by OpenAI GPT 5 Mini
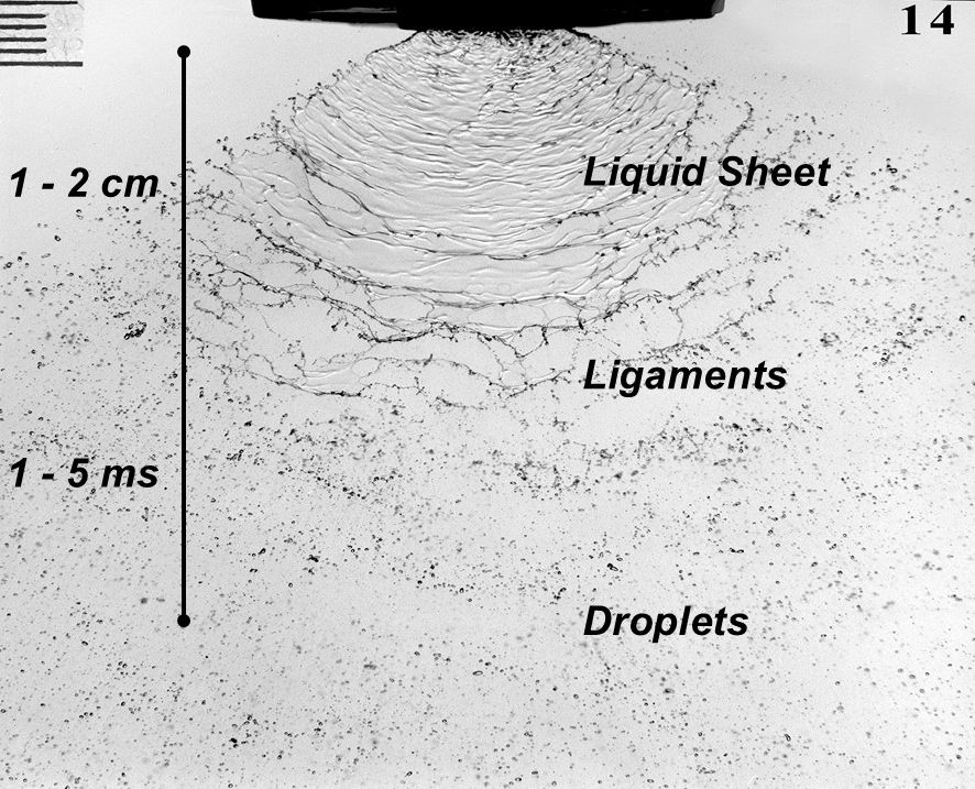
Hydraulic atomizers comprise the majority of agricultural nozzles. They work by forcing a liquid through an orifice, resulting in a liquid sheet that is inherently unstable. The sheet breaks into ligaments and eventually droplets within a few centimetres of leaving the nozzle. The physico-chemical properties (elongational viscosity, dynamic surface tension, etc.) of the liquid affect the shape of the sheet and its stability, and therefore play a role in atomization.
The dimensions of the liquid sheet depend on the nozzle type and the conditions in which they release the liquid. Flat fan nozzles, the most common in agriculture, force the liquid through an elliptical orifice that results in a sheet that is thicker in the middle and tapers at the edges. Nozzles that produce wider fan angles have narrower orifices, creating thinner sheets that ultimately produce finer sprays. Higher flow rate nozzles produce thicker sheets. A deflector nozzle impinges a stream of liquid against a plate that forces the stream flat and spreads it out, creating a different set of forces that destabilize the sheet. A cone nozzle generates a swirling action that results in a less stable sheet.
If we place these nozzles into an airstream, either from travel speed or ambient wind, the spray sheet will become less stable and result in finer sprays. The amount of air-shear atomization will depend on the relative orientation of the nozzle sheet and the moving air. Nozzles that spray parallel to moving air produce less air shear and therefore result in coarser sprays than nozzles oriented perpendicular to the air stream. This characteristic is exploited by aircraft as a means of droplet size control, having a greater effect than spray pressure.
Rotary atomizers, either from rotary cages or spinning disks, are capable of producing sprays whose droplet size ranges are more uniform than those from traditional hydraulic atomizers. This produces advantages ranging from improved drift management to better use of available carrier volume. Rotary atomizers are popular with aerial applicators and are found on the majority of spray drones.
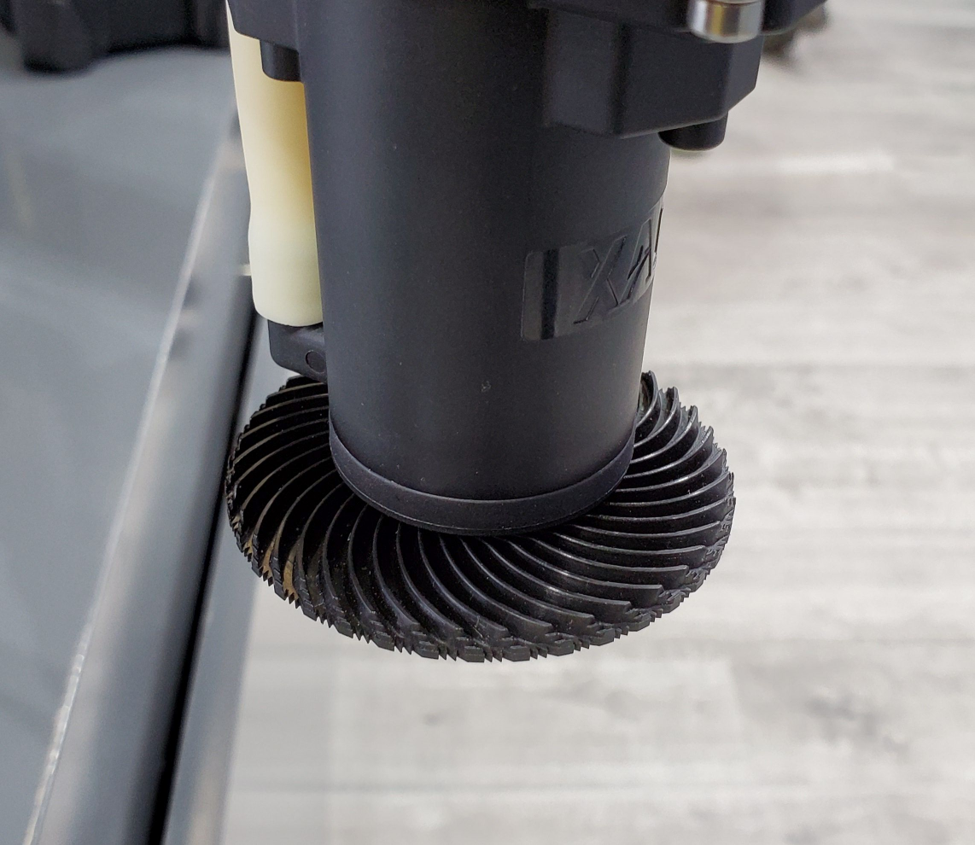
Rotary atomizers create finer sprays when their rotational velocity is increased, or when the flow rate of the nozzle is decreased. In both cases, the ligaments formed at the periphery of the atomizer are thinner and will break up into smaller droplets. One disadvantage of rotary atomizers is the limited flow rate that they can atomize. For high flow rates, rotary cages, which break up the spray liquid by passing it through a series of wires mesh stages, are used. These require a fair amount of power, making them impractical for most smaller drone sprayers.
Droplet size ranges
All hydraulic agricultural sprays are said to be polydisperse. This means that they are made up of a number of droplet sizes ranging from perhaps 5 µm to 1000 µm, or even 2000 µm or more for low-drift nozzles. How should the spray cloud be described?
The vast majority of droplets in hydraulic sprays are small. In any sample of flat fan nozzles, low drift or not, about 80 to 90% of the total number of droplets will be less than 150 µm in diameter. This held more or less true for a wide range of nozzles. As a result, using a traditional weighted average droplet diameter was not useful as a descriptor because the abundant sizes would always control the outcome even though they contained a minority of the spray volume. The contribution of the larger, but less abundant droplets would be hidden with an arithmetic mean.
Any other descriptors based on droplet number alone, such as mode (the most frequent size class) or median (the size class above and below which were an equal number of droplets) are equally dominated by the high abundance of the smaller droplets.
To solve this problem, droplet diameters can be converted to their volume equivalent using the formula
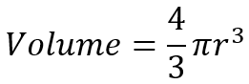
Where r is the radius of the droplet.
This is relevant because the dose of pesticide in a droplet is related to its volume. It’s important to understand the contribution of relatively few larger droplets in terms of how this dose was received by plants.
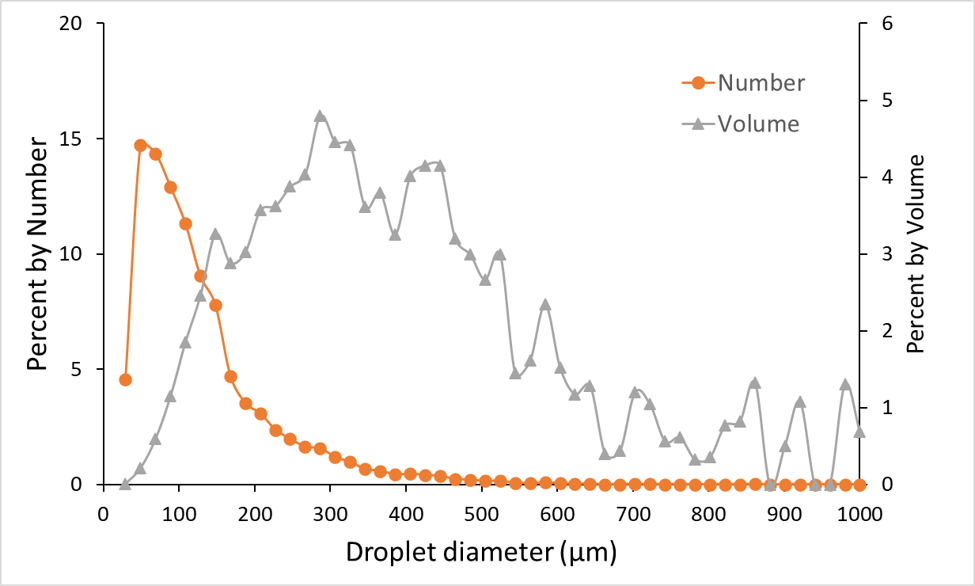
Thus we arrive at a volumetric distribution, where each diameter is described by the proportion of the total spray volume it represents. That volume represents the dose of spray. Now we have some practical meaning of the numbers.
First we generate a cumulative volume distribution. The volume contained in each size fraction is expressed as a percentage of the total volume and these are added together.
The cumulative distribution can now be divided into benchmark values so we can get values that differentiate various sprays. The key ones of interest are the 10th, 50th, and 90th percentile. The 10th percentile, known as the DV0.1, is defined as the diameter below which is 10% of the total volume of the spray. DV0.5 and DV0.9 likewise describe the diameters below which are 50% or 90% of the spray volume, and the former is more commonly known as the Volume Median Diameter (VMD). Recall that the median is the value that divides a distribution in half by number, therefore the 50th percentile is also the median.
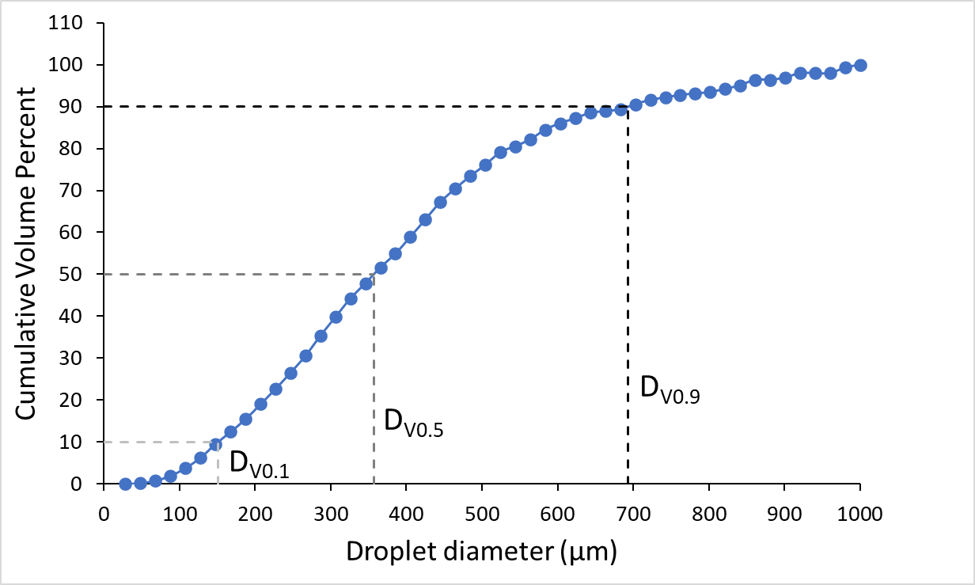
The VMD is the benchmark value, it can be thought of as the diameter near which the majority of the dose is delivered. The DV0.1 can serve as a drift index, describing the diameter that contains the smaller droplets. Sprays that are more drift-prone have lower DV0.1 values. The DV0.9 can be an index of the droplets that may not be able to contribute much to product efficacy because they are too big to cover much area, and they are likely to be very rare, possibly missing the target altogether. Higher DV0.9 values indicate that more of the spray may be lost to large droplets that will likely rebound.
All of these parameters are related to each other. A finer spray will have lower DV0.1, DV0.5, and DV0.9 values. But it is not necessarily correct to say that a spray with a lower DV0.5 will have less drift potential. Some nozzles, by virtue of their design, can have smaller driftable size fractions as well as a lower DV0.5.
One of the main reasons that sprays of equal DV0.5 may have different behaviours in the environment is their Span. Relative Span describes the uniformity of the droplet sizes in a spray. A perfectly uniform spray (containing droplets that are all the same size) will have a span of 0 because all three volumetric parameters will be equal.

We sometimes encounter the Sauter mean of a spray, which can be defined as the diameter of a drop having the same volume/surface area ratio as the entire spray. This is useful when surface area is of importance, such as in combustion or evaporation.
The popularity of laser measurement systems, and their ability to measure droplets that previously escaped detection, was a boon to the spray industry. But it quickly became clear that simply comparing these parameters was problematic. Each laser system, and indeed each laboratory that used them, seemed to create their own unique values for the same nozzles. We will explore the solution to this problem in Part 3.
