This short article is a reminder for sprayer operators to respect the possibility of tipping a sprayer. Every spring I catch wind of someone tipping over. When I can ask the operator questions I start with “Is everyone alright?” and “Was the sprayer full?“. Hopefully the answers are “Yes” and No“, but not always.
The following factors are always involved:
Driving too fast. Usually entering a field at road speed.
Entering the field on a downhill slope and/or catching a pothole or soft shoulder.
Turning in a tight radius, usually 180 degrees. This is made worse when the sprayer is towed.
Sprayer is not completely full and “slosh” changes the centre of gravity.
Narrow tires and a narrow base.
Fortunately the sprayer wasn’t damaged and the spill was minor.A tight turn at high speed coupled with a depression in the entryway and tank slosh was enough to tip the unit. They had it righted and hauled out soon after. No one was hurt.
I’ve heard as many cases involving seasoned operators as new operators. The next few pictures are of a veteran operator’s sprayer carrying 28%/ATS. Just like the images above, a tight turn at high speed sloshed the load just as a deep pot hole caught the outside front wheel. This sent the sprayer into a lane of traffic before it tipped back and over into the field. No one was hurt.
Fortunately for the operator, the spill was contained in their field (not the road or ditches). The 90′ boom had to be cut off before the sprayer could be towed back to the yard to be sold off as parts. While the operator has looked at the bright side (an opportunity to upgrade) it has left them relying on a custom operator for spring spraying and making a hasty in-season equipment purchase.
Lost a tire during the tow back to the yard.Crumpled boom after having to be cut from the sprayer.Not the way anyone wants to see their sprayer.
Major Spill
What follows are generic steps for what to do if there is a major spill. Always defer to the process outlined by your regional authority.
If you do tip the sprayer, first protect yourself, then others, then animals in that order.
Stop any exposure by removing clothing and washing as best you can.
Stop people from entering the area.
If it is safe to do so, try to prevent the spill from spreading.
Contact your local spill centre. In Ontario, the Spills Action Centre will receive calls 24 hours a day at 1-800-268-6060. Consult with your municipality for their spill reporting contact numbers.
Take home
Of course we’d rather avoid this problem altogether. Be sure to slow down before turning into a field. Take the turn as gradually as possible. Remember that soft spring ground and new pot holes can become serious obstacles – consider scouting the entry before the first spray or at minimum getting out of the cab and checking before entering.
Herbicide resistance has been called the number one threat to conventional herbicide-based weed management strategies.
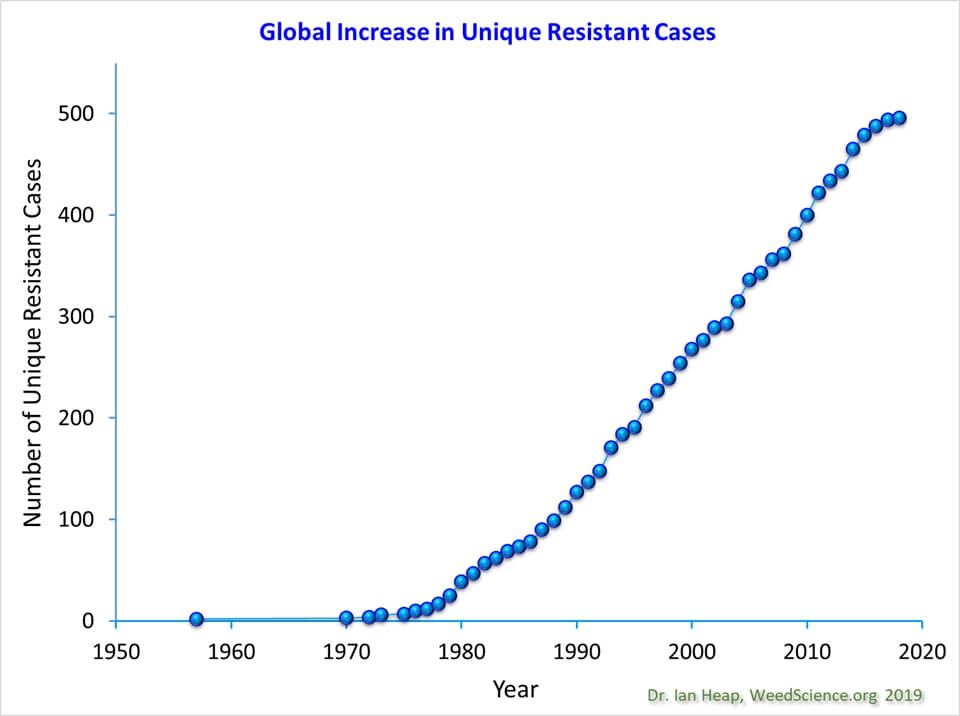
Since the 1970s, the number of cases of herbicide resistant weeds has shown a linear increase both globally (currently at about 500 documented unique weed species x mode of action cases) and within Canada (at about 70 such cases), according to the herbicide resistance website WeedScience.org. The rate of increase has been constant, and there is not yet any reason to believe that growth in the number of cases will slow.
Figure 1: Growth of global herbicide resistance cases (Source: WeedScience.org)
By using herbicides, we select for weed biotypes that, for some reason, can tolerate the product. Mutations which confer herbicide resistance are rare, but present at very low levels in most weed populations. Repeated use of the same mode of action will increase the relative frequency of the resistant biotype until it becomes noticeable, and shortly thereafter, problematic.
The best-known forms of resistance involve single-gene mutations that alter herbicide target sites (target sites might be enzymes that produce essential plant cell building blocks) so that herbicide binding is reduced, resulting in reduced control. As a result, the target pathway keeps working, and the plant grows normally after herbicide application. Other forms of resistance involve the overproduction of the target enzyme by the plant, mechanisms that either metabolize or sequester the herbicides, or changes in uptake of the herbicide. The main mechanisms are summarized in this table:
Table 1: Mechanisms of herbicide resistance*
Resistant Class
Mechanism
Target Site
Target site mutation
Increased gene copy number
Enzyme over-expression
Non Target-Site
Enhanced metabolism
Differential uptake
Differential redistribution
Sequestration
Delayed germination
Rapid necrosis / defoliation
*Source: Bo AB, Won OJ, Sin HT, Lee JJ, Park KW. 2017. Mechanisms of herbicide resistance in weeds. Korean Journal of Agricultural Science 44:001-015.
The simple act of using a herbicide can select for resistance to that herbicide. While we can’t predict or prevent resistance entirely, we can slow its onset by reducing the frequency of herbicide use, for example by integrating cultural controls such as crop rotation, seeding rate, cultivar competitiveness, and other factors into our agricultural systems.
A powerful option to slow resistance development is to reduce our reliance on a single mode of action, either by rotating modes of action in successive sprays, or, more importantly, by tank mixing multiple effective modes of action (MEMoA) whenever we make an application.
Let’s not kid ourselves. The recent discovery of glyphosate (e.g. Roundup) -resistant wild oats in Australia, and glufosinate (e.g. Liberty) -resistant ryegrasses in several countries is sobering. Relying more on these herbicides will only increase selection pressure.
If we decide to use herbicides, we need to look at the situation from the perspective of delaying the onset of resistance. What we’re trying to do is buy some time, so that new strategies can be developed.
How can spray application methods slow the onset of resistance?
The use of herbicides will continue to select for resistance. The best we can hope to achieve within a herbicide system is to delay that eventuality.
To better understand our options, we need to talk about a specific type of herbicide resistance called polygenic resistance. This refers to accumulation of additive genes of small effect over time, a process that is more efficient in plants that share genetic material among plants in a population, i.e., they outcross.
Outcrossing plants receive genetic material from others, increasing their genetic diversity, and therefore their ability to adapt.
In a field, a population of any specific weed may contain some individuals that have slightly greater tolerance to a herbicide than others. If we apply a slightly lower than label herbicide dose to those individuals, they might survive the application and eventually cross with other survivors and set seed. Their offspring may be as tolerant or even more tolerant than their parents. If this repeats itself over successive generations, the additive effects build until finally, low-level resistance becomes full-blown resistance and even label rate herbicides no longer work. This resistance isn’t a single gene mutation, it’s simply an accumulation of tolerance due to several genes which impact how much of the herbicide active ingredient reaches the target site.
In a recent study at the University of Arkansas, susceptible Palmer amaranth (P. amaranth has both male and female plants and is therefore an obligate outcrosser) was treated with a range of dicamba doses to identify individuals that survived the higher doses. The researchers allowed the survivors to cross, and then grew out their seed, then repeating the procedure. After just three generations, the experiment produced individuals with a three-fold increase in LD50 (compare LD50 at P0 (111) to P3 (309) in Table 2). Recall that LD50 refers to the dose required to observe 50% of the full effect.
Table 2: Dicamba doses (g ae/ha) required for 50% (LD50) and 90% (LD90) control of Palmer amaranth populations selected following sublethal doses of dicamba in the greenhouse.*
Herbicide resistance cannot be prevented if herbicides are applied.
To prevent polygenic resistance, we need to apply the full label rate and avoid repeated sublethal doses, so that all weeds are killed;
We need to apply Multiple Effective Modes of Action (MEMoA) whenever possible so that when one fails, the others have its back;
How can this be achieved?
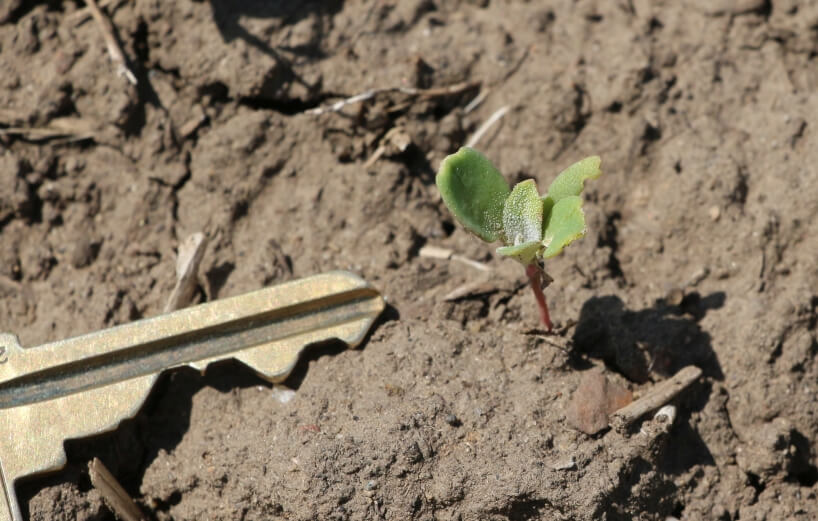
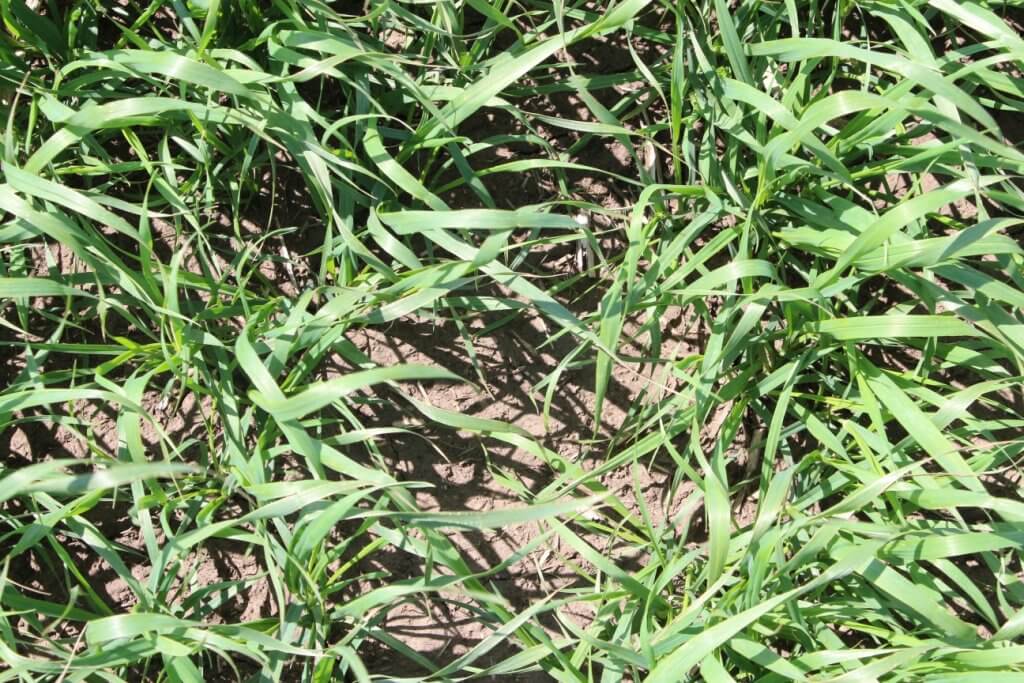
Prevent application practices that result in less effective dosing. Larger weeds, or weeds growing in difficult environmental conditions, may require higher herbicide doses. Early application is helpful because small weeds are easier to control. In addition, crop canopy shading at later staging leads to dose reduction and increases dose variability. Spraying under windy conditions also reduces dose, and can increase deposit variability. For some herbicides such as glyphosate or diquat, the dust generated by wind or fast travel speeds can reduce effectiveness.
Figure 2: Smaller, exposed weeds require lower doses to controlFigure 3: Crop canopies provide valuable competition to help suppress weeds, but they can also intercept spray, reducing the dose received by weeds.
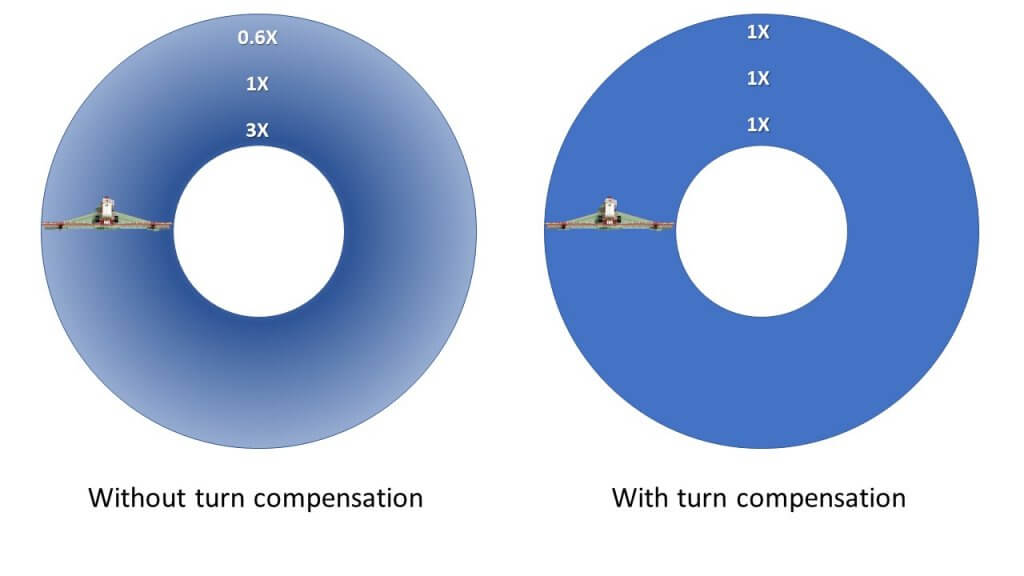
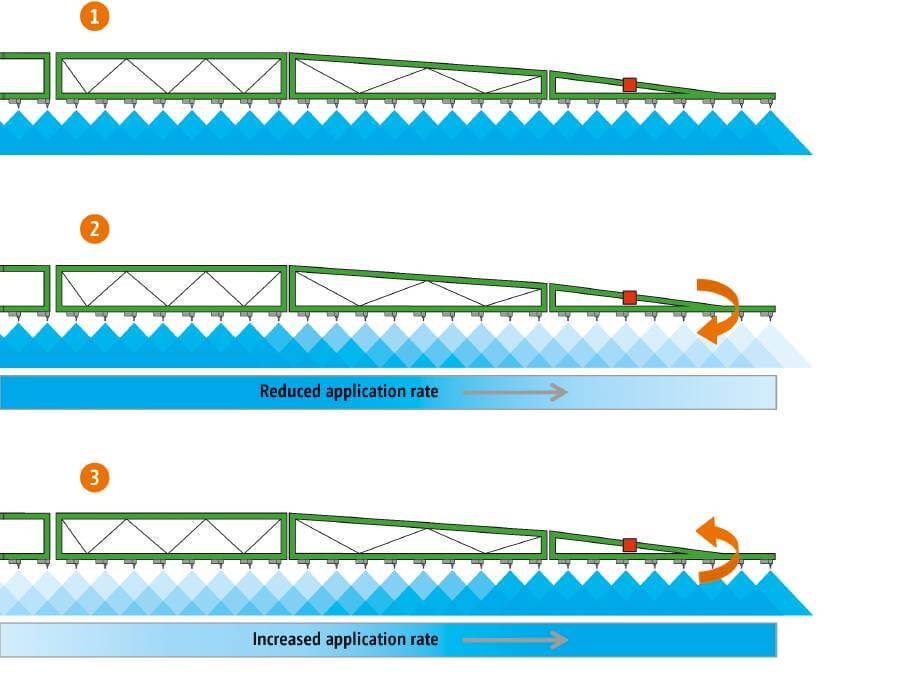
Get Pulse Width Modulation (PWM) with turn compensation. If your sprayer makes the same turn around the same feature year after year, then the outer boom region will under-dose the same part of the field over and over. This is the breeding ground for polygenic resistance. Look for this in field corners, around water bodies or tree bluffs, rock piles, etc.
Figure 4: PWM correction of under-dosing during a turn
Prevent boom sway and yaw. Boom movements result in uneven application, which results in lower control. Pull-type sprayers with supporting wheels are best, but these are becoming rare. Suspended boom performance depends on the manufacturer and the levelling technology they use. However, boom movement is usually more consistent with slower travel speeds.
Figure 5: Boom yaw causing over- and under-application (Source: Farmonline.com.au)
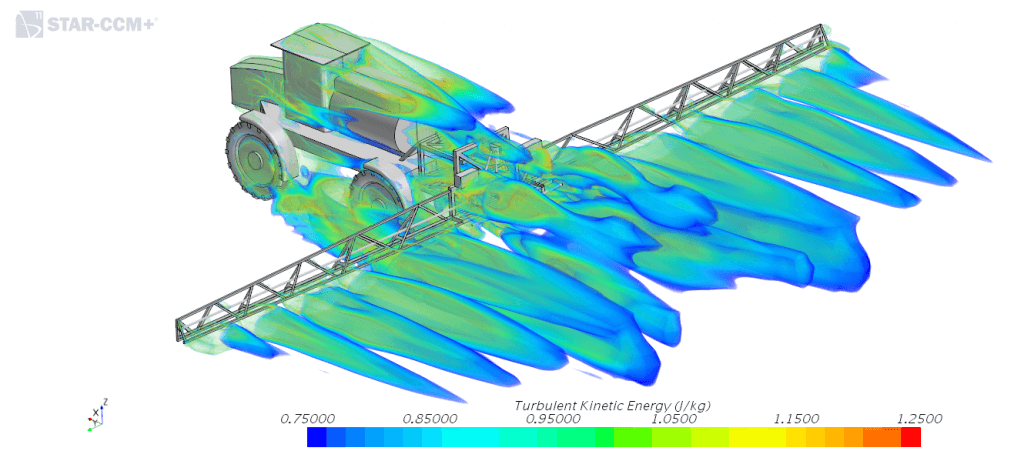
Minimize air turbulence. Large sprayers, and those moving at fast speeds, create aerodynamic turbulence that can displace spray. The main problem spots are wheels, in whose tracks measurably less spray is deposited. The exact dynamics of turbulence is still unknown, but we do know that its magnitude can be reduced with slower travel speeds.
Figure 6: Turbulence due to sprayer speed (Source: Dr. Hubert Landry, PAMI)
Consider spot spraying. The use of optical spot spray equipment, such as the new WEEDit Quadro, or Trimble’s WeedSeeker II, save product during burnoff or post-harvest. These savings can make the use of more elaborate, expensive tank mixes containing multiple effective modes of action, affordable.
Avoid spray drift. Field margins that harbour weeds rarely receive a full dose of herbicide. Exposing these weeds to spray drift won’t kill them. But it will, over time, select for weeds that are more able to tolerate the herbicide.
Implications
Aside from specific technology such as PWM, improved booms, or a spot sprayer, the most effective fix for variable application doses is slower travel speed.
While this may seem problematic when timing is critical and greater productivity is required, there is a way to drive more slowly and still get more done. We simply need to look at productivity differently.
We tend to equate productivity with speed. Travel speed. But a spray day is filled with many hours of non-spray time – filling, cleaning, transporting, repairing, fueling, record-keeping, etc. How much time is lost to these activities depends on the operation, but for everyone, it’s useful to do time accounting.
Record how a spray day’s time is spent. Pay attention to activities during which you can save time without much expense.
Action
Actual Time
Target Time
Fuelling, lubing
Loading jugs and totes
Checking label (rates, rainfastness…)
Filling tender tanks
Loading sprayer (in yard)
Transport to field
Entering field data into monitor
Checking, recording weather
Checking for pest, stage
Changing nozzles
Spraying load
Unplugging / replacing nozzles
Replacing nozzle body
Making turn
Filling sprayer
Getting sprayer unstuck
Driving to tender truck
Waiting for tender truck
Spraying out tank remainder
Cleaning tank
Cleaning filters
Flushing boom ends
Loading sprayer (in field)
TOTAL
On any given spray day, less time spent filling, or transporting, is credited to spray time. Our analysis shows that time lost to driving slower can more than be made up with these changes. The productivity gain gives more opportunity to spray under more ideal conditions that save yield and also ensure more uniform application.
Using productivity analysis, spraying can become more uniform and help delay the onset of resistance.
Note: The assistance of Dr. Charles Geddes, Research Scientist at AAFC Lethbridge, in drafting this article is appreciated.
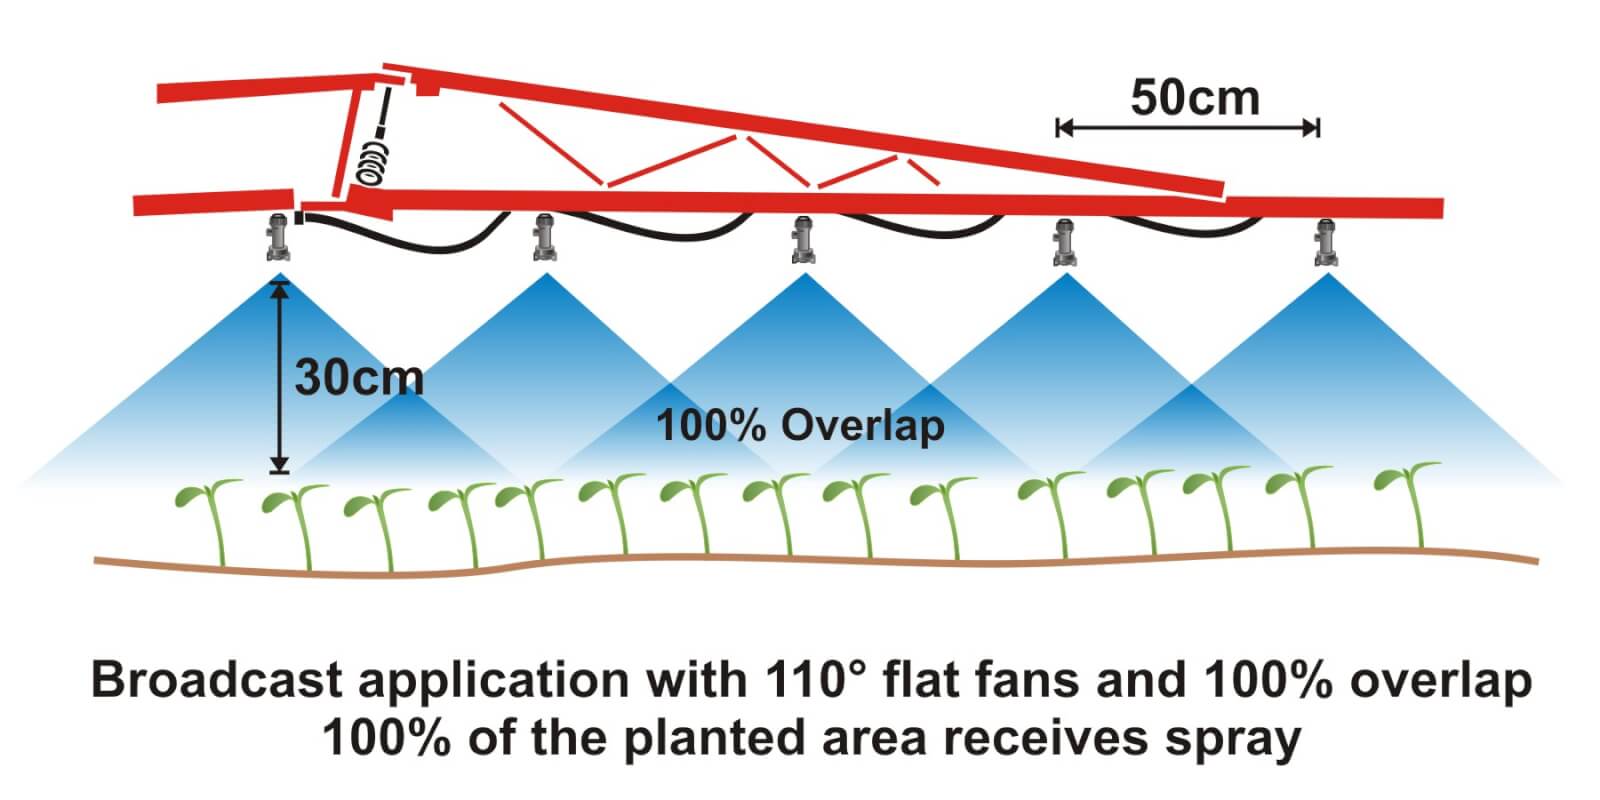
Where crops are planted in rows, growers can save on chemical costs and reduce potentially wasted spray by performing banded applications. A banded application is treating parallel bands (Figure one), unlike a broadcast application where the entire area is treated (Figure two). This means only a portion of the field or orchard/vineyard floor receives spray, so the total amount of product applied per hectare (or per acre) should be less for banded than for broadcast.
Figure 1Figure 2
Banded applications are used in many situations, including:
Applying herbicides right over a crop during planting, both for pre-emergent or post-emergent crops.
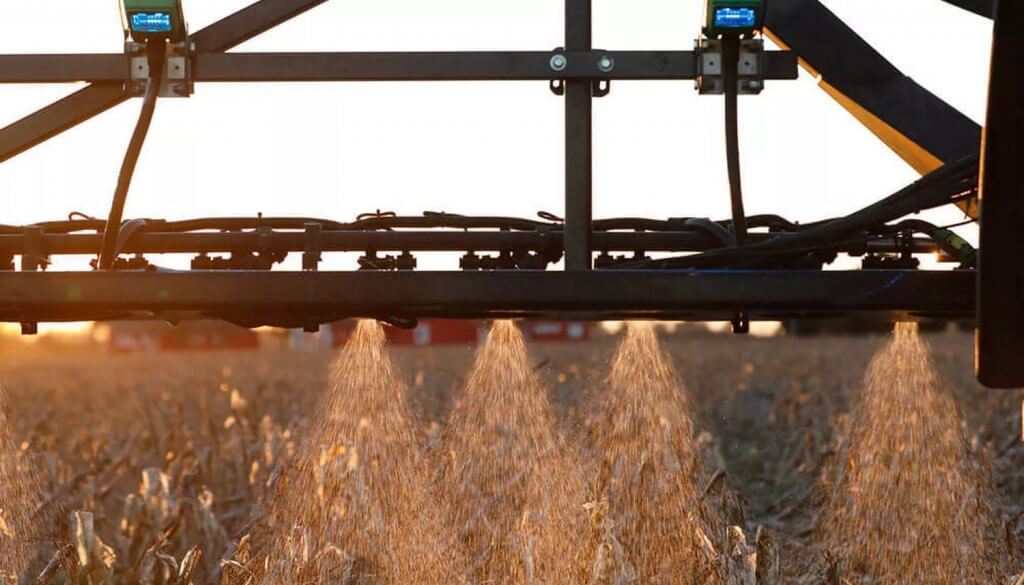
Applying insecticides/fungicides by “directed spraying” using drop hoses or row kits; the latter is pictured in Figure three.
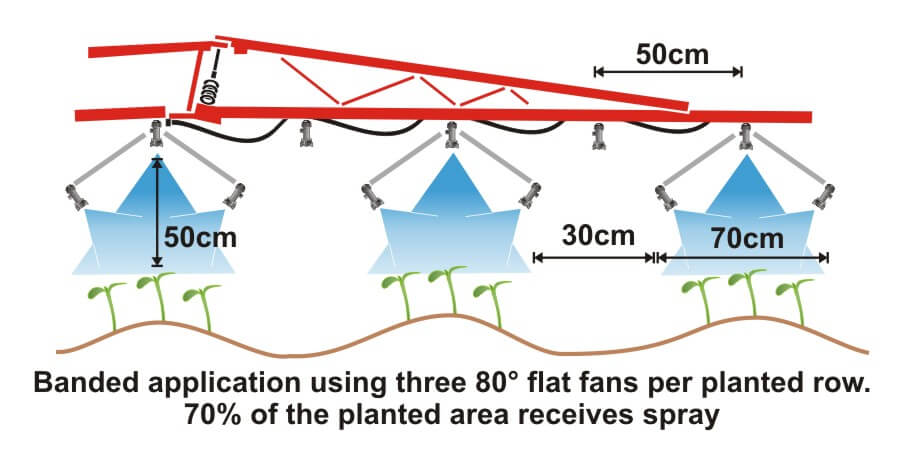
Carefully spraying herbicide between the rows to control weeds in the alleys of an established crop (Figure one).
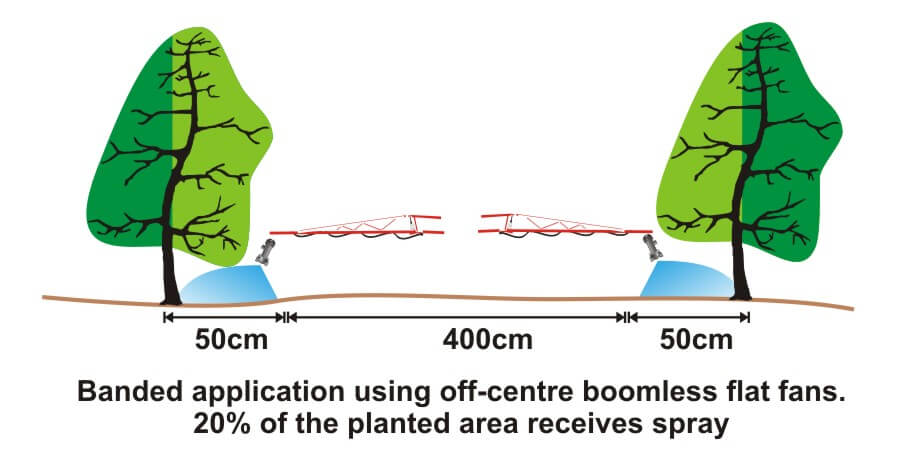
Applying herbicide under fruit trees or grape vines to control weeds (Figure four).
Figure 3Figure 4
It’s easy to make mistakes when calculating product rates for banded applications and these can be costly errors: too little means poor control and too much means wasted product and possible crop injury. This article describes how to calculate sprayer output and product rate for common banded applications.
Step One: Determine broadcast volume
Pesticide labels typically list broadcast product rates (e.g. amount of formulated product per hectare or acre). In this example, let’s say the label recommends a broadcast product rate of 500 ml of formulated herbicide applied using 100 litres of spray mix per hectare (i.e. added to 99.5 L water).
Step Two: Establish sprayer settings
Select a travel speed that is safe, gives decent efficiency and doesn’t compromise coverage. For this example, we’ll say the sprayer moving is at 8.0 km/h.
Select a band width that completely covers the target row and some of the adjacent area where control is desired. Band width should be measured along the ground for soil-applied products or along the top of plants for post-emergence products. We’ll use Figure one for our settings: bands are 50 cm wide on 100 cm centres. We’ll say that a single nozzle swath can treat the band, and that we’re spraying 2 hectares of planted area.
Step Three: Calculate the banded sprayer output
We can calculate how much of the planted area actually receives spray using this formula:
[band width (cm) ÷ row width (cm)] x total planted area (ha) = actual sprayed area (ha) [50 cm ÷ 100 cm] x 2 ha = 1 ha
For completeness, here’s the US formula: [band width (in) ÷ row width (in)] x total planted area (ac) = actual sprayed area (ac)
From this we now know that we should be able to go twice as far on a tank spraying a banded application as we would a broadcast, because we’re only spraying half the planted area.
Step four: Calculate the nozzle output
Use the following formula to convert the broadcast output into the banded output:
[broadcast output (L/ha) x travel speed (km/h) x (swath width (cm) ÷ number of nozzles per swath)] ÷ 60,000 = nozzle output (L/min) [100 L/ha x 8 km/h x (50 ÷ 1)] ÷ 60,000 = 0.67 L/min
For completeness, here’s the US formula: [broadcast output (gal/ac) x travel speed (mph) x (swath width (in) ÷ number of nozzles per swath)] ÷ 5,940 = nozzle output (gal/min)
If multiple nozzles were contributing to the swath, such as in figure three or figure four, this formula will account for it. You still mix the labelled product rate at a ratio of 500 ml of herbicide to 99.5 L water, but as we determined in step three, we should be able to spray twice the planted area using a banded application as we would a broadcast application.
Warning! Watch your units. You may be familiar with other formulae for calculating your output. Do not mix and match formulae or parts of formulae. For example, here is another Metric option for determining L/min. It employs different units so it requires a different constant:
[broadcast output (L/ha) x travel speed (m/min) x (swath width (m)) ÷ number of nozzles per swath)] ÷ 10,000 (m2/ha) = nozzle output (L/min)
Step Five: Use the nozzle catalogue to find the right nozzle
Using a nozzle manufacturer’s catalogue, select a nozzle that gives the desired spray quality (usually coarser for herbicides) and will produce the 50 cm swath we’re looking for (which can be adjusted a little using boom height). Always choose to operate a nozzle in the middle of its pressure range.
Step Six: Calibrate the sprayer (i.e. double-check)
Follow your typical calibration process and make minor adjustments until the nozzle discharge per minute results in the desired banded output. A rate controller will handle this on larger sprayers, but if you don’t have one you can make small adjustments to speed and pressure until the desired output is achieved. Ideally, if your math was right, these changes won’t be needed.
When performed correctly, banded applications are a great way to focus your efforts on the target, saving time and money.
Here are a few additional resources if you’d like to learn more, or work with a few online calculators:
With due respect to Mickey and Mr. Lucas, and the massive hype surrounding Star Wars Episode VII, we felt we should jump on the bandwagon. Here’s episode IV in our series of short, educational and irreverent videos made with Real Agriculture.
If there’s a single take-home message in this episode it’s this:
In this episode of Exploding Sprayer Myths we reduce a complicated best practice to black and white… literally. Watch as Jason and Tom get a creepy lesson in the do’s and do not’s of no-spray areas. Under the watchful eye of Dr. Jim Todd (OMAFRA Industrial Crops Specialist and Rod Serling cos-player), brace yourself as you enter The Buffer Zone.
Learn more about how vegetative filter strips mitigate runoff on this Health Canada webpage.
Thanks to the staff at the Simcoe Resource Station and to RealAgriculture for making this video possible.
And if you’re curious about the kitchen-appliance cameo, you’ll have refer back to earlier episodes.