Tag: clean

  • Remove and scrub your filters – Even when you use Dawn

    Remove and scrub your filters – Even when you use Dawn

    This article was co-developed by Mike Cowbrough, OMAFRA Weed Management Specialist in Field Crops

    Why scrub filters?

    Why do we ask you to manually scrub residue from sprayer filters and housings before changing chemistries? Here are three reasons why rinsing in-place may not be good enough:

    • There is potential for biologically-active levels of residue to persist in filters, even after a triple rinse, that could harm the next crop sprayed.
    • Persistent residues could cause physical antagonism with the chemistry you use next. This can cost time and/or efficacy should it plug filters and nozzles or reduce spray uniformity.
    • Persistent residues could cause chemical antagonism with the chemistry you use next – even several batches later. This could harm crops when the residue carried over from a much earlier application suddenly becomes soluble again thanks to detergents or pH adjusters in subsequent tank mixes.

    An experiment

    To some, the previous statements may seem excessive. Many sprayer operators claim that scrubbing filters is time consuming, or that they’ve never had a problem before, or that the tiny amount of residue they see in the filters after rinsing couldn’t possibly cause damage. We decided to test the efficacy of rinsing filters without removing them.

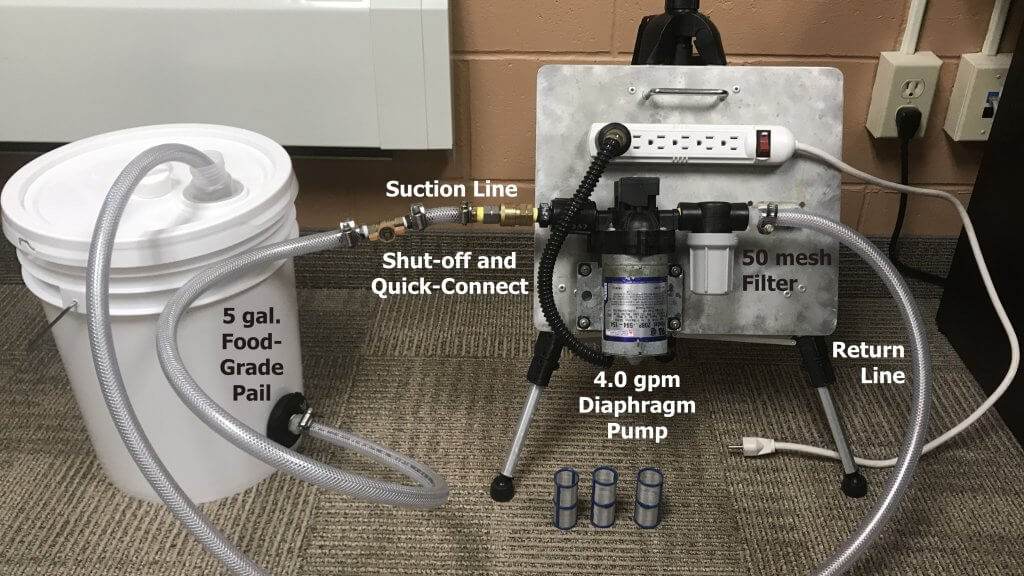
    We constructed a table-top system that could circulate chemistry through a 50 mesh filter. Think of it as a scaled-down sprayer that returns solution to the tank rather than spray it out. It replicates what the line filters on a larger sprayer might experience during a typical spray day.

    Table-top system to circulate spray mix at 1 gallon per minute through a 50 mesh filter.

    The method

    The tank (i.e. the bucket) would be filled with a tank mix and circulated through the filter to replicate a spray day. The contaminated filter could then be sampled to establish a baseline, and then alternately contaminated and rinsed in place to compare how much residue remained. Specifically, we would drop the filter housing and scrub all surfaces in 500 ml of water to collect any and all residue.

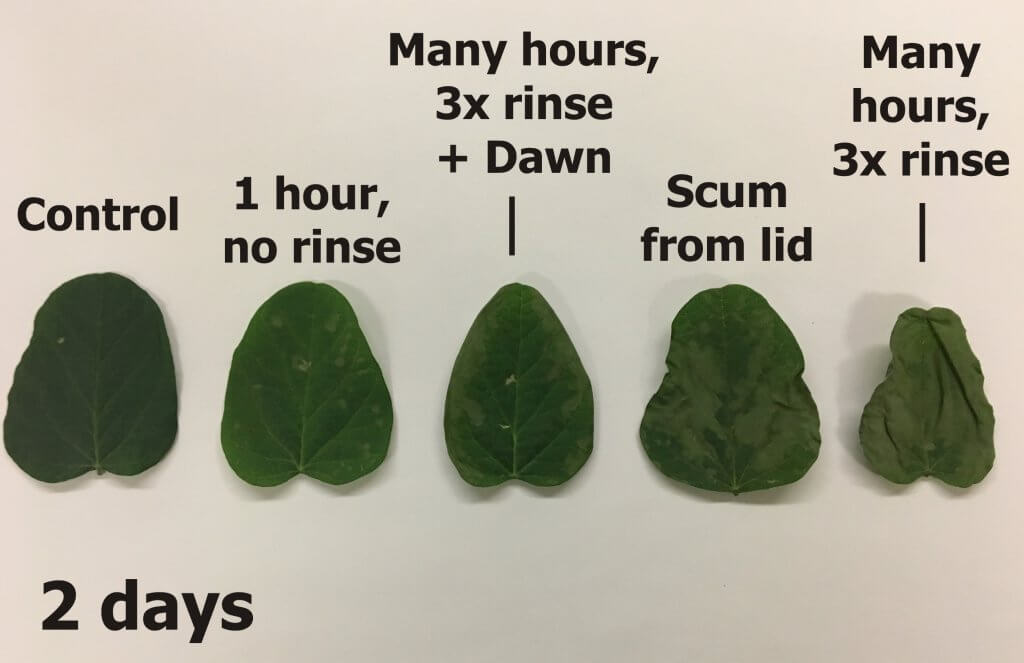
    Each sample collected would be poured through a filter for a visual check of residue. A small volume would be reserved to be sprayed on soybean and white bean seedlings as a bio assay of activity.

    The process

    We used Sencor (metribuzin) mixed at a rate that represented the low end of the label: 250 grams of product per acre at 5 gallons per acre. Not knowing what to expect, we circulated the solution through the filter for 20 minutes pumped at a rate of 1 gallon per minute and peeked into the tank.

    After 20 minutes of circulation, Sencor began to foam.

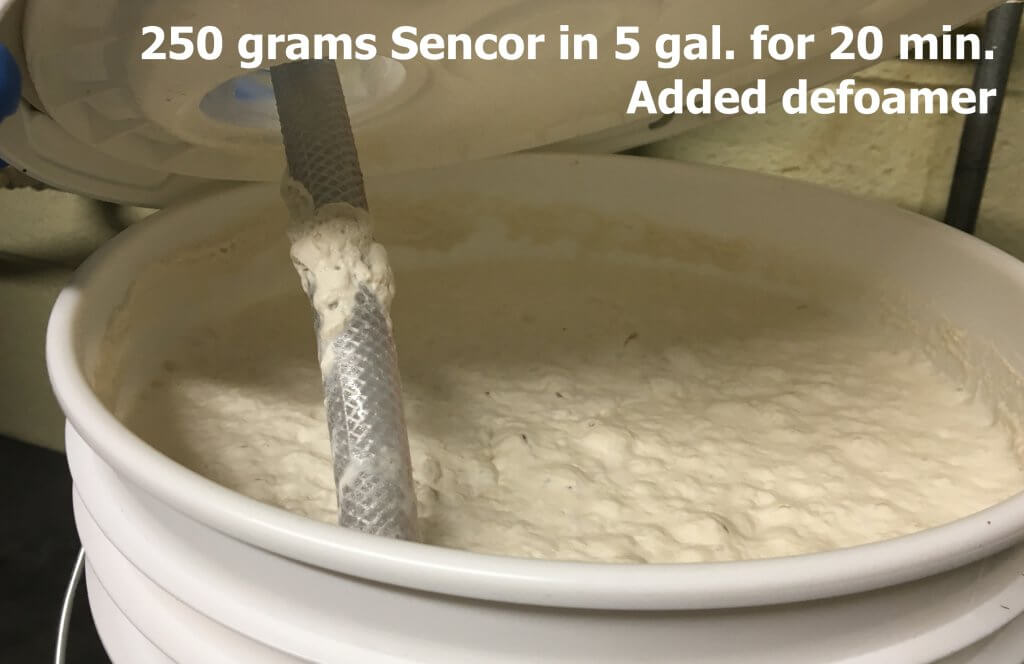
    Seeing that we were creating foam, we decided to add defoamer. Then we peeked into the filter housing to see what had accumulated so far.

    Very little residue was found on the filter or in the housing after 20 minutes of circulation.

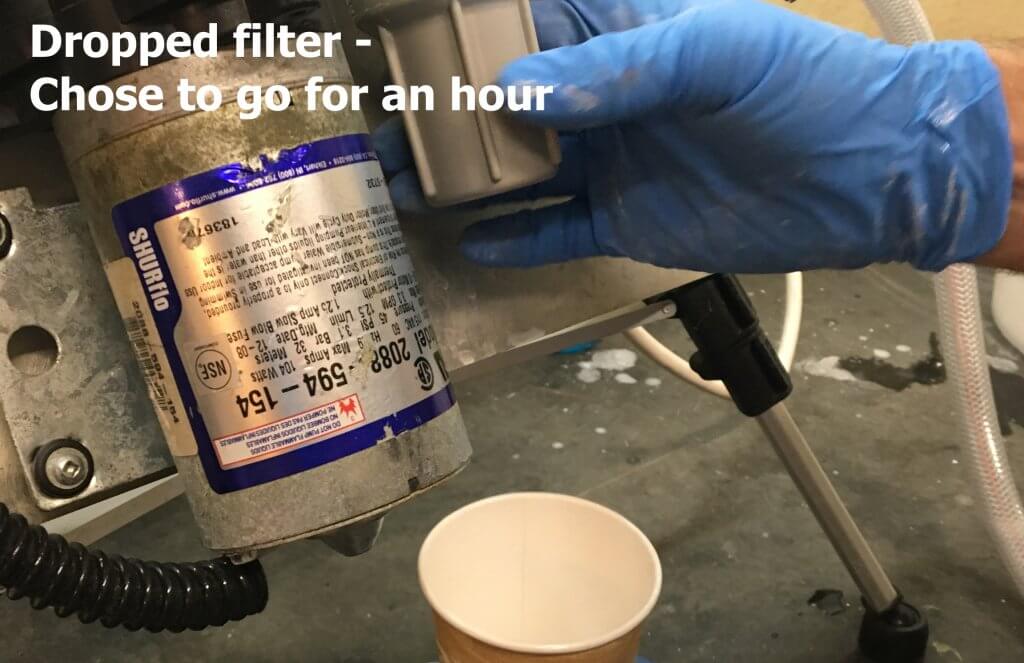
    Finding very little in the way of residue, we chose to let the system circulate for an hour. We felt this would represent a single real-world tank’s worth of product. Since we’d added defoamer, we decided it was safe to leave the lab and let the system circulate…

    Foam overs: No fun in the field and no fun in the lab.

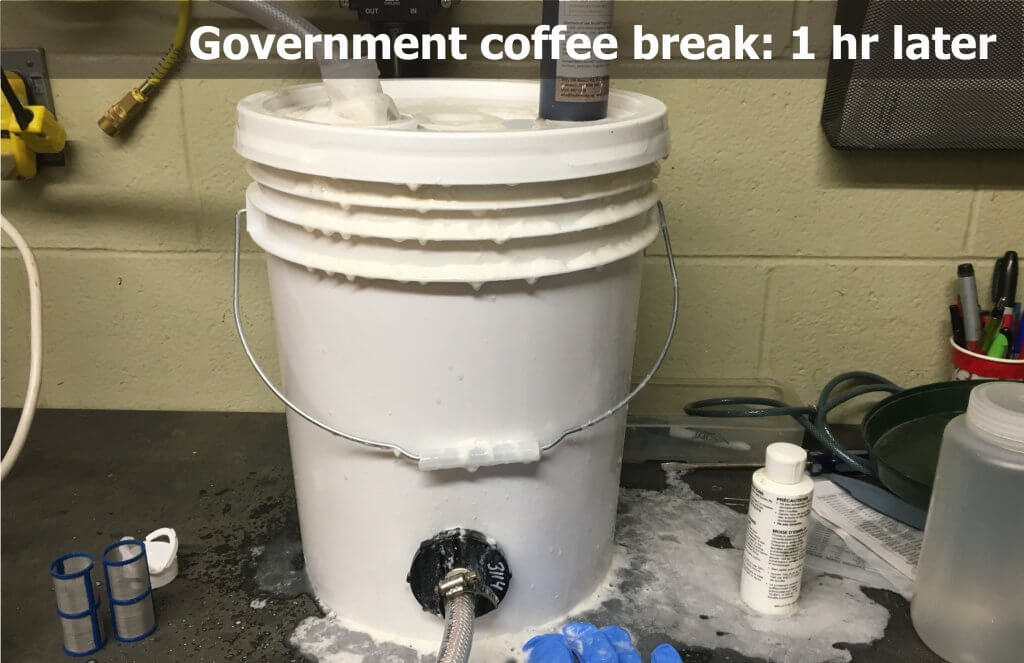
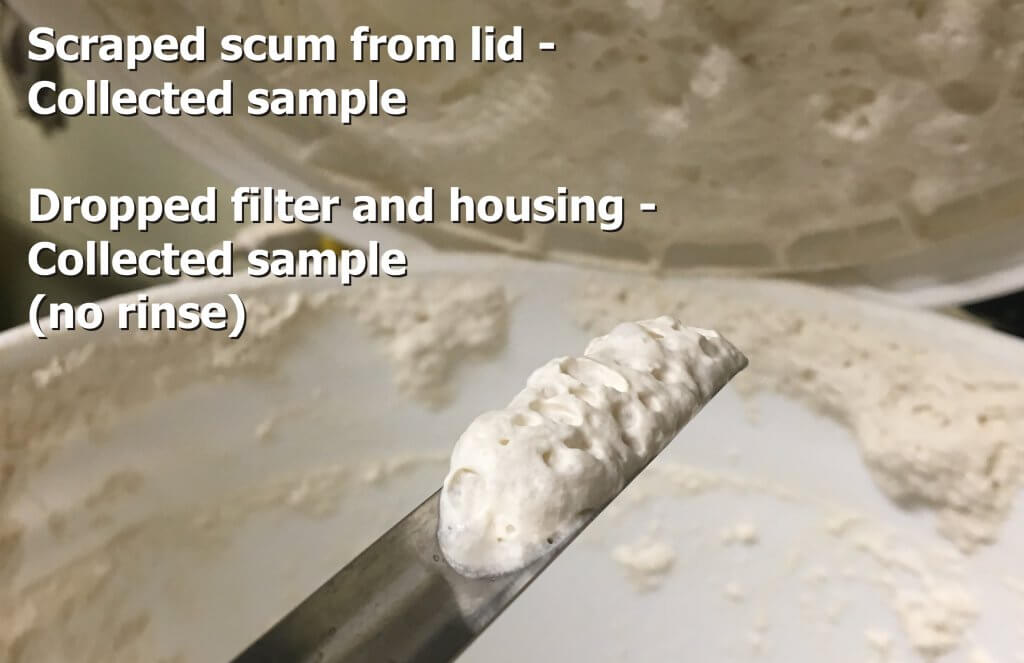
    Despite having added defoamer, we had a mess to clean up. When we opened the bucket we noted all the product clinging to the lid (see below). We collected some of this scum to replicate what might be clinging to parts of the spray tank that are not adequately covered by rinse-down nozzles. We then dropped the filter into 500 ml of water and scrubbed the housing and filter to collect any and all residue.

    Collecting residue from the bucket lid to replicate what might remain in a tank that is not sufficiently rinsed.

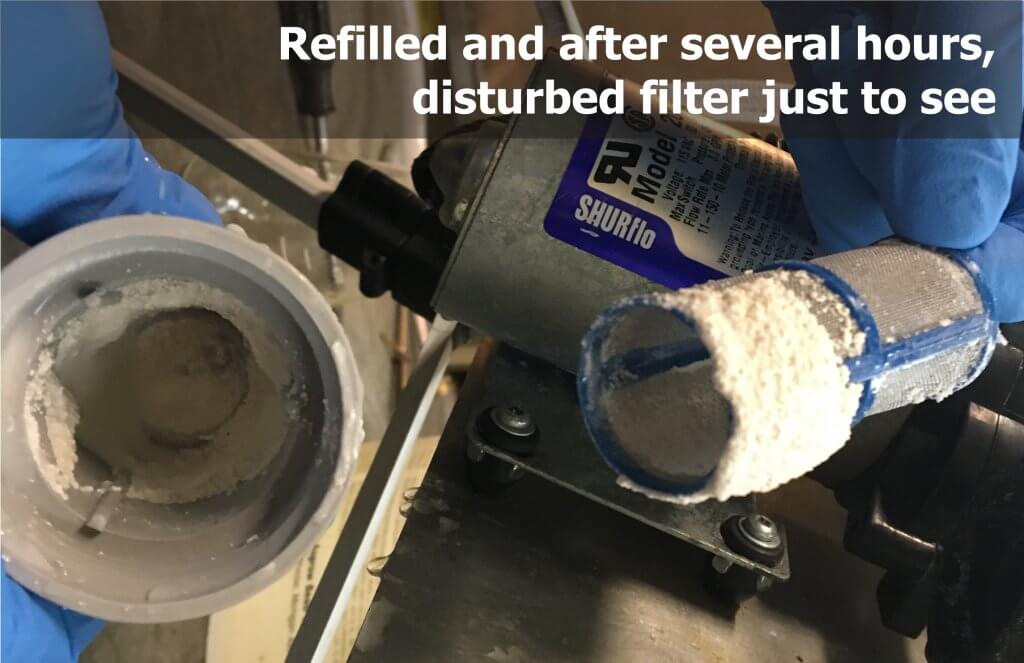
    We then added additional defoamer and checked in regularly as we circulated the mixture for several hours to replicate a full day of spraying. This time when we checked to see how much residue we had collected, found a surprising amount.

    Residue following several hours of circulation, prior to triple rinsing with water.

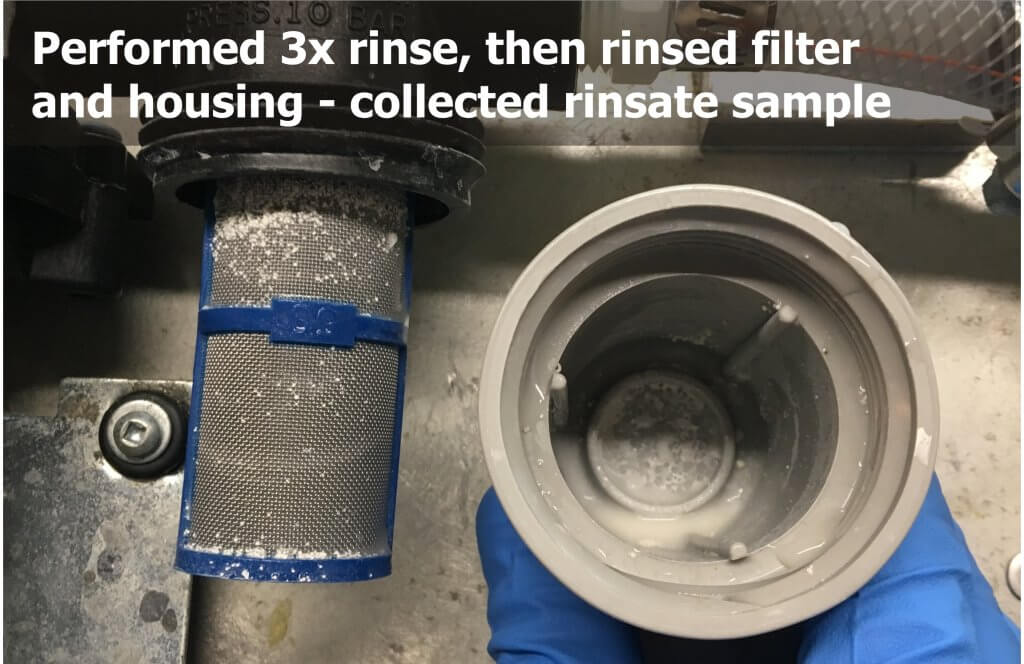
    We replaced the filter and performed a triple rinse with water before dropping the filter to collect our residue sample. As shown below, the triple rinse cleared much of the residue, but trace amounts were still visible.

    Residue following several hours of circulation and a triple rinse with water.

    Dawn Detergent and the 5 Second Squeeze

    We refilled the tank with Sencor and defoamer and circulated it for several hours to once again contaminate the filter. This time, however, we added detergent to the second rinse. We did this in response to claims that Dawn dish detergent removed residues from dry products such as Atrazine without having to drop the filters.

    A former agrichemical rep explained that the practice likely originated in Western Canada some years ago when several growers suddenly experienced physical incompatibilities with a particular batch of dry product. It was suspected that the problem was due to abnormally cold temperatures during mixing, but the result was that many were left with solids in the tanks that could not be flushed.

    Ionic surfactants are found in “cheap and nasty” shampoos, dish detergents and car care products. They can be tough on the skin, but they are of higher surfactantcy than NIS. And so, agrichemical reps bought pallets of Dawn dish detergent (Branded “Fairy” in the UK) from big box stores and found it broke the solids down sufficiently to flush the tanks. From there, it is likely growers started adding it during the rinse to facilitate cleanout. But, is the “Five second squeeze” a myth or does it work?

    Results

    Adding Dawn detergent to the second rinse reduced visible residue in the filter housing and on the plastic sides of pop bottles that stored the rinsate.

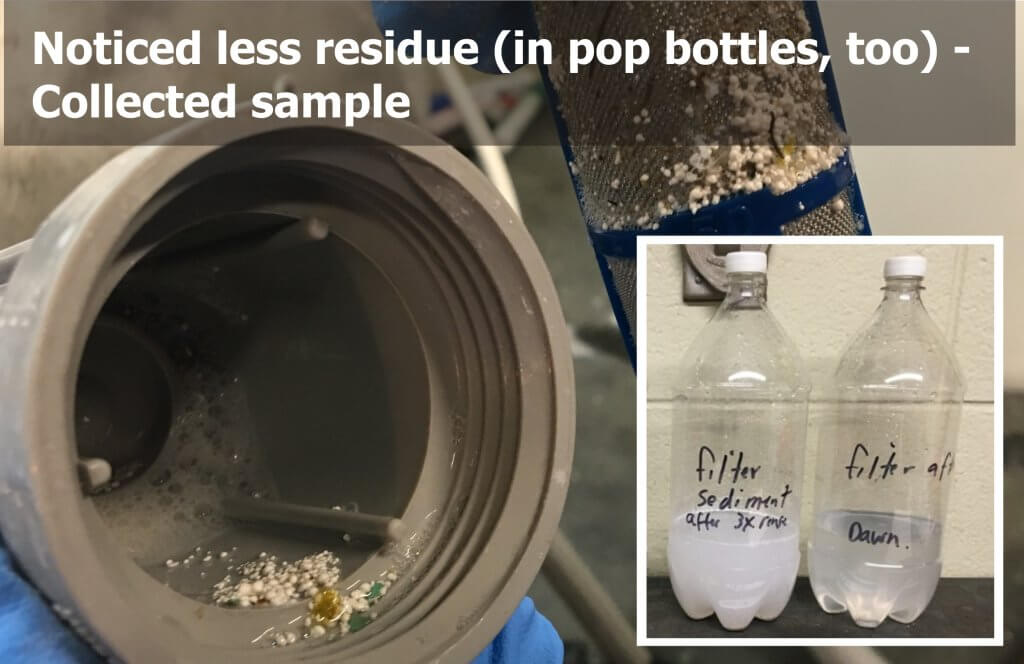
    We saw a visible reduction in the filmy residue left behind by Sencor in the filter housing and on the walls of the pop bottles used to store the rinsate. It was easy to see why the 5 second squeeze appeared to improve matters… but was there enough residue to still there to cause trouble?

    Rinsate filtered through red cloth for a visual check of residue.

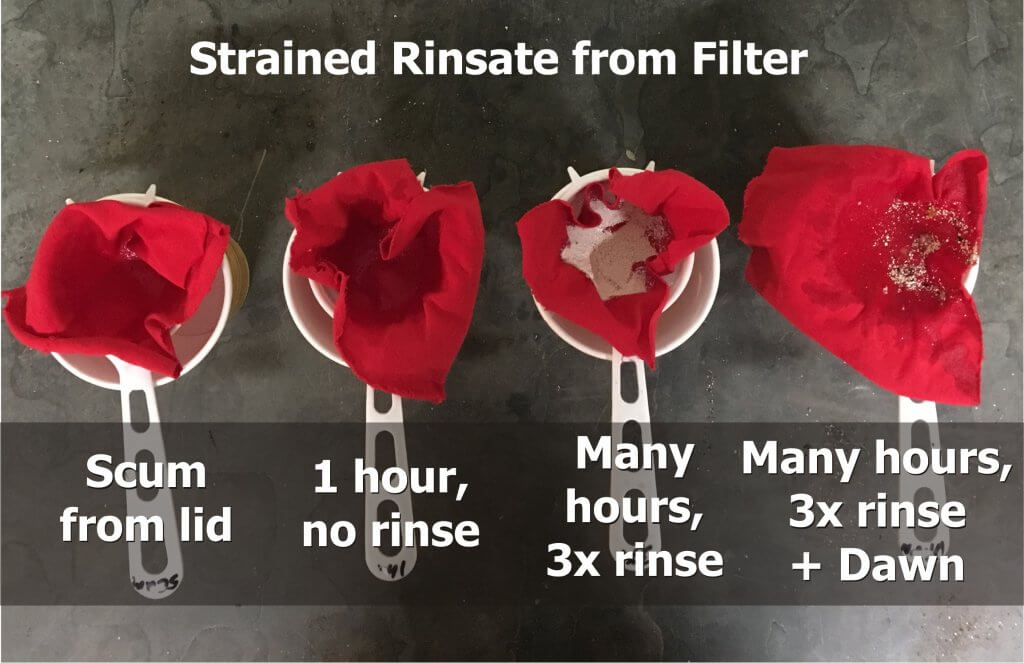
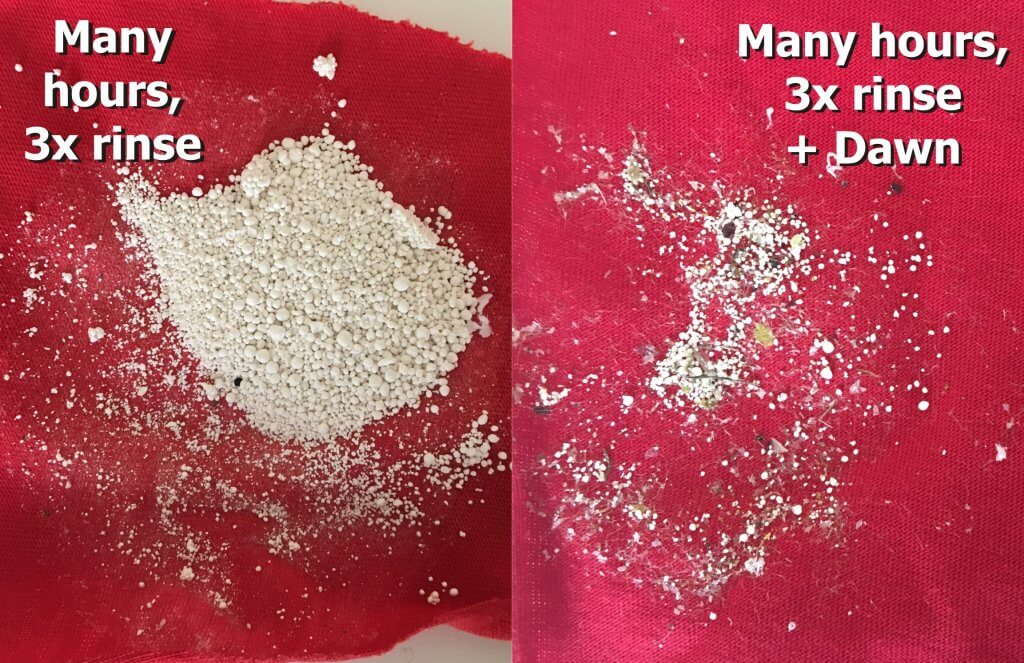
    We poured the rinsate from each sample through red cloth. There was little or no visible evidence of Sencor in the sample taken from the lid of the filter following an hour of spraying (left), or our baseline sample of a filter contaminated after an hour of circulation with no rinse (second from left). There was a great deal in the sample from the filter following “a day’s spraying” and a triple rinse (second from right), and less in the triple rinse containing detergent (right). These last two conditions are compared below.

    Following several hours of spraying, residue following a triple rinse with water (left) and a triple rinse with detergent in the second rinse (right).

    A volume of the rinsate from each sample was reserved for bio assay on soybean seedlings. The filter in the spray booth was cleaned thoroughly between conditions.

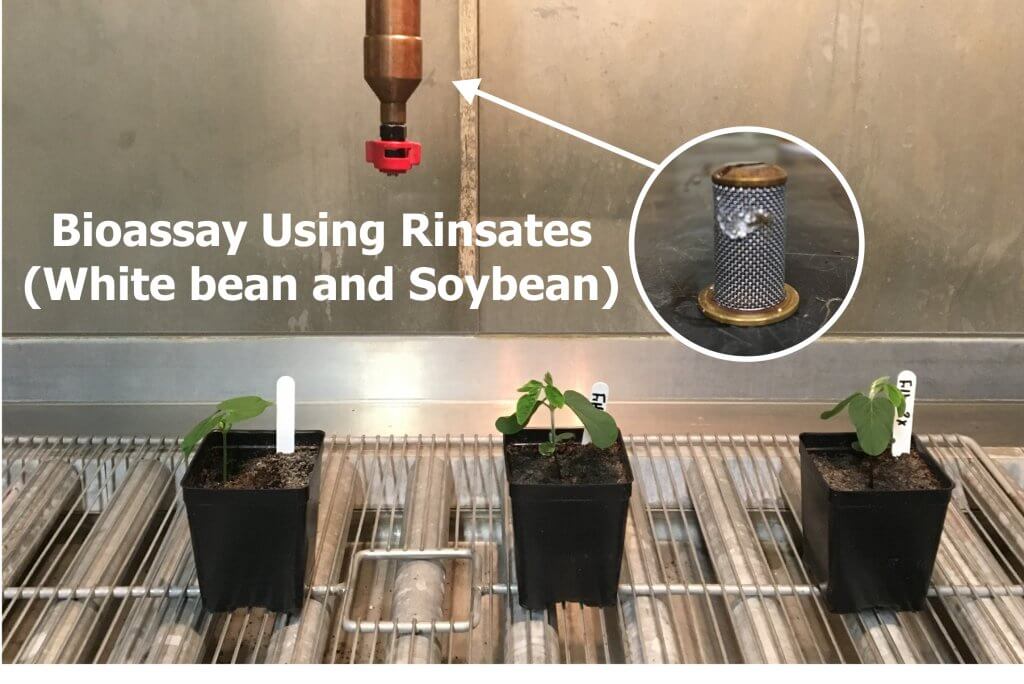
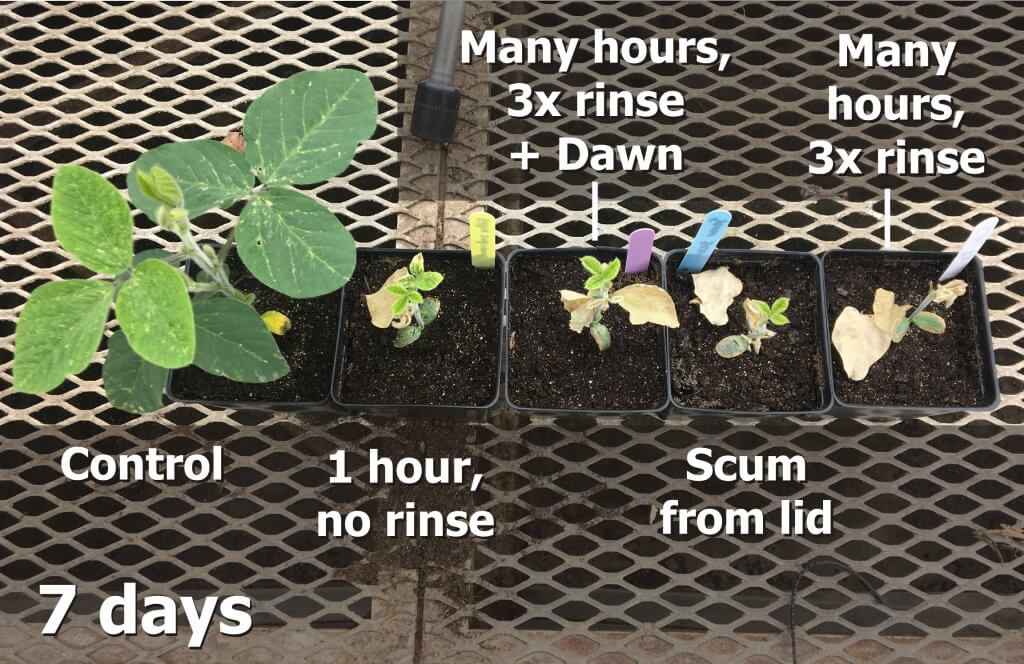
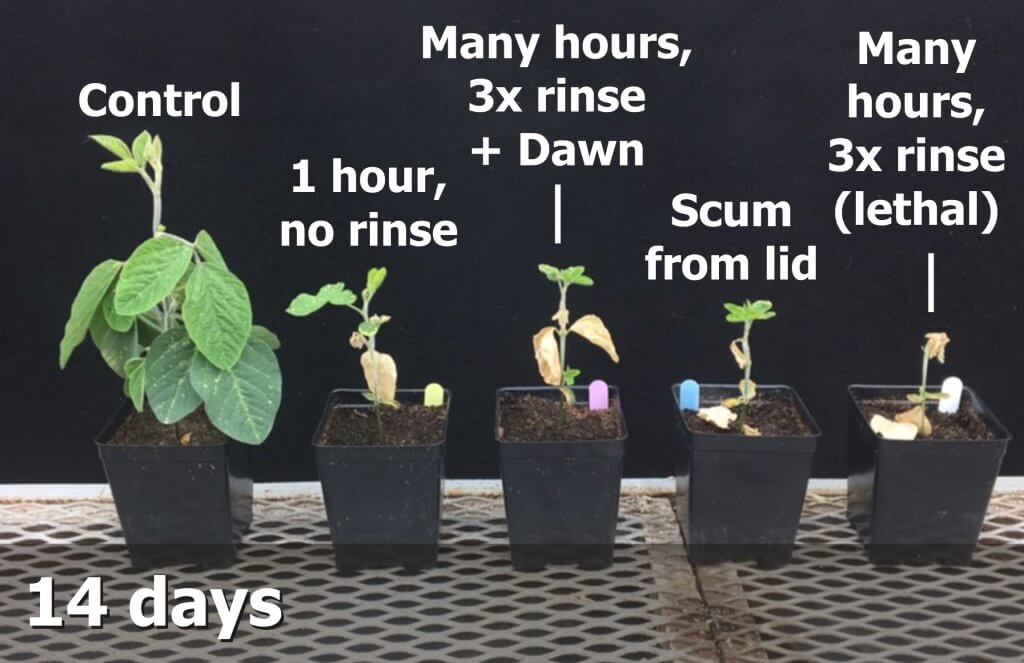
    The following images show that even when there was little or no visible residue, there was still sufficient activity remaining to injure, or in the case of the triple rinse with water, kill soybean seedlings.

    Summary

    Bear in mind that this is a single experiment with a single chemistry, but it does support the following observations:

    • Always rinse the sprayer as soon as possible and pay attention to dead-end plumbing and filters. Diligence is a function of knowing what was sprayed last, what is coming next, and the sensitivity of the crops being sprayed.
    • Cleaners do not decontaminate – they loosen residues to make rinsing more effective. In our experiment, Dawn detergent appeared to reduce residue and that will keep you spraying plug-free for longer. But, the bioassay showed sufficient activity remained to cause carry-over damage.
    • A triple rinse with water may be insufficient to remove residue from filters. Even if the residue left behind does not cause damage in the next crop sprayed, it can persist and has the potential to react antagonistically with subsequent sprays.

    Bonus: Pro Tips

    Not long after publishing this article, we were contacted by a grower who had difficulties with clay-based products plugging up his filters. It took a carry-over incident to convince him he needed to address the problem, so he installed $20 ball valves at the bottom of the filter housings. This isn’t as good as dropping and scrubbing filters, but opening and closing the valve under pressure during rinsing blew the filters clear of visible residue. Others have noted similar modifications on the pump of their tender truck to clear the filter of algae.

    Other options include a hydraulic-style ball valve (stronger than plastic). Or, install a gator lock cam after the valve and insert a plug so if it’s accidentally opened it won’t dump the tank. Just keep a hose in the toolbox and insert it when you need to flush. Finally, one grower added a Thompson strainer to the sprayer and removed the screens from the Banjo Y’s. He ran a 1″ hose from the Thompson to a valve by the work station and cracks it open as part of every rinse.

    A cheap and effective solution for clearing filters of residue. Not as good as dropping and scrubbing, but a great compromise.
    Ball valves tend to protrude below the sprayer, so they may catch high corn. Be careful.
  • Continuous rinsing for airblast sprayers

    Continuous rinsing for airblast sprayers

    Why Rinse?

    Airblast sprayers are not rinsed as frequently or as diligently as field sprayers. This is primarily because they are not used to spray herbicides, so residue carry-over doesn’t incur an immediately obvious penalty. The typical operator rinses prior to long-term storage or when cross contamination might cause some form of antagonism (e.g. dormant oil followed by Captan or sulfur).

    Learn more about the difference between rinsing and cleaning in this article.

    Aftermarket Rinsing Systems

    Airblast sprayers can be outfitted with rinsing systems that permit operators to rinse quickly, easily, and dispose of dilute rinsate in rotating locations.

    A Serial Rinse (SR) system, common on field sprayers, re-purposes the pump to transfer clean water from a saddle tank to the product tank via tank rinse nozzles. The operator introduces a volume of clean water to the remaining volume in the tank, circulates it through the system, and then sprays the rinsate in the crop. Repeating this process three times (i.e. the Triple Rinse) serially dilutes the remainder, resulting in a higher dilution factor than a single high-volume rinse.

    A Continuous Rinse (CR) system requires the addition of a dedicated rinse pump. In this case the operator introduces clean water to the tank via tank rinse nozzles while simultaneously spraying. While there is circulation from the bypass (and/or agitation) circuit, the remaining volume is diluted and essentially displaced by clean water.

    Objective

    Using a fluorescent dye tracer as an analog for pesticide, we wanted to explore the effectiveness and efficiency of both systems. We describe the fluorimetry method in this article. We installed a CR system in a 2,000 L H.S.S. tower sprayer, which unlike most North American airblast sprayers, already features a SR system (150 L clean water tank and two tank rinse nozzles).

    Installing a Continuous Rinse System

    Installing a CR option required us to address the same three criteria we have already discussed in previous articles on field sprayer installs:

    • Identifying a CR pump with sufficient flow to operate the tank rinse nozzles
    • Satisfying the electrical or hydraulic requirements of the CR pump
    • Matching the supply flow from the CR pump to the demand flow at the booms
    The Hol sprayer with an 18-nozzle ducted tower, 150 L clean water tank and two tank rinse nozzles. Inset: Rhodamine WT dye used as a pesticide analog for comparing residue levels.

    We mounted two electric Shurflo pumps in parallel to provide flow sufficient to match the typical demand at the booms without excessive electrical load.

    Parallel electric Shurflo pumps drew low amperage and provided sufficient flow to the boom.

    We found that while the CR flow spun the tank rinse nozzles weakly, the spray didn’t reach all interior surfaces. This was remedied by adding a deflector plate to the bottom of the nozzles to redirect flow.

    A brass disc mounted on the tank rinse nozzle deflected spray to all interior surfaces.

    We encountered a complication installing CR on an airblast sprayer compared to a field sprayer. Most field sprayers have rate controllers that permit the operator to adjust travel speed or ‘dial in’ a rate to match boom demand to CR pump supply. Unless the airblast sprayer already has this feature, the operator has to calculate in advance how best to match the flows.

    The calculation has to be performed for each unique output (e.g. dilute or concentrate nozzle arrangements). The flow from the CR pump is a known constant. The nozzle output is variable according to operating pressure, calculated using a nozzle guide. The operator can adjust pressure (bypass or pressure regulator), PTO-speed (on positive displacement pumps), or even alternate between booms or boom-sections to match the flows.

    Matching flow demand to supply using a nozzle catalogue.

    In our case, the operator was using 12 blue Albuz hollow cones in their orchard. We knew the CR pump output was 24.25 L/min. So, by setting the pressure to 6.1 bar prior to rinsing, we were spraying about 24.5 L/min. We parked the sprayer and watched to ensure the sump did not fill or drain during CR. Note in the following video how well the two flow rates were balanced (the camera was accidentally turned when we showed the vertical boom).

    During trials we noticed that as the sprayer climbed uphill the water level in the tank shifted and the pump drew a little air, causing the nozzles to briefly sputter. This was a welcome sight given reports that introducing a few air bubbles during continuous rinsing can be beneficial.

    Field Testing

    During testing, we filled the 2,000 L Hol sprayer with 500 L of water and a final concentration of 0.25 ppm rhodamine (0.5 mL dye per 500 L water). The clean water tank was filled to 150 L. We allowed the mix to circulate for two minutes before priming the booms by spraying for a minute. A 50 mL sample was then drawn from the manifold (see below) and later used to represent the starting concentration during the analysis. The sprayer then drove through the orchard, spraying until empty.

    Samples were drawn after the tank, before the manifold. Note the telltale Mancozeb coating the sprayer. PPE was worn.

    Serial Rinse testing: When the sprayer was empty, the operator left the cab to introduce 75 L of clean water to the main tank via the tank wash nozzles. The rinsate was circulated for one minute before the operator returned to the cab and sprayed the orchard until empty. A 50 mL sample was drawn from the manifold to represent the concentration half-way through the rinse. The process was repeated for the remaining 75 L of clean water and a second 50 ml sample was drawn to represent the final concentration. We did this twice. It took about 12 minutes to rinse the sprayer and the operator had to leave the tractor cab twice.

    Continuous Rinse testing: When the sprayer was empty, the operator stopped spraying and engaged the continuous rinse pump. After a few seconds, he continued driving and spraying rinsate. When 75 L had passed through the system, we paused to draw a 50 mL sample from the manifold to represent the concentration half-way through the rinse. The operator continued until the remaining 75 L was sprayed and a second 50 ml sample was drawn to represent the final concentration. We did this twice. It took about 5 minutes, 45 seconds to rinse the sprayer and the operator did not leave the tractor cab.

    Sample Analysis: A Turner TD 700 fluorometer was calibrated using samples from the tank. Samples were diluted when necessary to ensure they fell in range of the calibration curve (where there is a linear relationship between the concentration of Rhodamine WT and Raw Fluorescence Units (FSU)). This range spanned a maximum of 0.1 ppm and a detection limit of 0.01 ppm active ingredient. Having previously tested recovery accuracy of 95%, data was adjusted accordingly.

    Results of rinsate analysis. n=2.

    Observations

    While both methods diluted the residue significantly, the remainder following both Serial and Continuous Rinse was much higher than anticipated. This may be an artifact given that both concentrations are potentially below our detection limit, per the following:

    Assuming 10 L of residual spray volume left in the system once “empty”, 75 L added would give a dilution factor of 9 (according to the ). While the first 75 L of Continuous Rinse seems to remove more residue than a single addition of 75 L, both are higher than anticipated. A subsequent addition of 75 L should result in a dilution factor of 72. In this case, the remainder would be below our fluorometer’s detection limit, and could explain the results.

    Nevertheless, there were positive observations:

    • Continuous Rinse resulted in a more dilute rinsate with less water than Serial Rinse.
    • Continuous Rinse took less time than Serial Rinse.
    • The operator did not leave the tractor cab during Continuous Rinse.
    • Potentially, any remaining water from the Continuous Rinse system could be used to operate a spray wand to rinse the sprayer exterior before leaving the crop.
    • Both systems encourage improved airblast sprayer sanitation and reduce environmental impact from point source contamination.

    Thanks to ProvideAgro for performing the installation, Wilmot Orchards in Ontario for supplying the sprayer and running the trials, and OMAFRA summer student Aidan Morgan for assistance with the data analysis.

  • Biobeds for Pesticide Waste Disposal

    Biobeds for Pesticide Waste Disposal

    One of the most challenging aspects of a spray operation is the disposal of leftovers or rinsate containing pesticides. Let’s be honest, too much of it is drained onto the ground in a corner of the yard or the field. Nobody’s happy about that, nobody’s proud of it, but what are the alternatives?

    Waste disposal is a skeleton in the closet of the pesticide industry. One of the problems is the time-consuming nature of sprayer cleaning, and the lack of clear guidelines on product labels that pass the buck.  Too often, the applicator is asked to “act in accordance with provincial or state guidelines”, which is essentially a dead end.

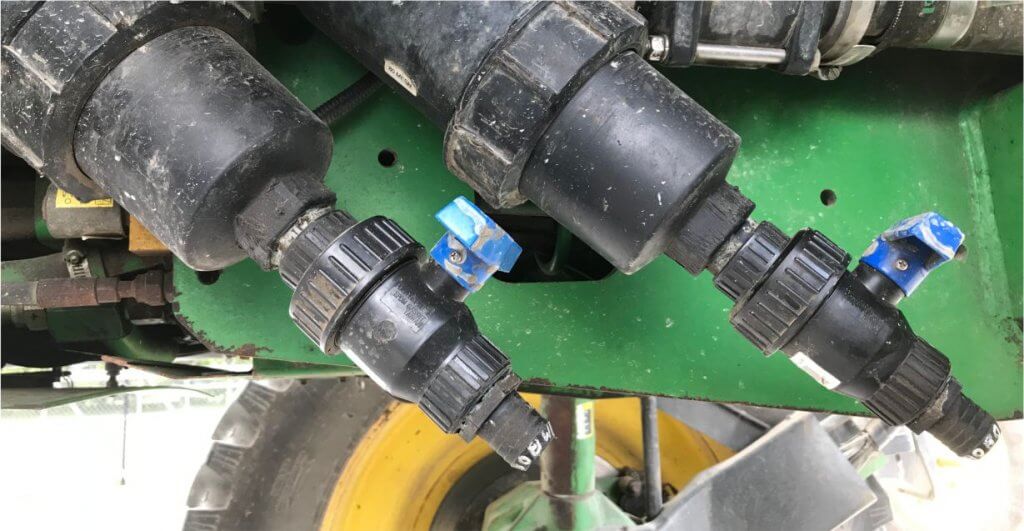
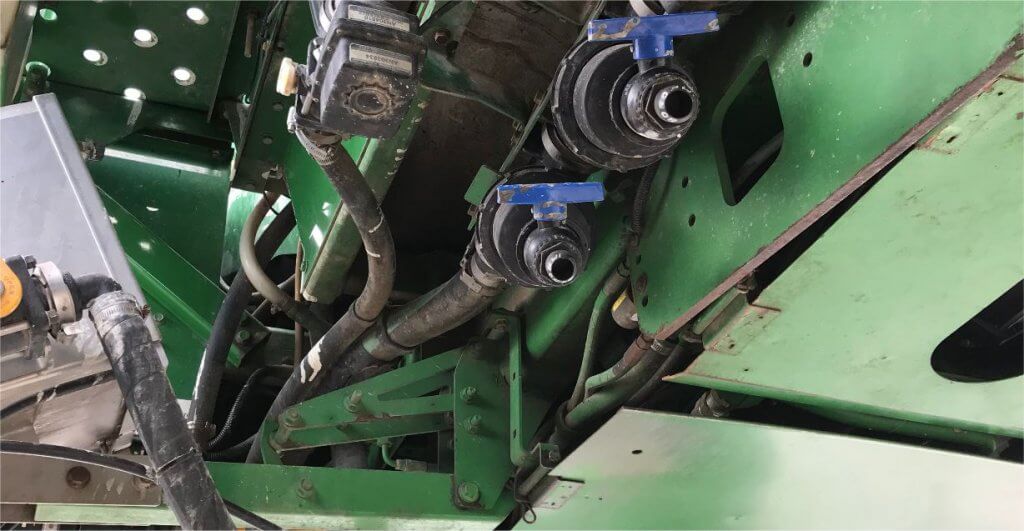
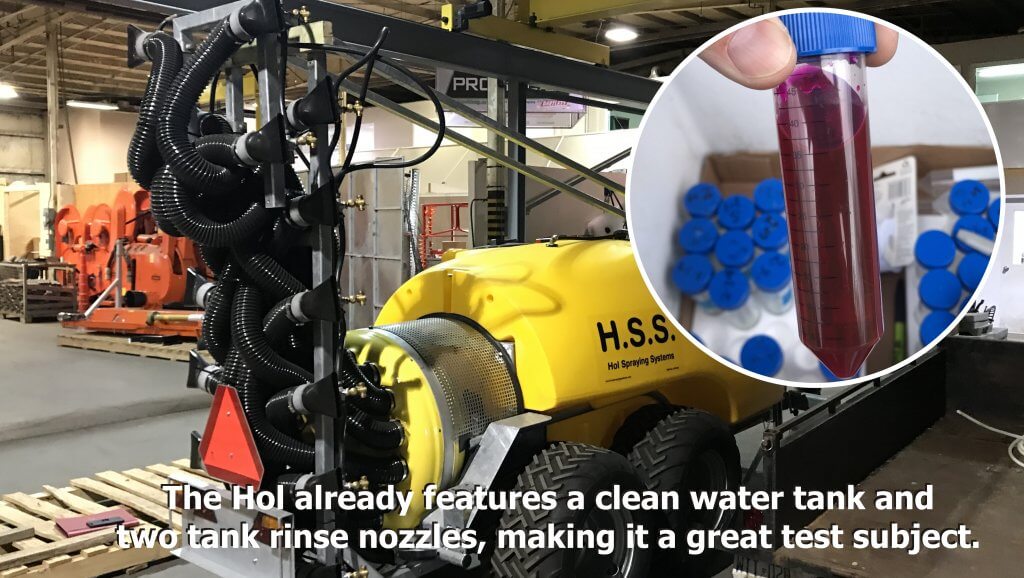
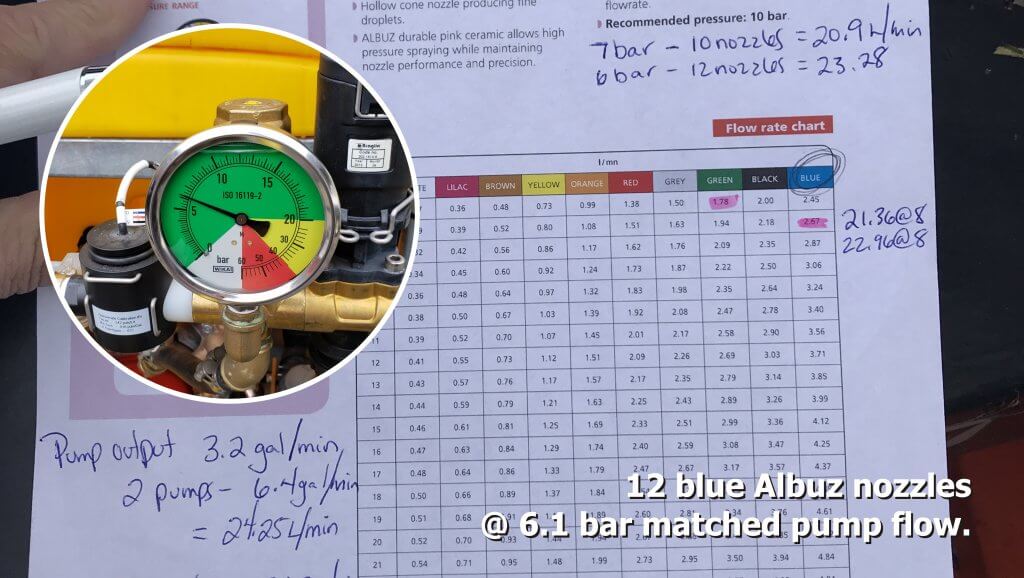
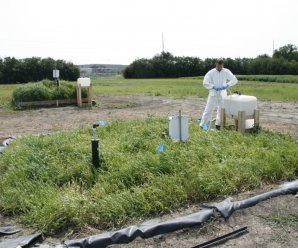
    Figure 1: Sprayer fill station

    At Sprayers101.com, we’ve tried to tackle the problem by finding ways to generate less waste (Express End Caps, Accu-Volume), by disposing of the rinsate by spraying it out, or by installing an efficient continuous rinsing system. We’d now like to talk about another component, biobeds.

    What is a biobed?

    Simply put, a biobed is a place where it’s safe and acceptable to dump dilute pesticide waste. First implemented in Sweden about 20 years ago, a biobed typically consists of a 1-m deep pit measuring about 3 m x 6 m or so. The pit is filled with a biomix, a mixture of cereal straw, compost or peat, and soil. The biomix, when properly prepared, acts to absorb a large amount of moisture, adsorb the pesticide molecules, and provide an environment in which microbes break down the residues.

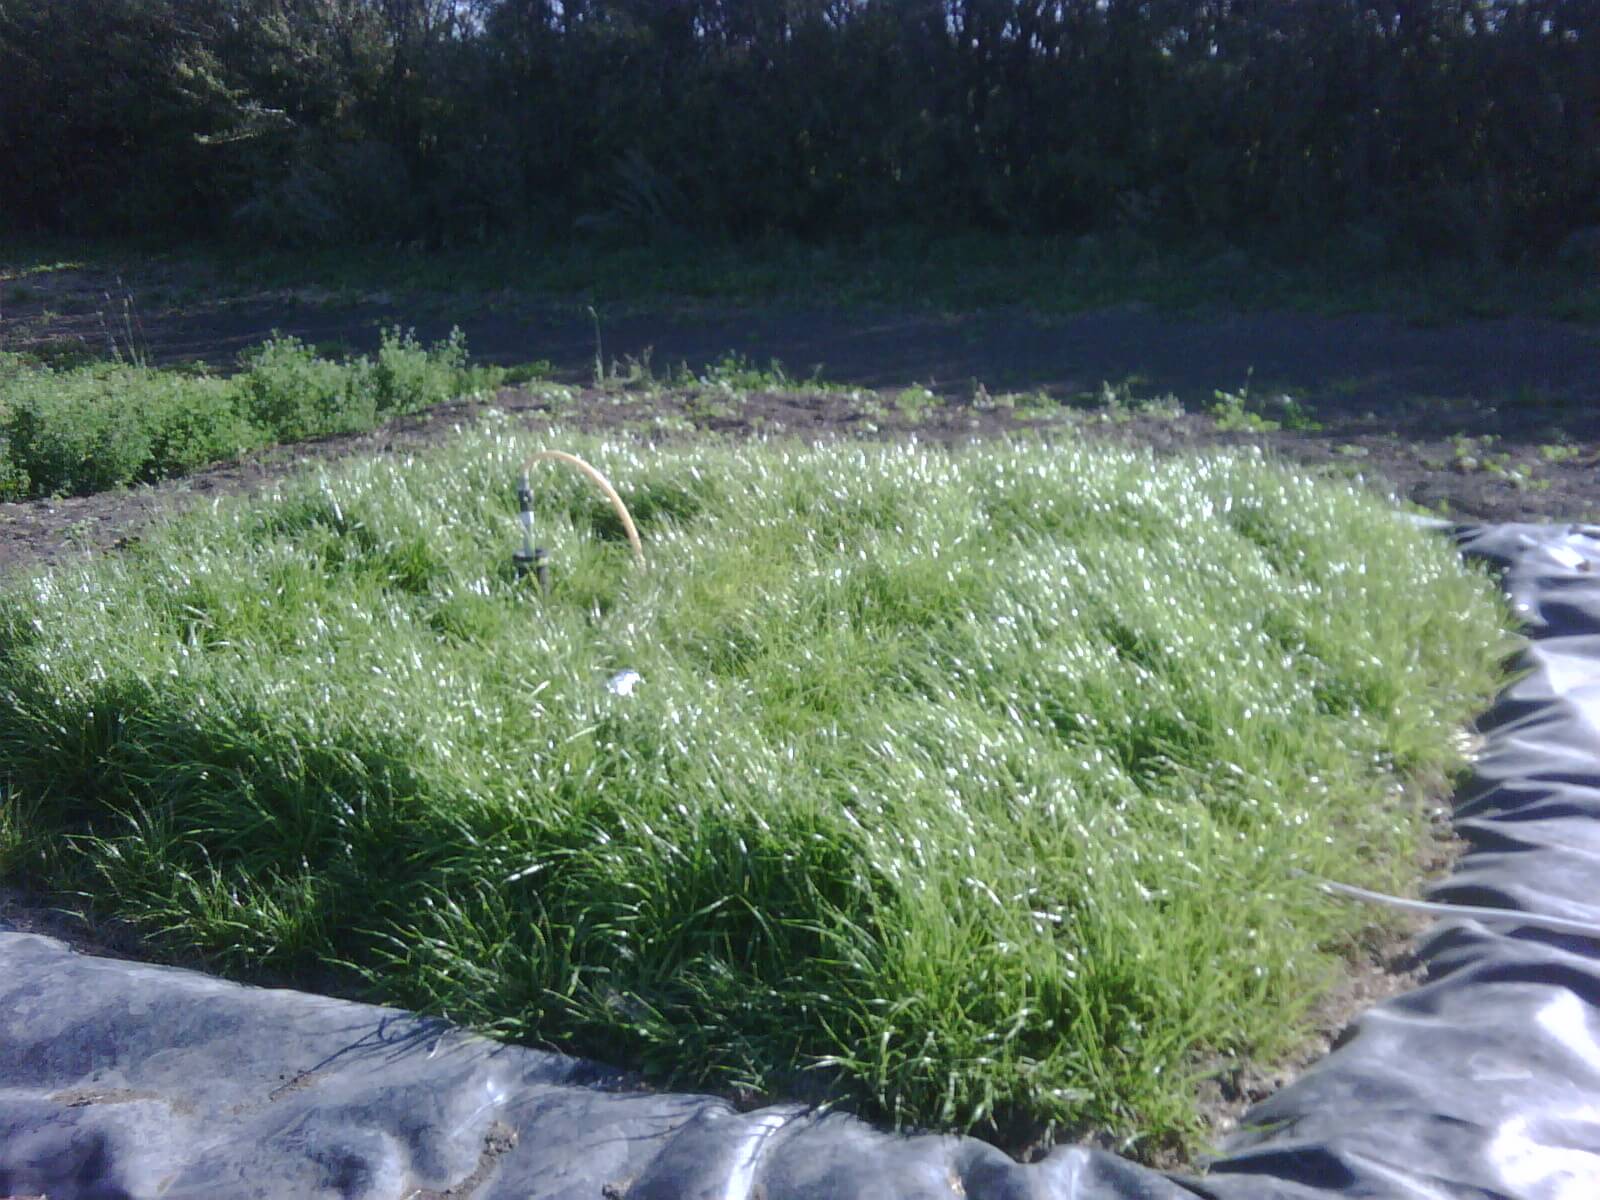
    Figure 2: Canada’s first commercial biobed installation at Indian Head, SK, 2009 (Source: Murray Belyk, Bayer CropScience (retired)).

    The effluent from a properly constructed biobed system contains 90 to 99% less pesticide than what was introduced, depending on the pesticide.

    Biobeds have been extensively studied and are now found throughout Europe and many parts of Central and South America. Canada currently has 6 research biobed sites in the West, and a further 17 in Quebec. The systems have been researched by Agriculture & Agri-Food Canada (AAFC) in recent years, with promising results.

    Figure 3: European biobed installations, 2016 (Source: Jens Husby, Biobeds.org).

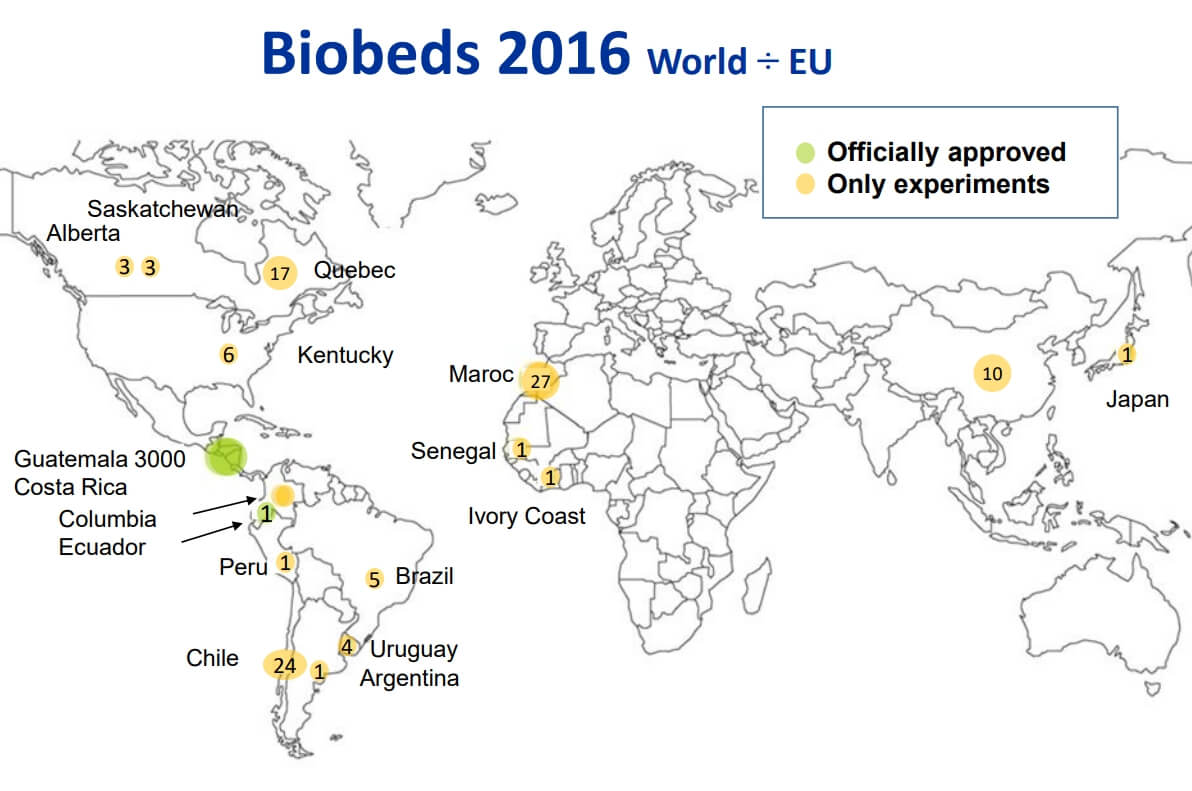
    Figure 4: Global biobed installations, 2016 (Source: Jens Husby, Biobeds.org).

    Constructing a biobed

    There are many possible variations of biobeds, some relatively simple and others engineered to address certain specific needs. A great deal of creativity can be used to customize a biobed for any operation.

    A simple biobed

    The following is a variation of the simplest biobeds, and these are the types first tested by AAFC in Saskatoon and Indian Head, Saskatchewan about 10 years ago. This design is based on the biobeds established in Sweden and the UK, and is a good way to learn about the system.

    Note that this biobed has an impermeable liner, so it’s a closed system. Excess water that leaches to the bottom must be removed and cycled back to the top of the biobed.

    • Create the biomix by blending two parts, by volume, chopped cereal straw or wood chips (not cedar), one part mature plant-sourced compost or peat and one part relatively coarse-textured soil (for optimal drainage). Add water as necessary as if making compost. Allow to sit for four to six weeks.

    Figure 5: Biomix preparation.

    • During this waiting time, the biomix will warm and form a white-mold complex. This is the microbial basis for its ability to break down pesticide residues. White mold will be visible on the cellulose portions of the biomix.

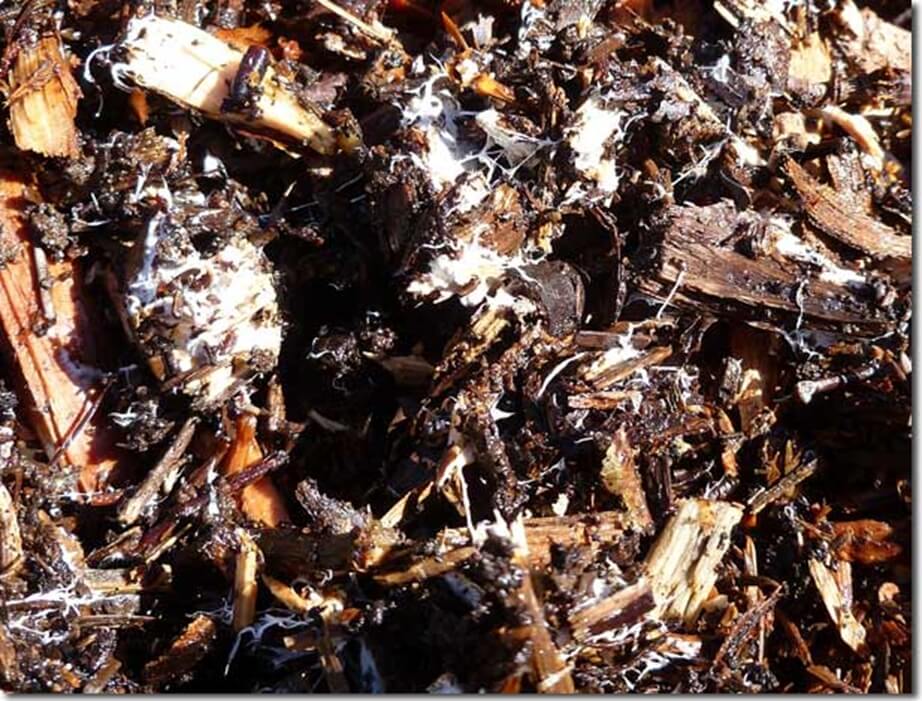
    Figure 6: white mold (Source: AAFC).

    • Identify a well-drained site easily accessible by spray equipment. Avoid low spots as water management becomes problematic.

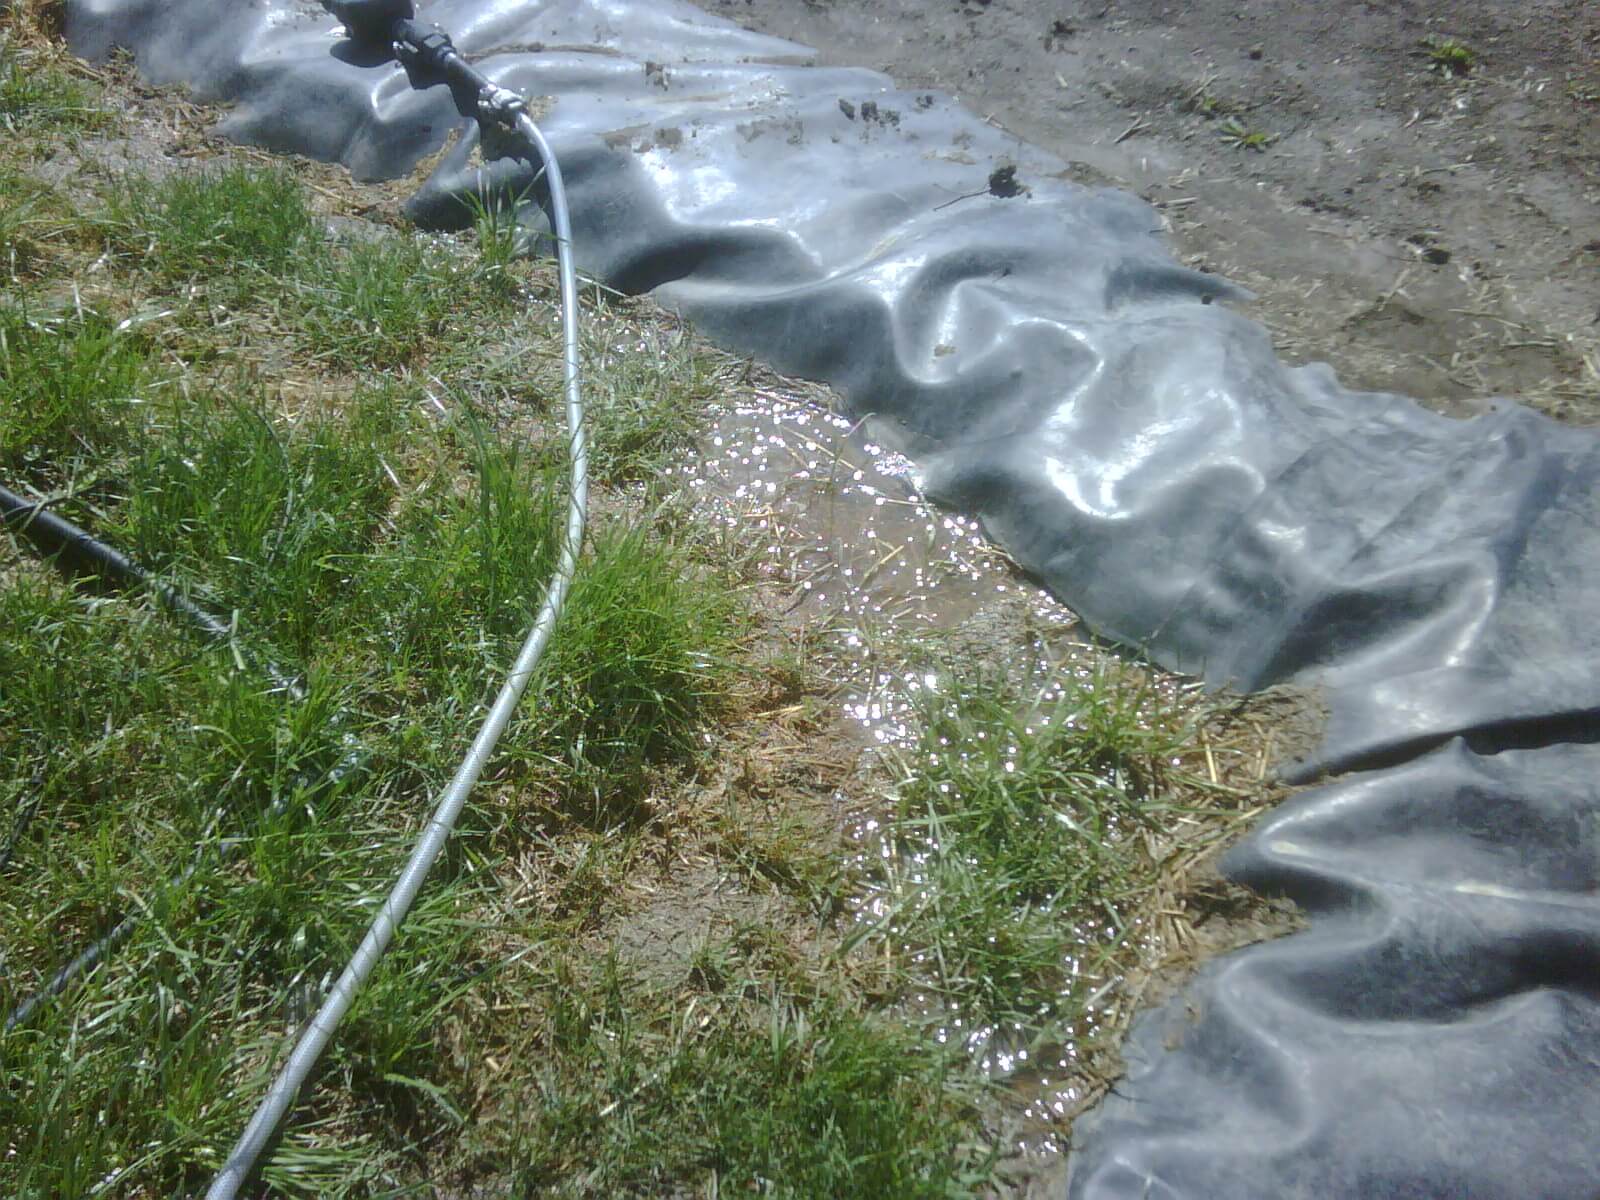
    Figure 7: Site selection and/or biobed covering are essential to avoid waterlogging (Source: Murray Belyk, Bayer CropScience (retired)).

    • Dig a pit sized to suit your requirements. As a rule of thumb, 1 m3 can process about 1000 L of liquid in a season. Rainfall is included in this amount.

    Figure 8: A nice looking pit.

    • Line the pit with a geomembrane liner. 40 mil is plenty thick; any thicker and it gets hard to handle. Include a raised berm at the edge.

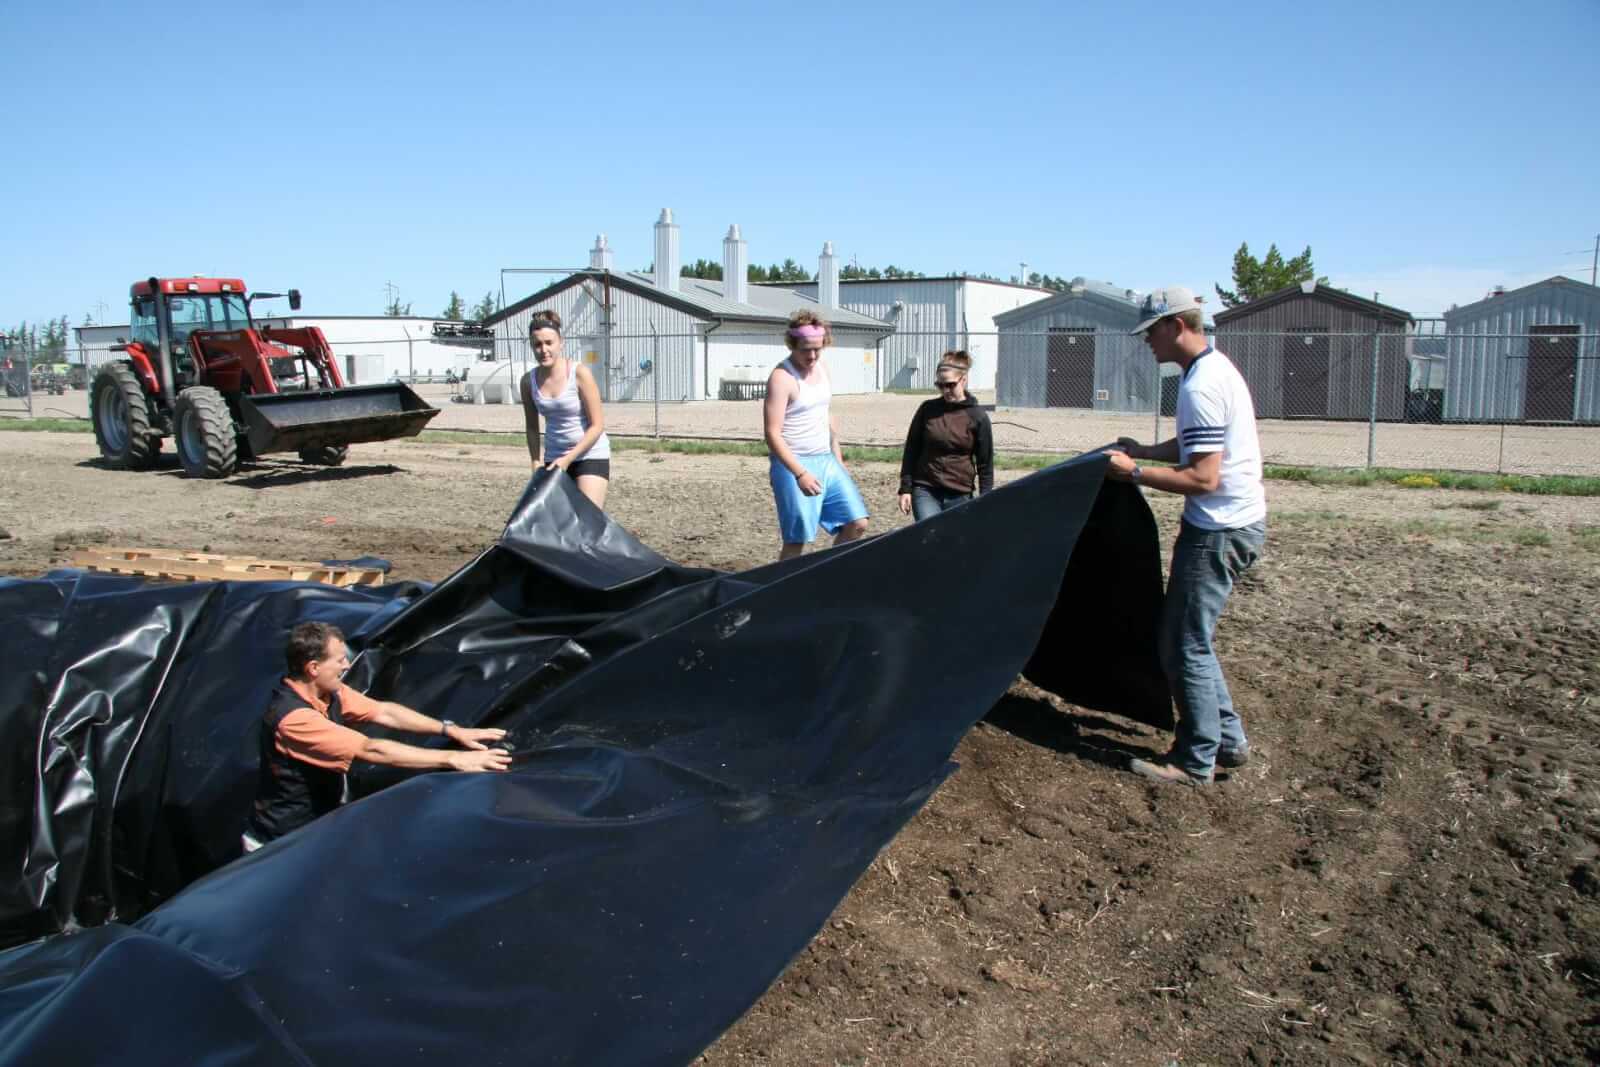
    Figure 9: Liner creates a closed system that will require a way to remove leached water.

    • Install weeping tile at bottom of pit, and extend it to ground level. This will be useful to determine water status and remove water if necessary.

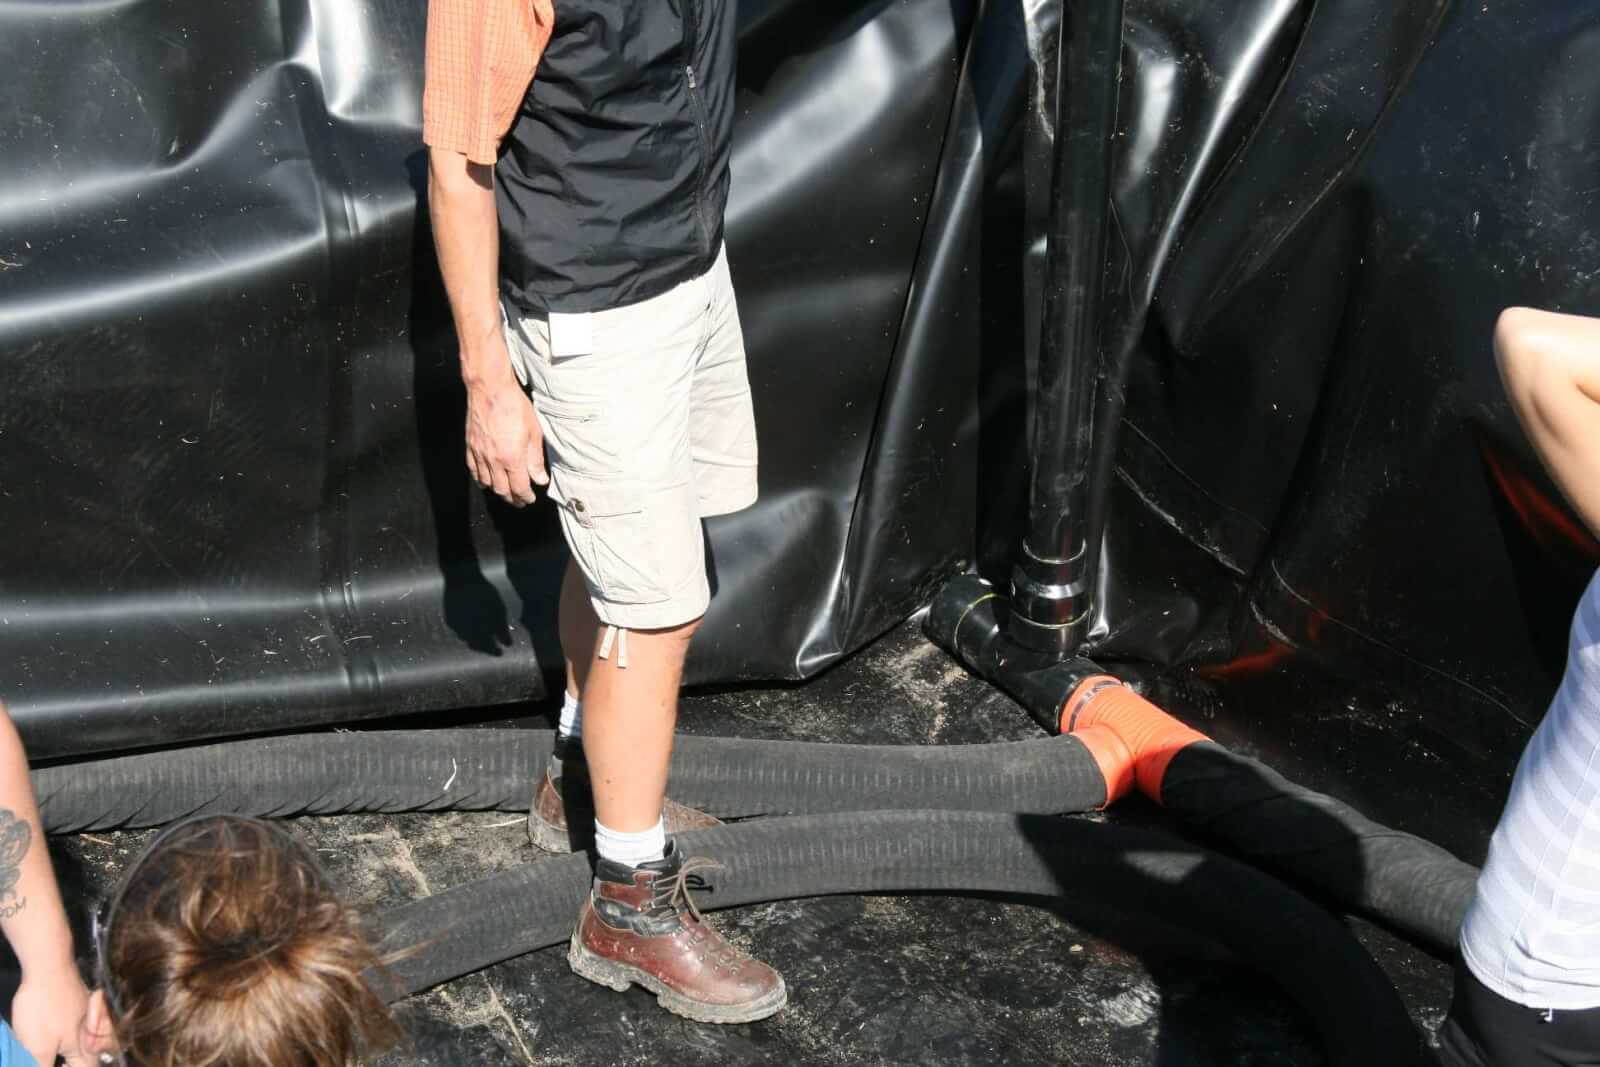
    Figure 10: Weeping tile to collect excess water.

    • Cover weeping tile with pea gravel and a silt trap. This serves to make leached water freely available for removal.

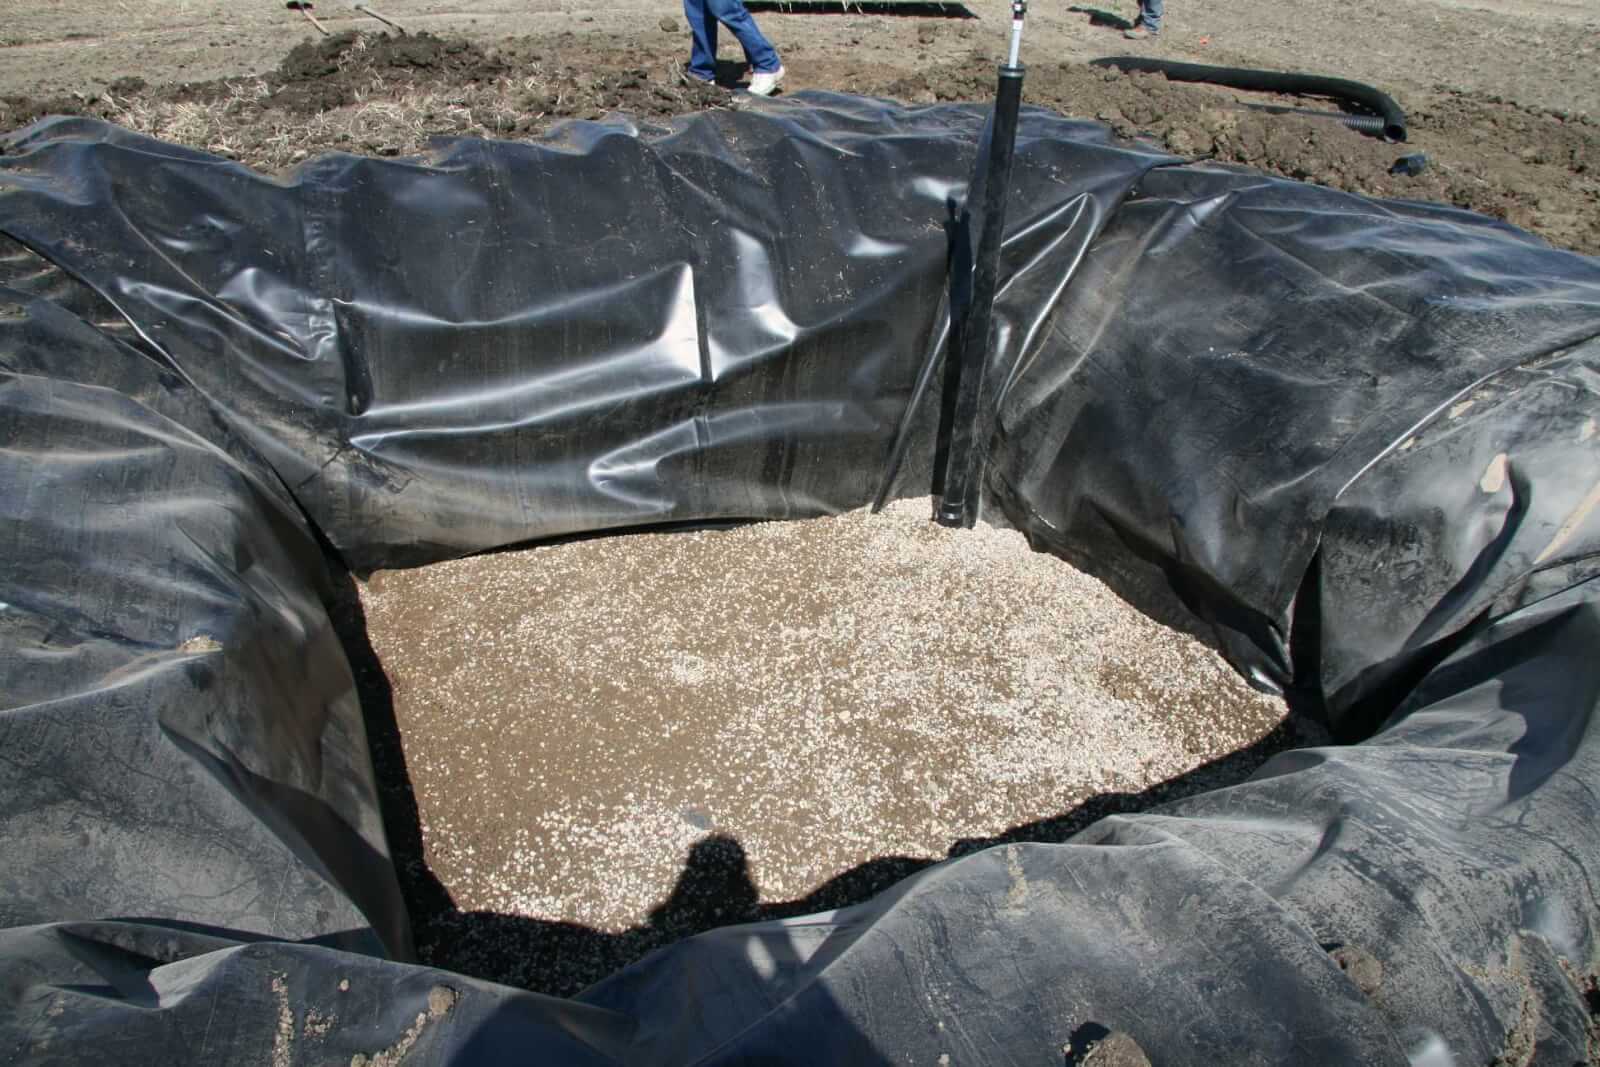
    Figure 11: Pea gravel over weeping tile.

    • Fill pit with biomix, anticipating significant settling. Top up as necessary over next few weeks. Use extra biomix to create a slope away from berm.

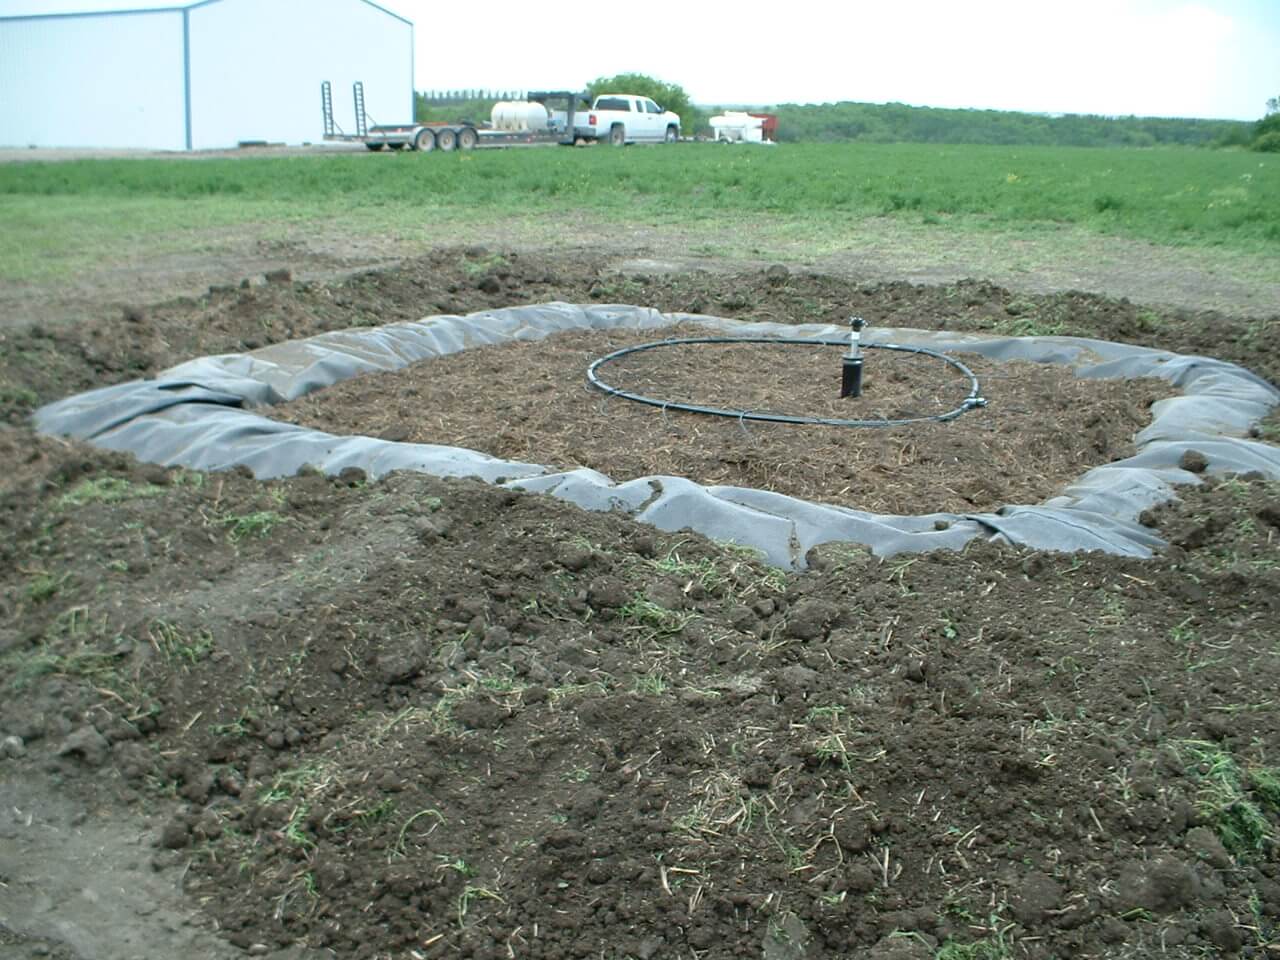
    Figure 12: Filled biobed.

    • Establish a bromegrass cover by transplanting or sodding. This is an important way to remove excess water via evapotranspiration.

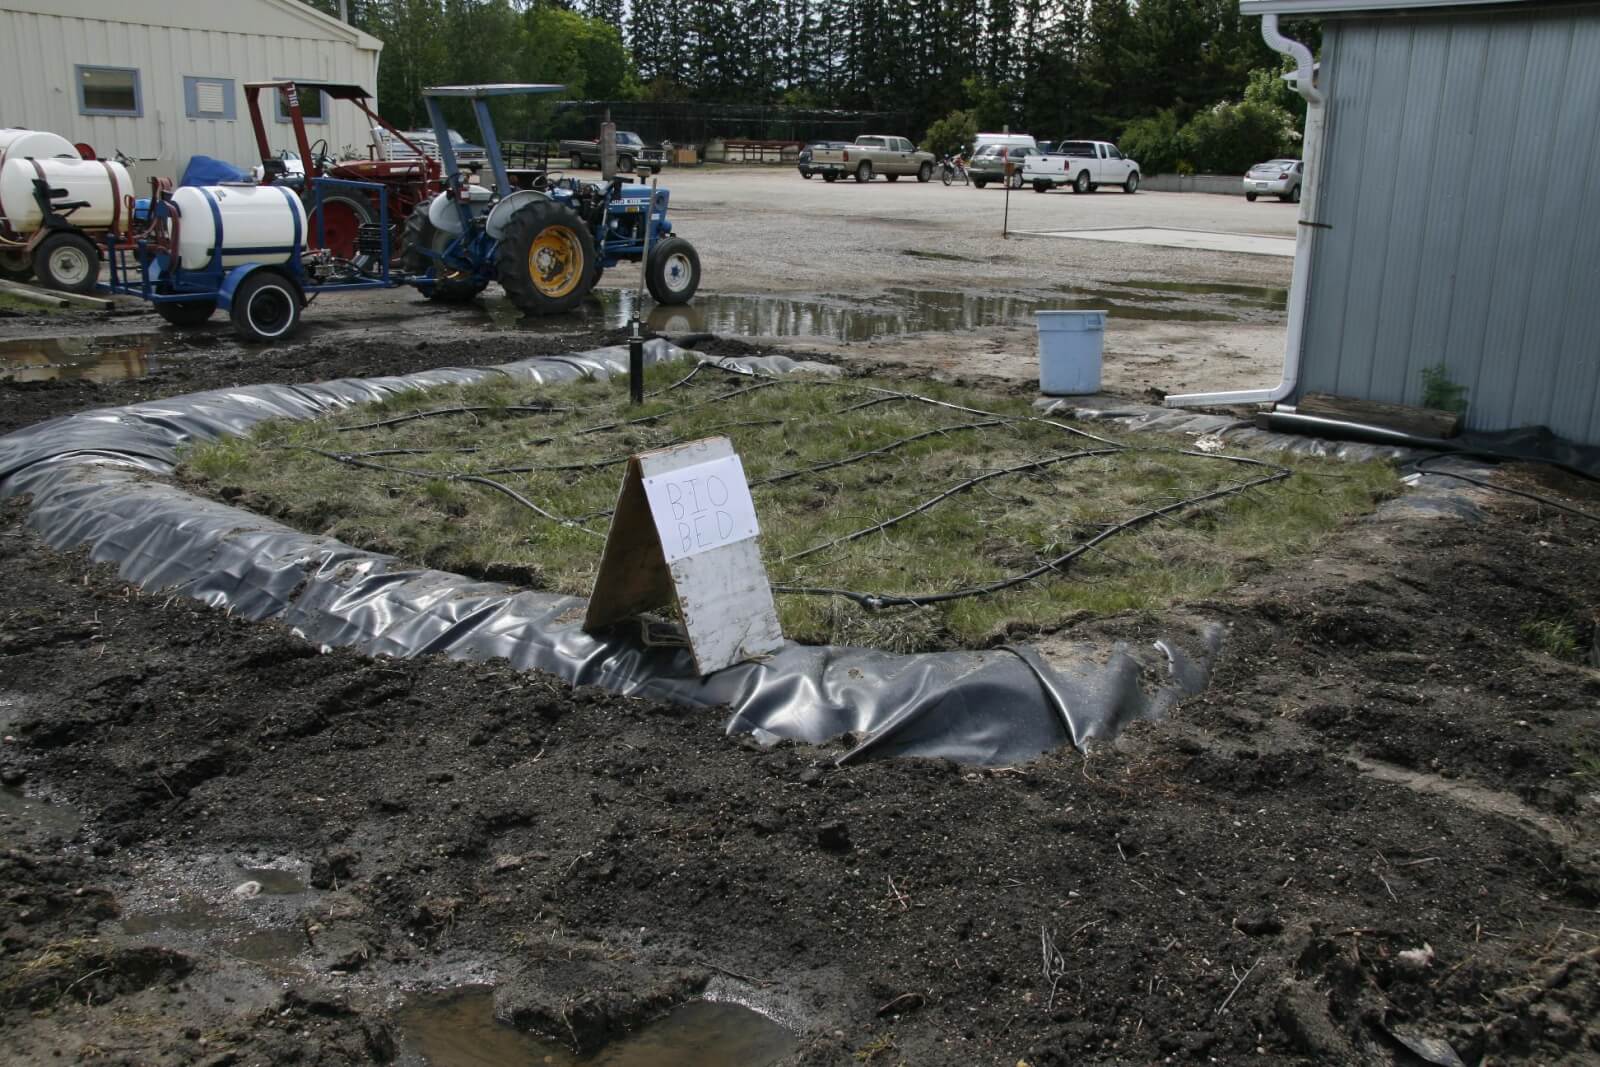
    Figure 13: Early sod growth on biobed at Indian Head, SK.

    • Introduce pesticide waste to biobed, managing moisture content to avoid waterlogging.

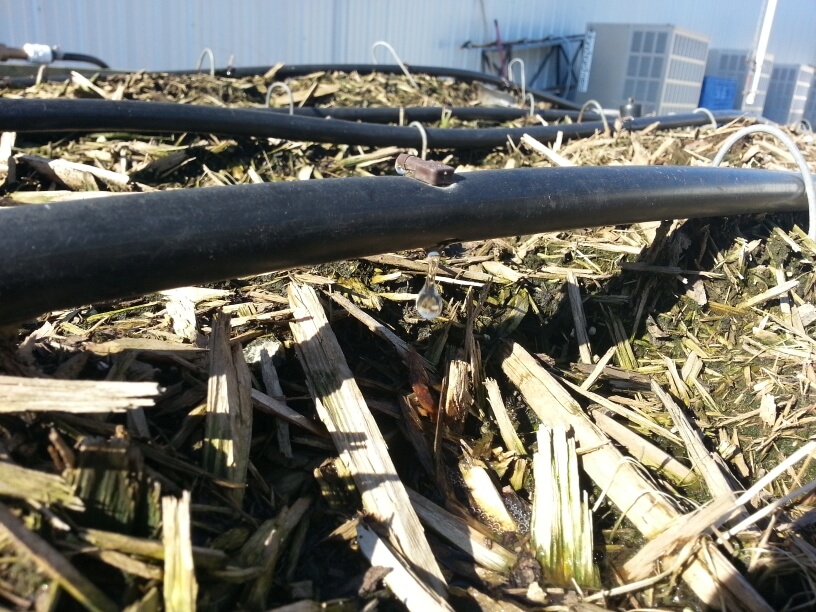
    Figure 14:  Pesticide waste entering biobed via drip irrigation.

    Introduction of pesticide waste to the biobed

    Moving pesticide waste from the sprayer to the biobed should be easy and trouble free. A simple pad built beside biobeds, either sealed with concrete or asphalt, or with a hardy geomembrane liner, works well. The sprayer is cleaned on this pad and rinsate flows into a drain. A sump pump lifts the rinsate to a storage tank from which it is introduced via gravity or pumped drip irrigation.

    Figure 15: Biobed system in Simpson, SK. Rinsate from sprayer is collected in a sump, which is pumped to the black storage tank in background. Rinsate is introduced into biobed (blue tub) as needed (Brian Caldwell in foreground, left, Larry Braul, right).

    When not in use, the sump drains freely to dispose of rain water.

    Others choose to pump or dump rinsate directly into a holding tank, from where it can be pumped onto the biobed.

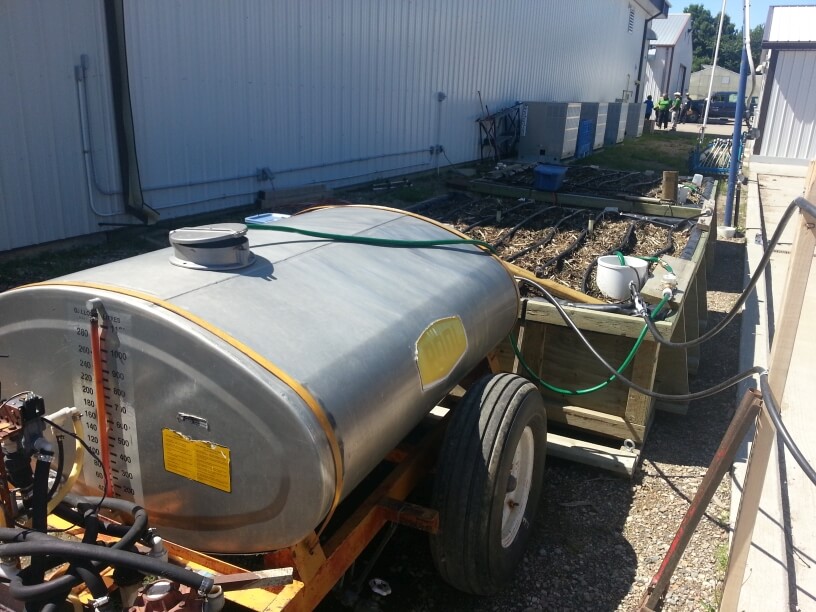
    Figure 16: Holding tank at biobed in Outlook, SK.

    Some European systems include driving supports on the biobed so the sprayer can be parked directly over top.

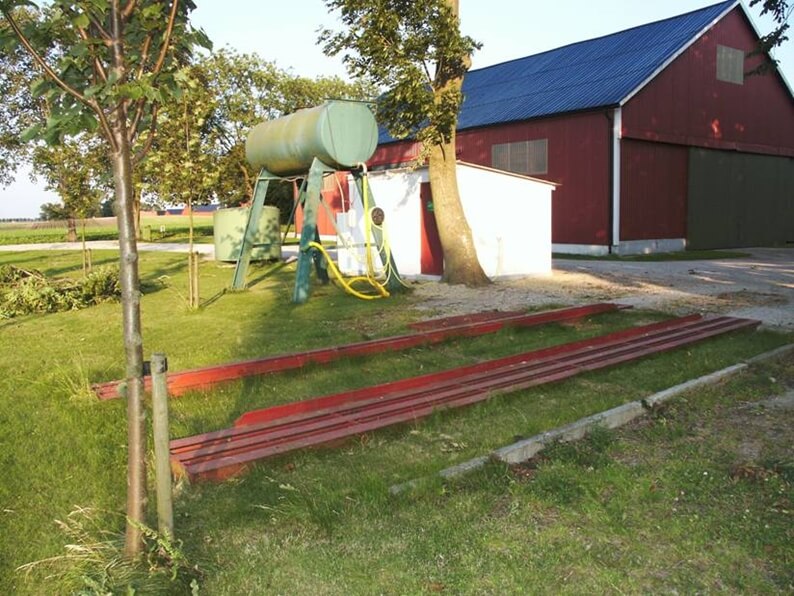
    Figure 17: Steel beams can allow (light) sprayer access (Source: Eskil Nilsson via Biobeds.org).

    A two-stage biobed

    The same basic building principles apply as in the original simple biobed. However, instead of reintroducing the effluent to the top of the biomix as it collects on the bottom, it is instead pumped onto a second biobed. This biobed then degrades any remaining product. This system is more efficient at degrading persistent products, and allows for better water management.

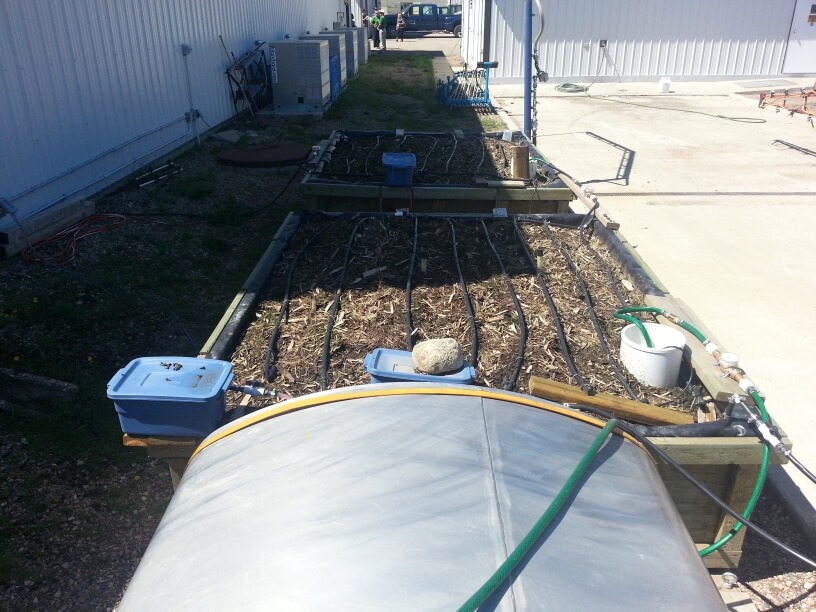
    Figure 18: Two-stage biobed system at Outlook, SK.

    The principle has proven effective, helping degrade more difficult pesticides to acceptable levels.

    Above-ground biobeds

    One of the problems with below-ground biobeds in wet climates is the difficulty managing water. Above-ground biobeds can address this issue by eliminating the possibility of surface runoff being added to the biomix. Adding a rain cover would also be easier and more effective.

    Above-ground biobeds can be edged with plywood, or placed entirely into plastic tanks whose tops have been removed.

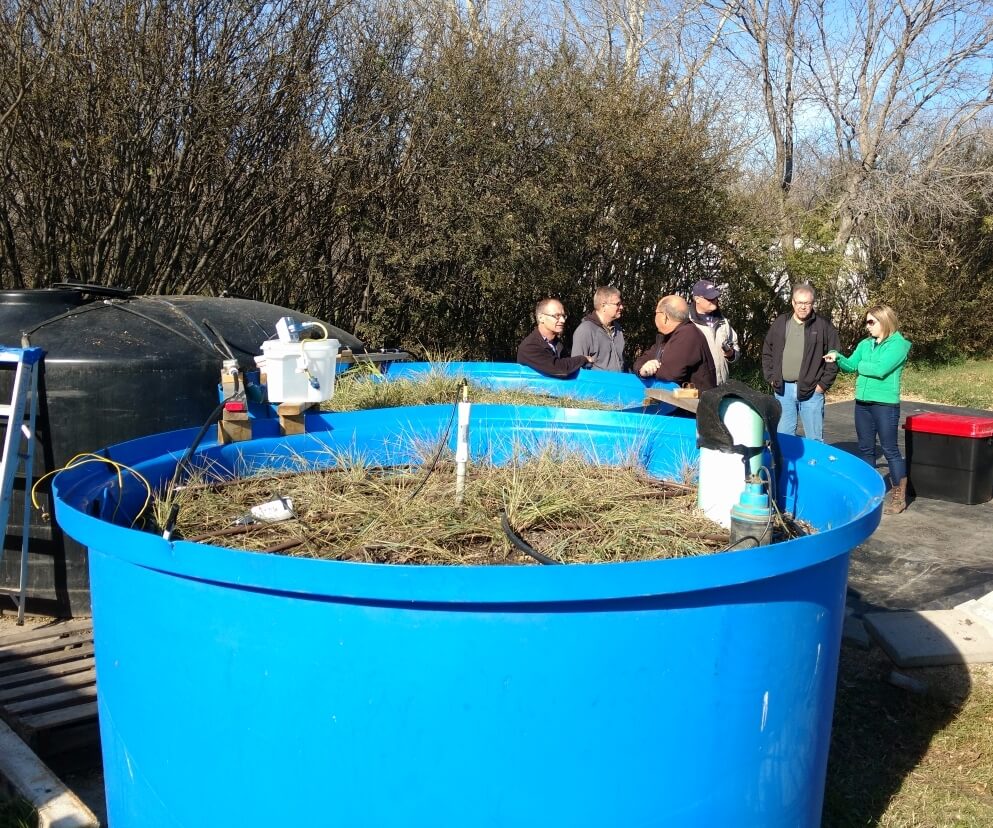
    Figure 19: Above ground biobed installation with plastic tub.

    One potential problem with above-ground biobeds is the later spring warming of this installation compared to below-ground types. Cold temperature reduces the effectiveness of biobeds due to the reliance on microbial activity. Heat tape has been tested by AAFC and shown to be very effective at warming the biomix and stimulating initial microbial activity. Passive solar systems have also been studied but are more difficult to install.

    Figure 20: Heat tape (Source: AAFC).

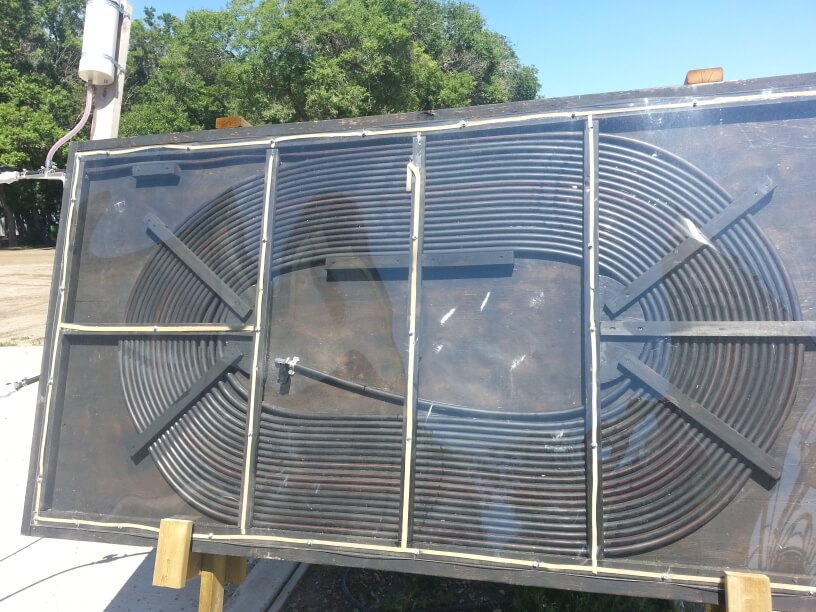
    Figure 21: Passive solar biomix heating system.

    Phytobac and Biofilters

    European designs have utilized plastic containers to form of various designs, including the commercial “Phytobac” systems from France and developed with the support of Bayer CropScience.

    Sequential biofilters have also been implemented. The leachate simply migrates through the biomix into the next container below. Eventually, adjacent biofilters containing plants act to remove the moisture.

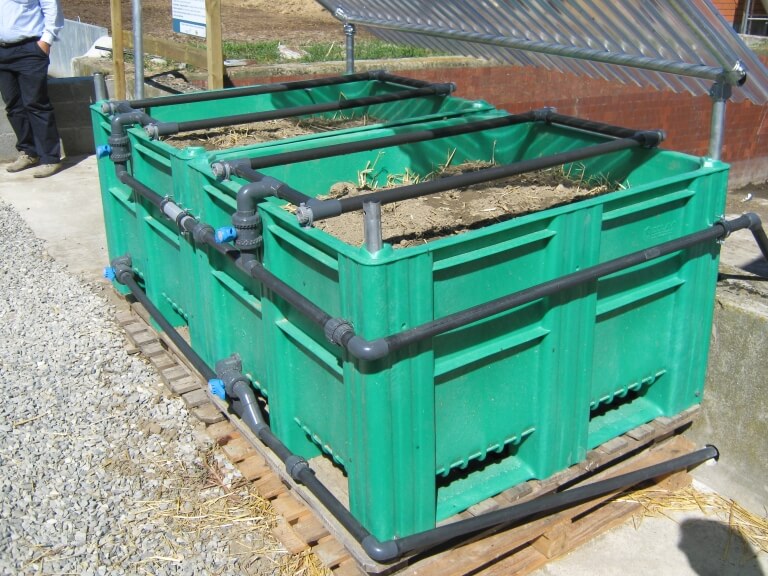
    Figure 22: Phytobac installation, cross-section.

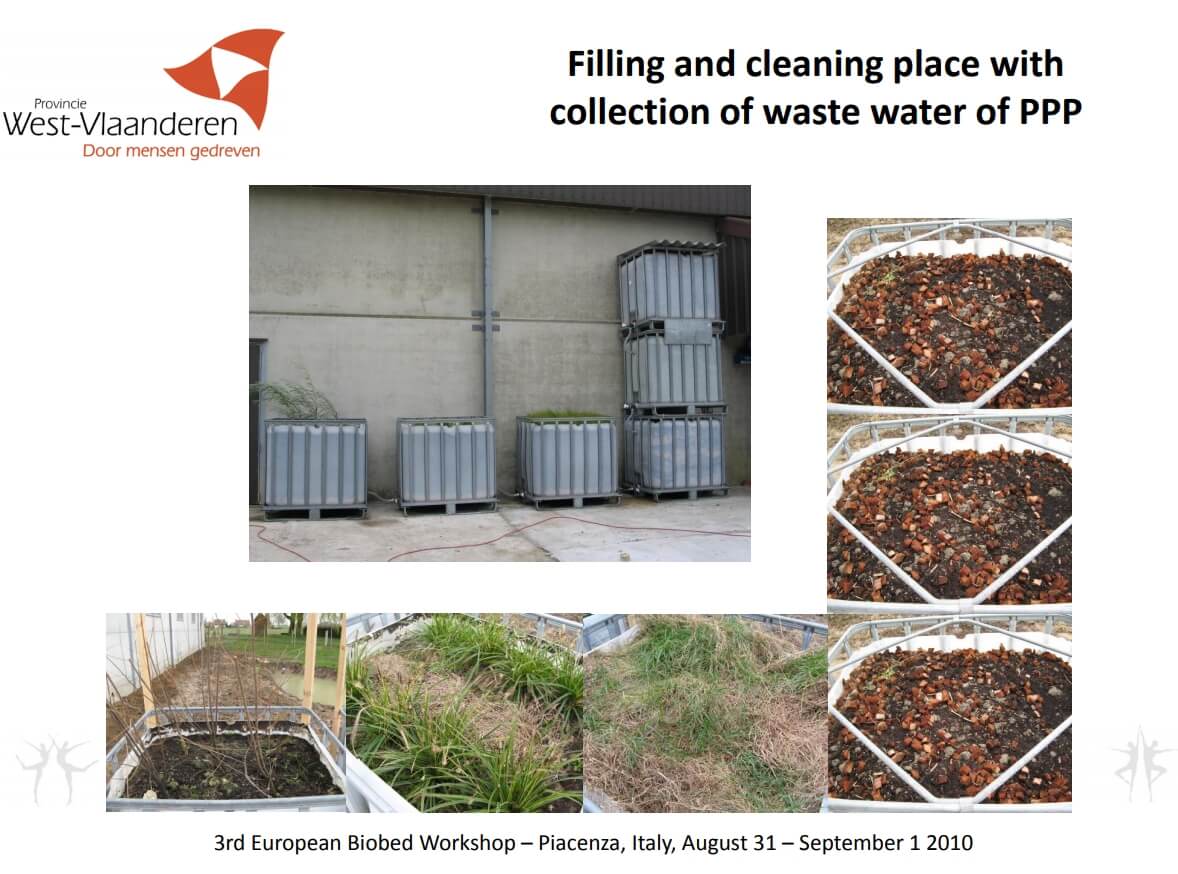
    Figure 23: Biofilter installation in Belgium (Source: Inge Mestdagh via Biobeds.org).

    Biomix longevity

    Swedish and UK research has suggested that biobeds require minimal maintenance aside from water management in closed systems. Biomix will settle over time and may need to be topped up. After five to eight years of use, it has been recommended to remove biomix and distribute it over a field with a manure spreader.

    Canadian research results

    Extensive analysis of pesticide degradation in five biobeds across Western Canada was conducted as part of a three-year study led by AAFC. Between eight and 51 products were analyzed per site, including herbicides, fungicides, and insecticides. Their results showed that single biobeds could remove about 90% of the introduced pesticide, and two in sequence usually removed more than 98%.

    Pesticides that tended not to degrade rapidly were removed to a greater degree in the second biobed.

    In the AAFC studies, three herbicides were more difficult to remove in the tested biobeds: clopyralid (e.g., Lontrel, Stinger), bentazon (Basagran, Storm) and imazethapyr (Pursuit, Arsenal). For these three, roughly 60% was removed in a two-biobed system.

    Concentrated pesticides should not be introduced to a biobed as this will kill the microbial populations.

    Some fungicides were shown to depress microbial populations but only temporarily. Microbial breakdown still occurred.

    Biobed manual

    AAFC has authored a comprehensive manual on biobed operation and installation based on research experience in Canada and elsewhere. It will be available here in late June 2018.

    The future of biobeds

    Research into biobeds remains active around the world. Different substrates for the biomix are being studied to suit local availabilities. Various systems, ranging from simple to highly engineered are being studied. Degradation effectiveness for various influents remains a topic of significant interest. Producer adoption and implementation are being reported.

    Thanks to funded research projects, biobeds are up and working at Canadian institutional sites such as government research centres, and there are opportunities for county and municipal government sites. For biobeds to be a viable option on North American farms, their design needs to remain simple and their integration into established practices needs to be seamless. Producer experience and feedback are essential

    Learn more

    Valuable information on biobeds can be obtained from these two websites:

    Voluntary Initiative (UK industry)

    Biobeds.org (International research)

    Note: Brian Caldwell and I first learned about biobeds from Eskil Nilsson (website) during a visit to Sweden in 2001, and obtained support for initial studies in Saskatoon and Indian Head from the Pest Management Centre as well as Bayer CropScience. Brian took a lead in our creative and technical efforts over many years. Dean Ngombe, under the co-supervision of Diane Knight at the U of S and myself, produced the first M.Sc. thesis, and with significant input from Allan Cessna, the first scientific publications in Canada on biobeds. Thanks for Larry Braul and many collaborators for leading the most recent AAFC study and generously sharing resources, and Erl Svendsen, Bruce Gossen, and Claudia Sheedy for editorial input.

  • Diluting 20,000-Fold with a 30 Gallon Remaining Volume in a 1,200 Gallon Tank

    Diluting 20,000-Fold with a 30 Gallon Remaining Volume in a 1,200 Gallon Tank

    (This short article is an addendum to this article)

    Our goal in this example is to dilute by a factor of 20,000.

    The maximum amount of dilution possible with a 1,200 gallon tank and a 30 gallon remainder is 1200/30=40.

    The formulae:

    Dilution per Rinse = final dilution ^(1/# of rinses)

    Rinse Volume = (dilution per rinse * remaining volume) – remaining volume

    • One rinse diluting by 20,000 – impossible with a 1,200 gallon tank (max achievable is 40-fold);
    • Two sequential rinses, each diluting by a factor of 20,000^(1/2) = 141. Also impossible with a 1,200 gallon tank;
    • Three sequential rinses, each diluting by a factor of 20,000^(1/3) = 27. A volume of 780 gallons can do this  (27*30)-30=780 gallons. For three rinses, the total volume is 2,340 gallons.
    • Four sequential rinses, each diluting by a factor of 20,000^(1/4) = 12. A volume of 330 gallons can do this, for a total volume of 1,320 gallons;
    • Five sequential rinses, each diluting by a factor of 20,000^(1/5) = 7. A volume of 180 gallons can do this, for a total volume of 900 gallons;
    • Six sequential rinses, each diluting by a factor of 20,000^(1/6) = 5.2. A volume of 126 gallons can do this, for a total volume of 757 gallons.

    Second, let’s assume the operator is prepared to prime the boom where it doesn’t harm soybeans. Now the first new product tank takes care of the last dilution, lowering the cleanout dilution requirement by 1,200/30 = a factor of 40. Now the cleanout dilution requirement is only 20,000/40 = 500.

    • One 1,200 gallon tank rinse can only achieve 40-fold dilution.
    • Two rinses, each diluting by 500^(1/2) = 22. Rinse volumes of 640 gallons are sufficient, for a total of 1,280 gallons.
    • Three sequential rinses, each diluting by a factor of 500^(1/3) = 7.9. A volume of 210 gallons can do this, for a total volume of 630 gallons;
    • Four sequential rinses, each diluting by a factor of 500^(1/4) = 4.7. A volume of 112 gallons can do this, for a total volume of 448 gallons.
  • How Clean is Clean?

    How Clean is Clean?

    One of the more perplexing questions in tank cleanout is knowing when the cleaning process is good enough to prevent harm. This question is especially relevant to producers that grow canola and use Group 2 herbicide products, or grow soybeans and use dicamba on some of their area. In both of these examples, crops can be extremely sensitive to very small residues.

    When does an applicator know that the cleaning job was good enough? In about two weeks! There is no easy way to tell, except to be precautionary.

    A bit of math can help put us in the ballpark. First, we need to know the tolerance of a crop to the herbicide, preferably expressed as a proportion of the tank mix to be cleaned. Let’s use dicamba as an example. It’s been reported that non-dicamba tolerant soybeans can show leaf-cupping symptoms from dicamba at rates as low as 1/20,000 of the label rate.

    Recall that sprayer cleanout is really two separate processes that we’ve written about here, here, and here. The first is dilution of the remaining volume in the system. The second is decontaminating specific sprayer components (filters, boom ends, hoses). We’ll focus on dilution in this article.

    If you’re diluting, the second piece of information you need is how much liquid is left in the sprayer when you start cleaning. All sprayers have a certain amount of liquid left in the tank and associated plumbing after the tank is empty. The sump, the suction line feeding the pump, and the lines returning to the tank via agitation or sparge are most common. Even when the pump no longer draws liquid, those lines retain some volume of product. This volume can’t be pushed out to the boom, most of it goes back to the tank.

    The volume of this “remaining liquid” is likely somewhere between three and thirty US gallons.

    The remainder volume depends on the sprayer, and also how the tank is emptied. Some applicators simply spray until the solution pump pressure drops, others choose to drain the remaining liquid from a sump valve. When draining, product should be captured in pails rather than allowing it on the ground where it will harm the soil and possibly make its way into runoff.

    It’s always preferable to spray the tank empty in a field.

    As we’ll see below, a low remaining volume greatly improves the efficiency of the dilution process. It’s a sprayer feature that should be considered at purchase.

    The table below has some sample calculations. Note that the paired cases (1&2, 3&4, 6&7) all use the same total water volume, but compare a single vs triple rinse of three different remaining volumes.

    Comparing Case 1 to Case 3 or Case 6, (remaining volumes of 10, 20, and 50, respectively), it’s clear that minimizing the remaining volume is important.

    It’s also striking that the same amount of clean water, subdivided into three smaller repeat batches (Case 2, 4 and 7), is much more powerful than using single batches with the same total clean water amounts.

    Reducing the size of each batch even further and increasing the number of batches (Case 5) approaches what a properly executed continuous rinse can do.

    Is it necessary to dilute to the level that’s safe for the next crop? Not always. The next product in the tank acts to dilute the remainder once again, possibly by a factor of 100, depending on the remaining volume and the tank size (Case 8). The material in the boom, however, won’t be diluted by this additional volume, and therefore may harm the crop unless it is first sprayed out elsewhere, especially when section ends are not drained and rinsed.

    This is where a recirculating boom is valuable, providing an opportunity to charge the boom without spraying. The penalty is that the boom volume is then returned to the tank in the process, increasing the amount that needs to be diluted.

    Let’s return to the dicamba example with a 20,000-fold dilution requirement and a 1,200 gallon tank. We’ll consider two examples. In the first, the operator wants to prime the boom in the soybean field without any harm to the dicamba-susceptible beans. A 20,000-fold dilution is needed.

    We’ve looked at five options that each assume a remaining volume of 10 gallons. Note that our goal is the same – dilute by a factor of 20,000.

    The formulae:

    Dilution per Rinse = final dilution ^(1/# of rinses)

    Rinse Volume = (dilution per rinse * remaining volume) – remaining volume

    The maximum amount of dilution possible with a 1,200 gallon tank and a 10 gallon remainder is 120 (see Row 8, Table above).

    • One rinse diluting by 20,000 – impossible with a 1,200 gallon tank (max achievable is 120-fold);
    • Two sequential rinses each diluting by a factor of 20,000^(1/2) = 141. Also impossible with a 1,200 gallon tank;
    • Three sequential rinses, each diluting by a factor of 20,000^(1/3) = 27. A volume of 260 gallons can do this  (27*10)-10=260 gallons. For three rinses, the total volume is 780 gallons.
    • Four sequential rinses, each diluting by a factor of 20,000^(1/4) = 12. A volume of 110 gallons can do this, for a total volume of 440 gallons;
    • Five sequential rinses, each diluting by a factor of 20,000^(1/5) = 7. A volume of 60 gallons can do this, for a total volume of 300 gallons.

    The first two examples don’t work because the tank isn’t big enough. But the three remaining examples all work equally well, they just consume different amounts of clean water.

    If that doesn’t seem like a lot of work, then repeat this calculation with a 30 gallon remainder volume, common on many sprayers. Short on time? We did it for you here.

    Second, let’s assume the operator is prepared to prime the boom where it doesn’t harm soybeans. Now the first new product tank takes care of the last dilution, lowering the cleanout dilution requirement by 1,200/10 = a factor of 120. Now the cleanout dilution requirement is only 20,000/120 = 166.

    • One 1,200 gallon tank rinse can only achieve 120-fold dilution.
    • Two rinses, each diluting by 166^(1/2) = 13. Rinse volumes of 120 gallons are sufficient, for a total of 240 gallons.
    • Three sequential rinses, each diluting by a factor of 166^(1/3) = 6. A volume of 50 gallons can do this, for a total volume of 150 gallons.

    The math is simple, and can be done using the formula in the first table, or this app:

    The hard part is knowing what the remaining volume is. It would be very useful for a manufacturer to provide this information.

    In the meantime, you can estimate on your own. Add water with surfactant to your tank, and spray it empty. While spraying, turn the agitation on and off to fill and activate the sparge, if equipped. Once the tank is empty and the spray pressure drops, stop and drain the sump into pails. Ensure that the pump suction line and the pressure line up to and including the agitation and sparge lines also drain. Disconnect these if necessary. If there is a filter housing in this circuit, remove it as well.  Avoid collecting liquid from the pressure line beyond where the the agitation or sparge split off, as this will be pushed out to the boom.

    An alternative is to estimate the length of hose in this circuit, using the following table as a guide:

    And remember, diluting the remaining liquid is only one part of a cleaning process.