This work was performed with Albert Tenuta (OMAFRA) and David C. Hooker (University of Guelph, Ridgetown).
Objective
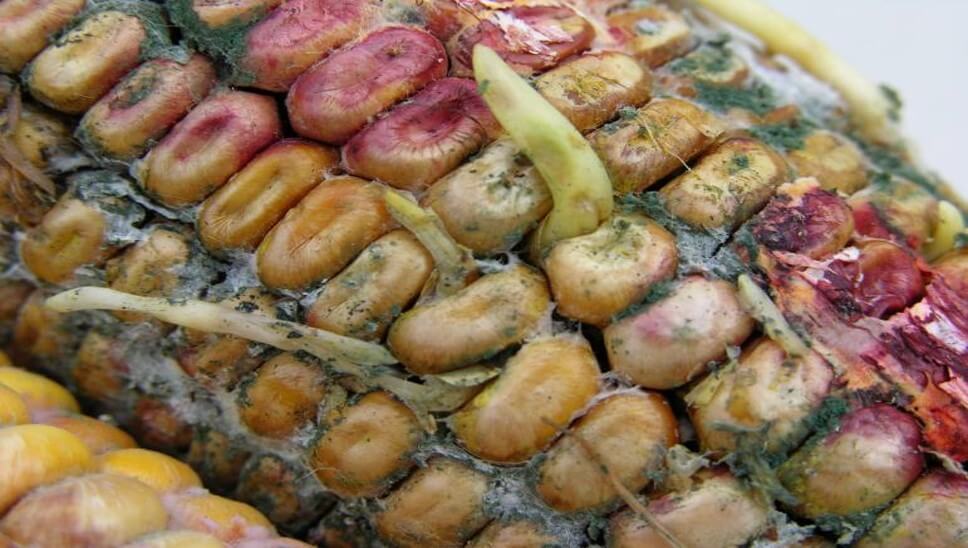
Gibberella ear rot is a significant disease that reduces the quality of grain corn, especially with the accumulation of mycotoxins (such as Deoxynivalenol (DON)) produced from the causal pathogen(s). Infection occurs through the corn silk channel when ideal temperatures (~27°C) and high humidity are present. Cool, wet conditions after pollination favour disease development and determine the degree of infection. With crop management practices providing only modest improvements in disease control, strategies to increase the efficacy of fungicides are important to investigate. Research has shown that the timely application of fungicide labelled to suppress the disease can reduce mycotoxins, but only by ~50%. We wondered if changes in the method of application could give better results.
It is reasonable to assume that improvements in spray deposit uniformity and increases in overall spray coverage (up to some threshold) at the infection channel (i.e. the silks) should result in improved efficacy. Water sensitive paper is an excellent tool for the qualitative evaluation of spray coverage. However, recognizing the complicated relationship between dose and coverage, we also looked at the deposition of copper sulphate as a surrogate for active ingredient .
Our primary objective of this study was to compare various sprayer systems and nozzle configurations by evaluating both spray coverage and copper sulfate deposition at the silks.
Experimental Design
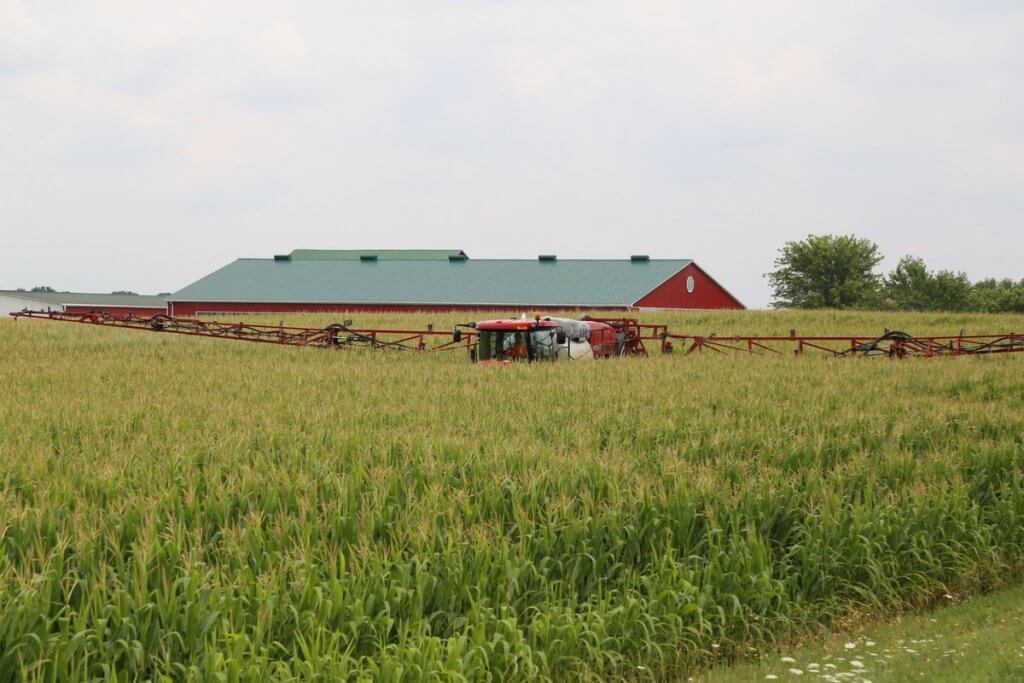
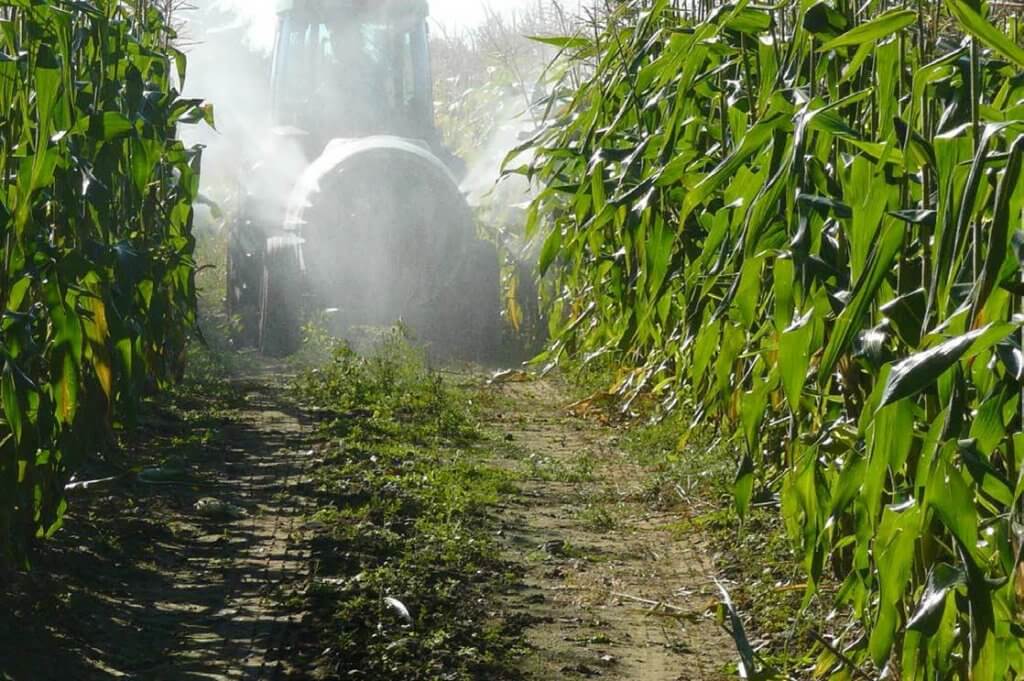
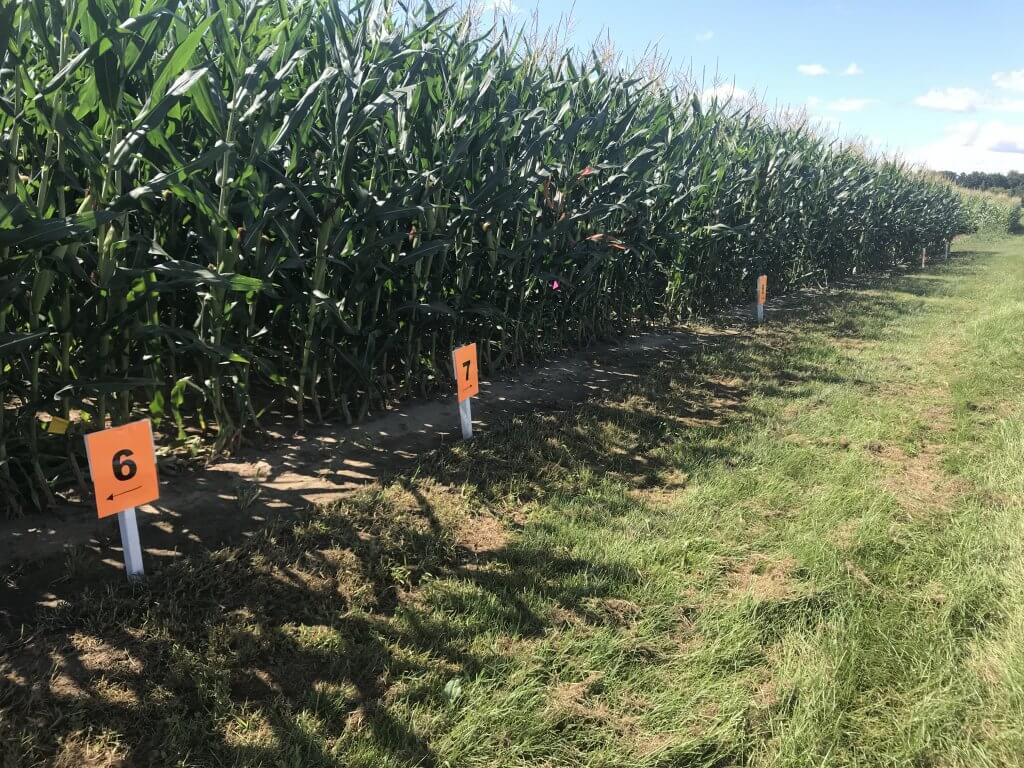
The test field of hybrid corn had a stand of ~80,000 plants/ha. It was located at Ontario’s U of G Ridgetown Campus and was managed similar to a grower’s field (e.g. fertility, etc.). In August of 2019 we evaluated nine sprayer rigs (or nozzle configurations) in a randomized block design.
The ground rigs were calibrated to deliver a spray volume of 190 L/ha and the aerial systems to deliver 47 L/ha. In order to achieve the target spray volume, the ground rig speed varied from 9.5 to 13 km/h, depending on nozzle configuration. The aerial applicators used the same nozzle configuration, travel speed and altitude as in their commercial field applications.
| Sprayer | Nozzle Set | Notes |
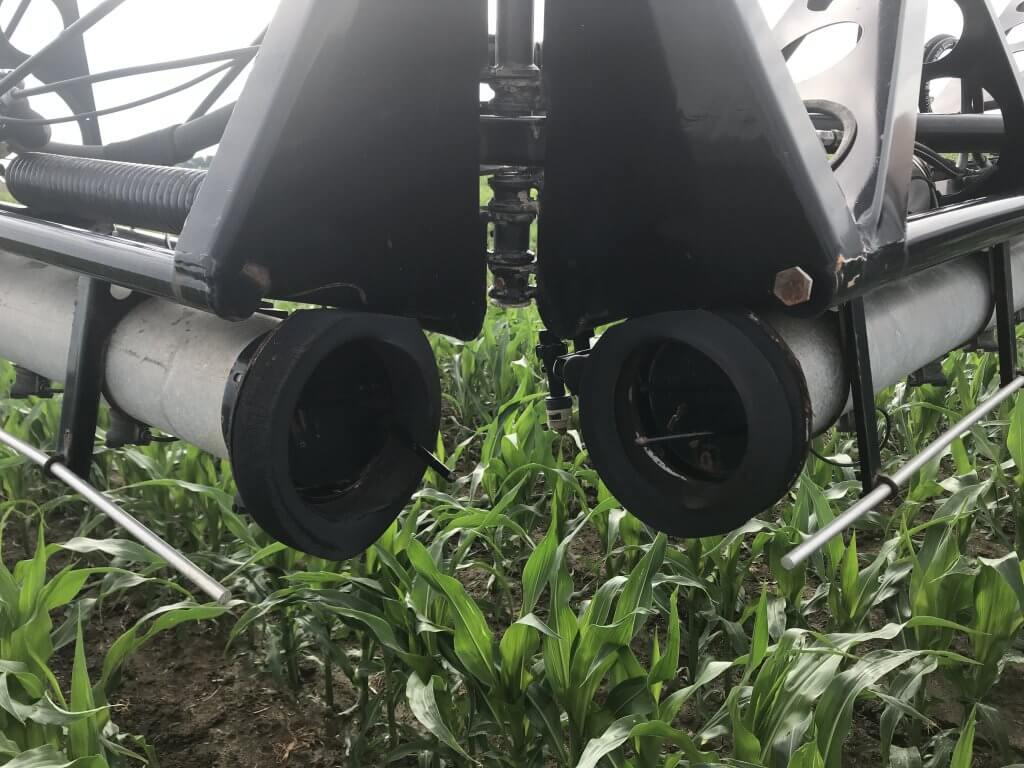
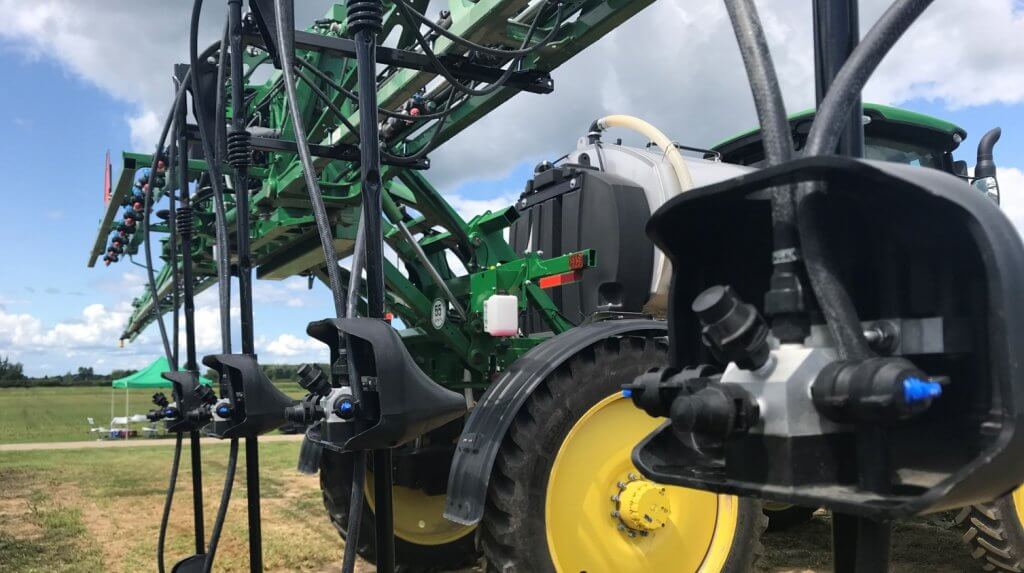
| John Deere | Yield Center 360 UNDERCOVER drop pipes 75 cm (30″) spacing, each equipped with two Turbo TeeJet (TT) nozzles. | Drop pipes were centred between corn rows with nozzles adjusted to spray ~horizontally and directly at the corn silks. |
| John Deere | Pentair Hypro Guardian Air nozzles on 50 cm (20″) spacing. | Boom positioned to create 100% spray overlap at tassel height. |
| John Deere | Turbo TeeJet Induction (TTI) nozzles on 50 cm (20″) spacing. | Boom positioned to create 100% spray overlap at tassel height. |
| John Deere | Turbo TeeJet (TT) nozzles on 50 cm (20″) spacing. | Boom positioned to create 100% spray overlap at tassel height. |
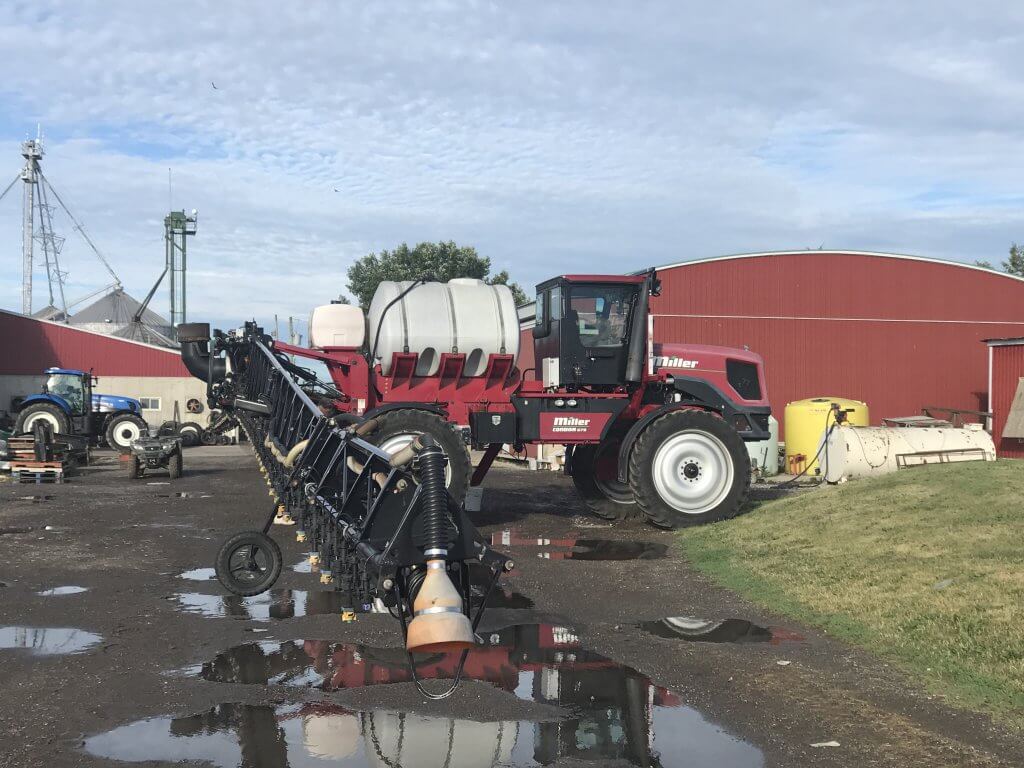
| New Holland (front-mounted boom) | Wilger 60 degree conventional flat fan nozzles on 40 cm (16″) spacing. | Boom positioned to create 100% spray overlap at tassel height. |
| New Holland (front-mounted boom) | Wilger 60 degree conventional flat fan nozzles alternating with custom-made Wilger 40 degree conventional flat fan nozzles on 40 cm (16″) spacing. | 40 degree nozzles were positioned between corn rows (interrow) while 60 degree nozzles were positioned over the tassels. |
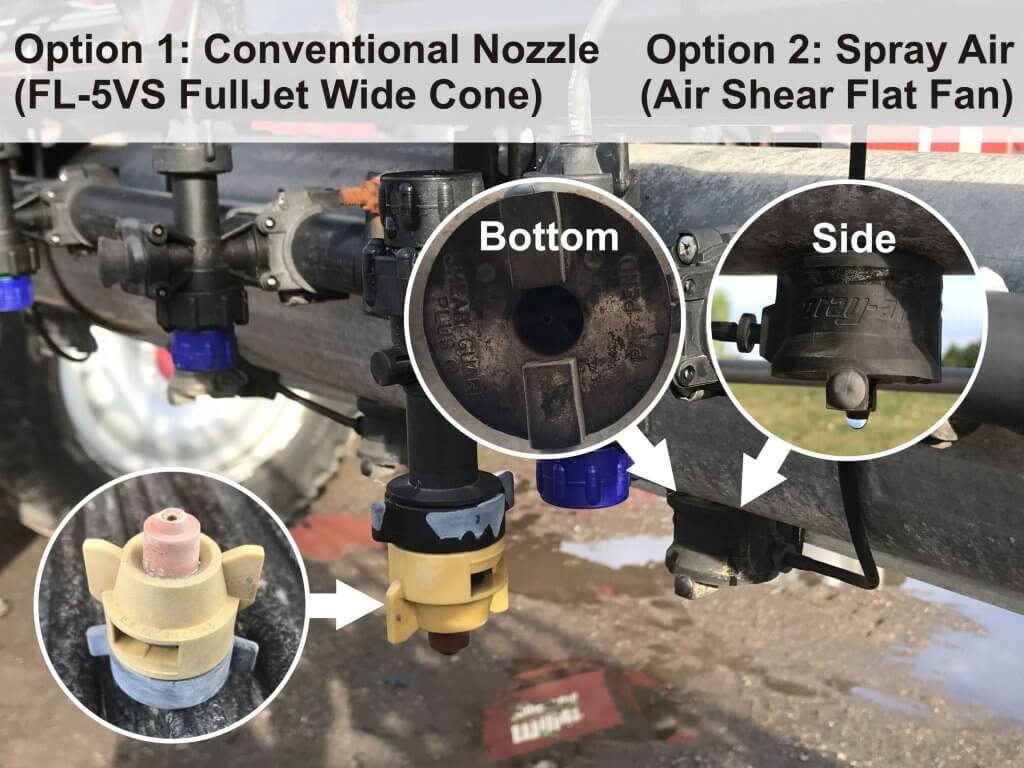
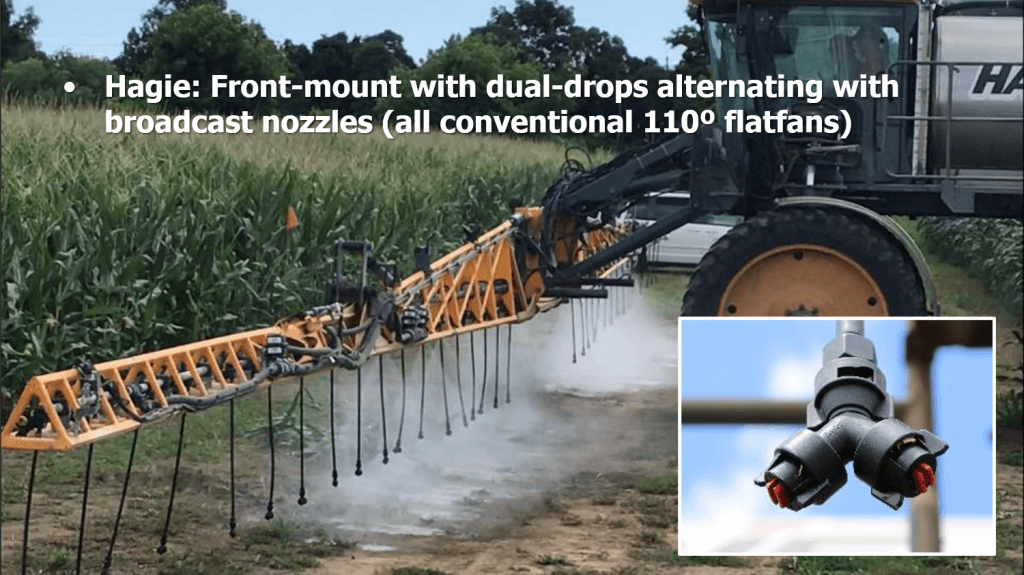
| Hagie (front-mounted boom) | Drop hoses terminating with TeeJet Duo Nozzle bodies equipped with Turbo TeeJet Induction (TTI) nozzles were alternated with TeeJet XR110 nozzles. | Drop hoses were centred between corn rows but nozzles were not aimed directly at the corn silks (aimed down 45 degrees and spray parallel to ground rather than perpendicular). They alternated with the AI nozzles positioned over the tassels. |
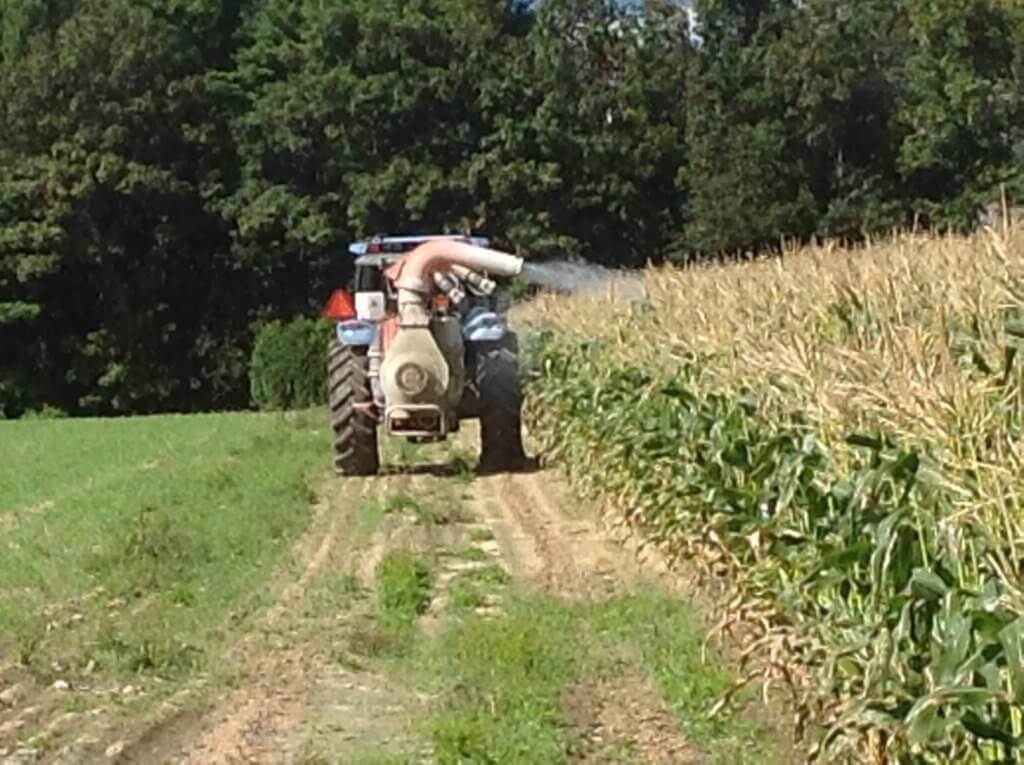
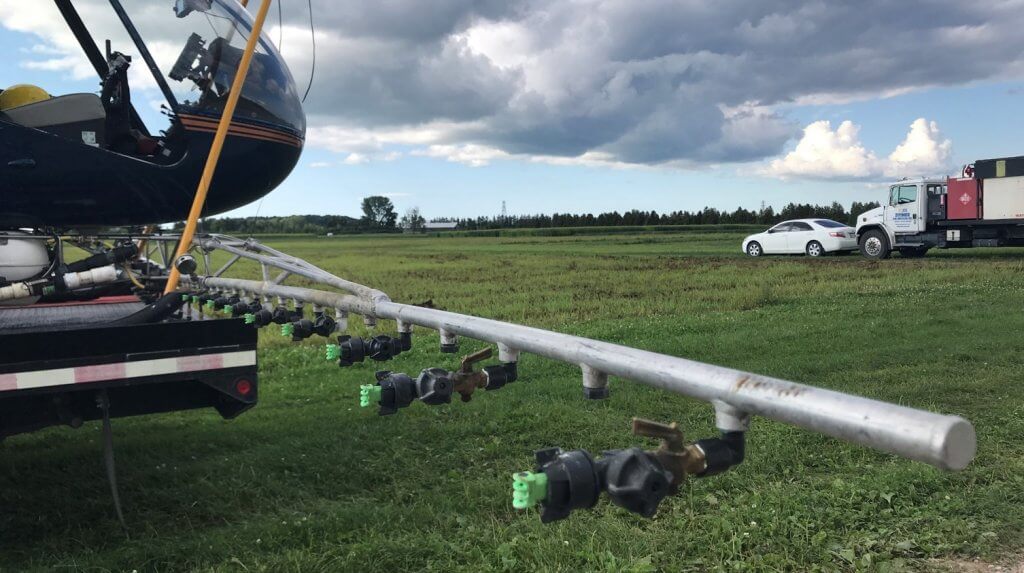
| Helicopter | Air Induction TeeJet Turbo TwinJet (AITTJ) nozzles directed backwards. | |
| Airplane | CP-111T nozzle bodies with CP256-4015 40 degree flat fan tips on 15 cm (6″) spacing. | Wingspan was 14.2 m with a 10.6 m boom width. |
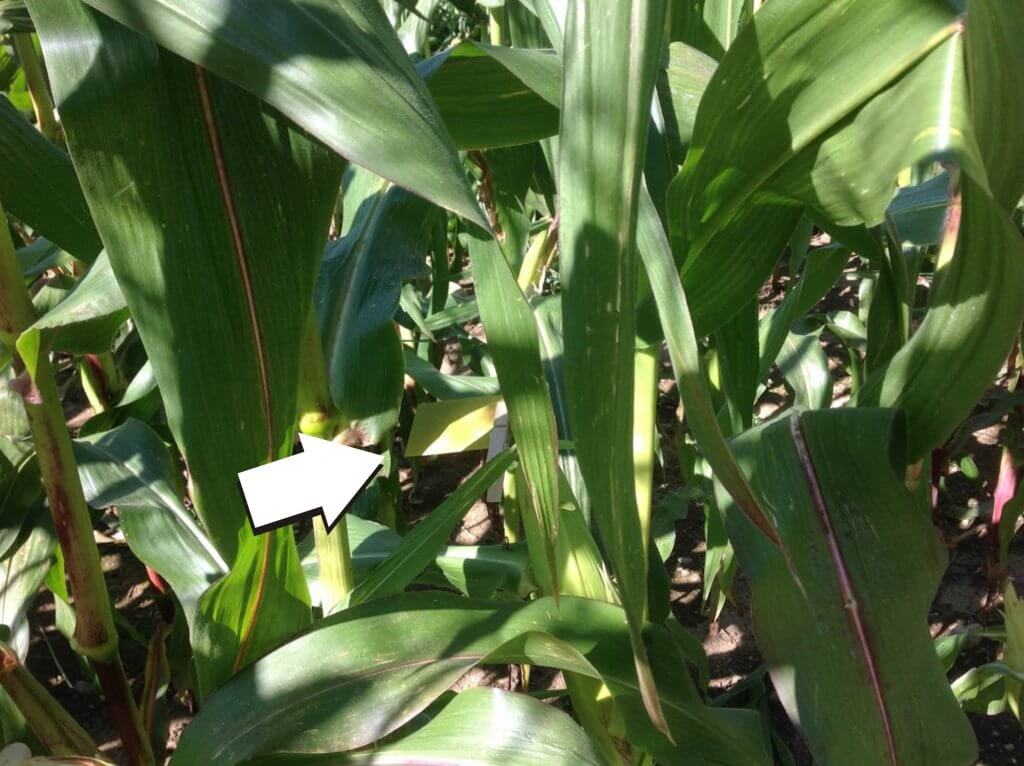
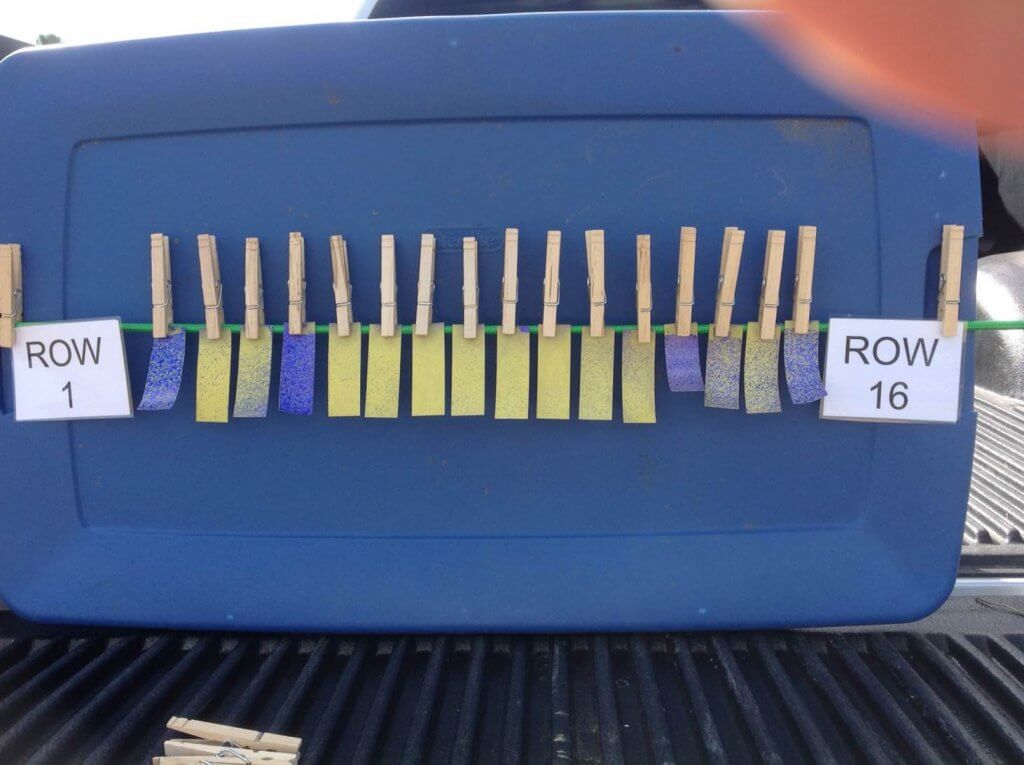
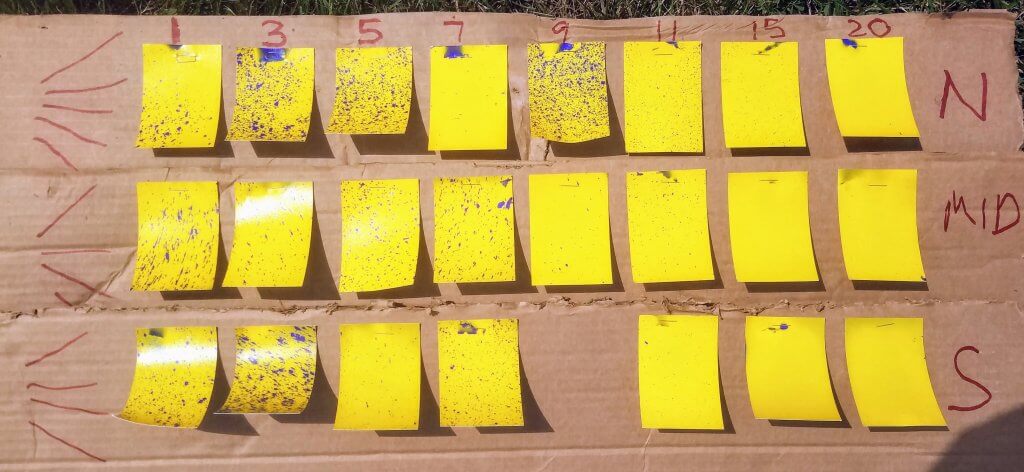
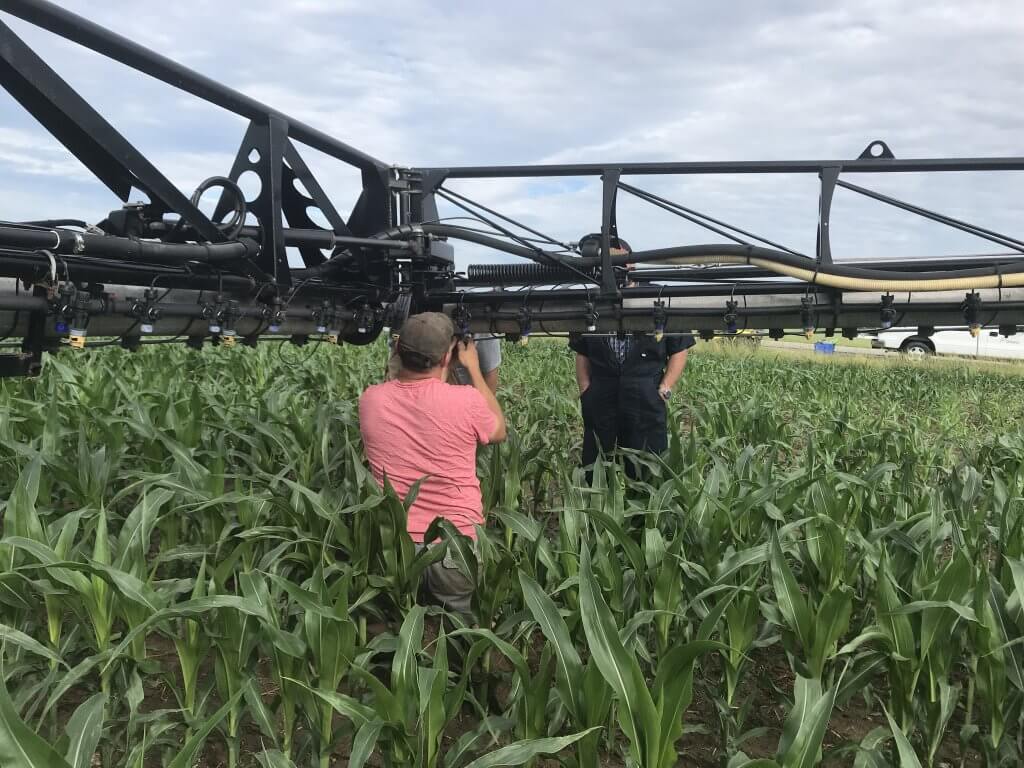
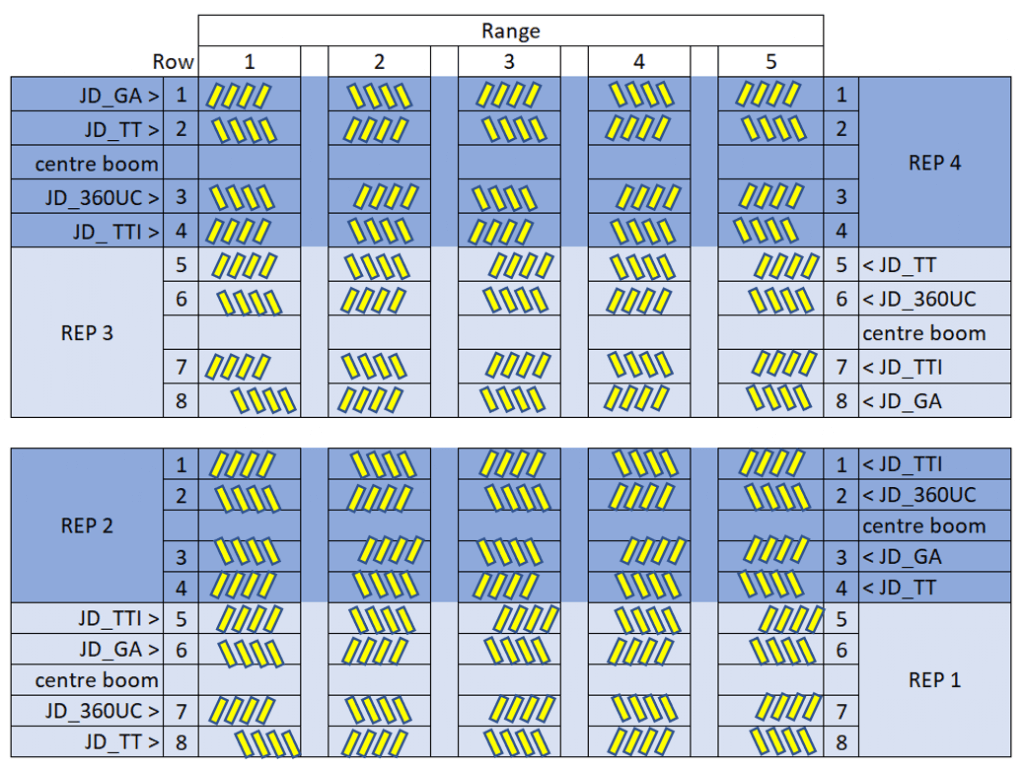
The field was divided into four replicated blocks (REP 1-4 in the image below) which corresponded with a single pass of the sprayer. The sprayers alternated direction with each pass over the four blocks. Depending on the ground rig, a single pass through a block might include more than one set of nozzles. For example, in the image below, a John Deere sprayer carried a different nozzle set on each of four sections, leaving the centre boom section off. Therefore, each block was subdivided into four experimental units that corresponded with each nozzle set. Further, to account for variability, each experimental unit was further subdivided into five ranges. Four water sensitive papers (yellow rectangles) were oriented sensitive-side up and fastened to random corn plants directly on top of silks at each of the five intersections between range and treatment for a total 20 papers. This was replicated four times for a final count of 80 papers per treatment.
Evaluating Coverage
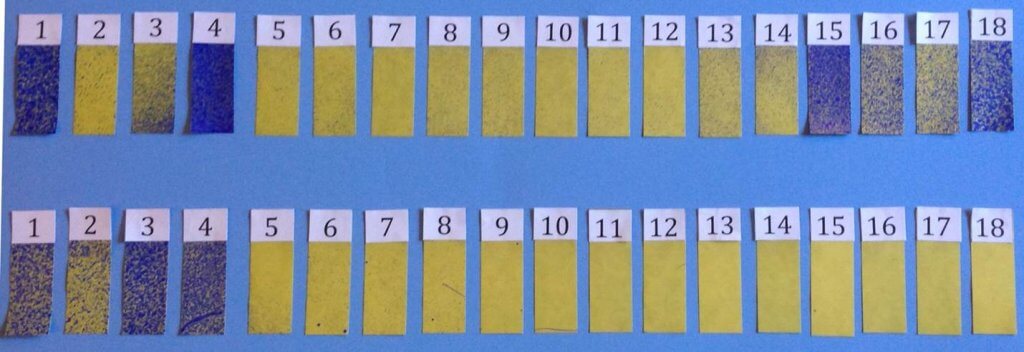
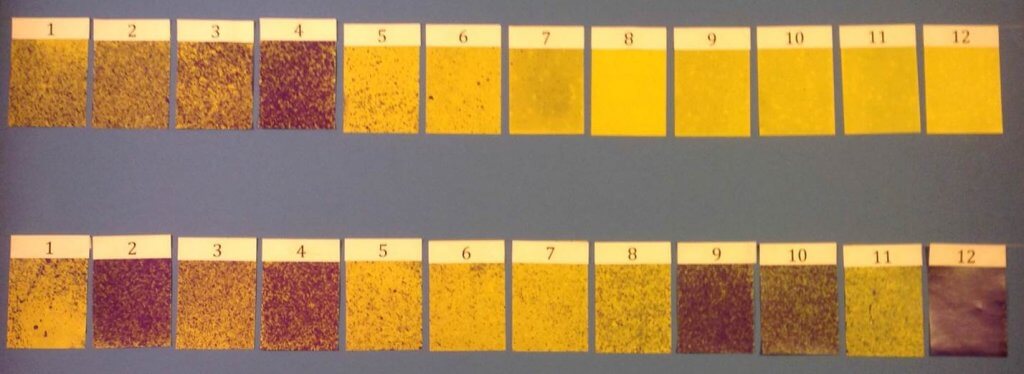
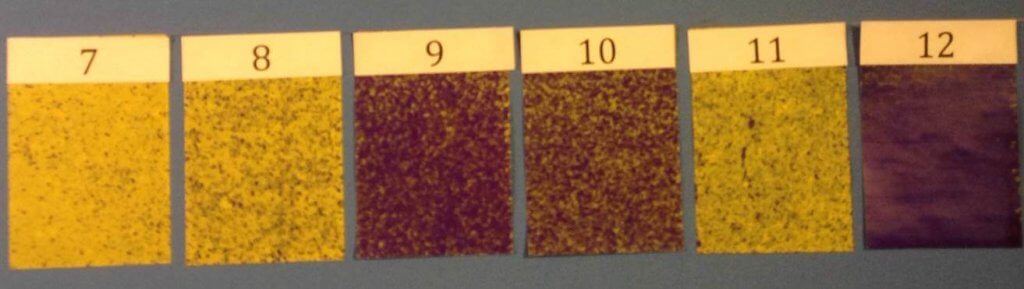
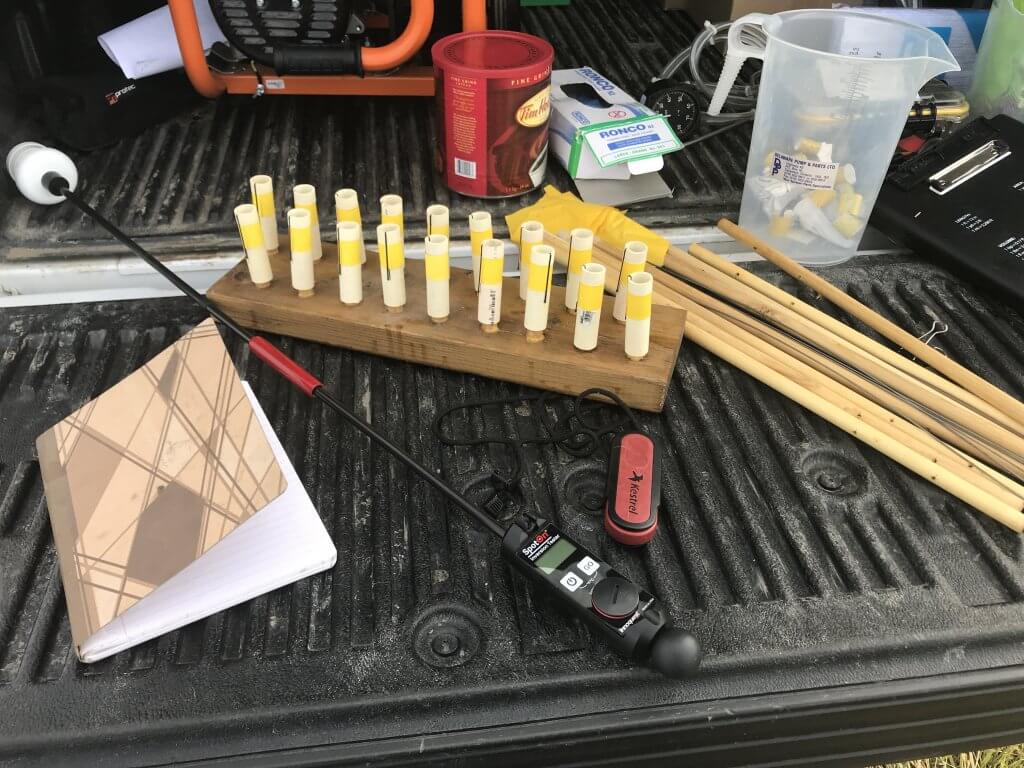
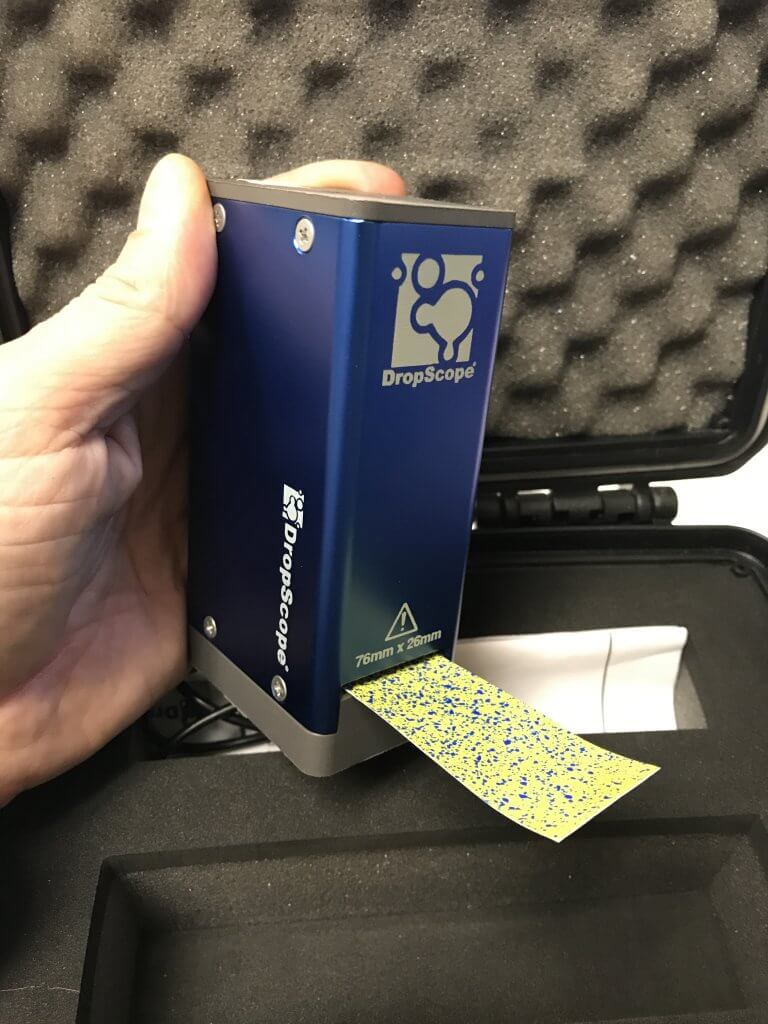
Each sprayer applied copper sulphate (Plant Products Inc., Leamington, ON) at 2 kg/ha as a chemical tracer. Agral 90 was added to the spray solution at 0.1% (v/v) to better emulate a typical fungicide application. After spraying, each water sensitive paper was allowed to dry, collected and then digitized using a DropScope (SprayX, Sao Carlos, Brazil). Droplet density and percent surface covered were evaluated within the detection limits of the equipment. Dose (represented by deposit volume) was more relevant to this study than percent surface covered, so a spread factor was used to convert area covered to volume. Once the papers were scanned they were subjected to flame emission spectroscopy (FES) (Actlabs – Activation Laboratories Ltd., Ancaster, ON) to determine the amount of copper deposited.
Results
Deposit area and volume
Note that papers were placed singly, oriented face-up. This was a missed opportunity to explore abaxial (down-facing) coverage and may have created a small experimental error wherein deposition from copper sulphate would be accounted for on both sides, but would only resolve on one side for area and density analysis. The results from evaluating water sensitive paper suggest trends and serve as quality checks for the experiment.
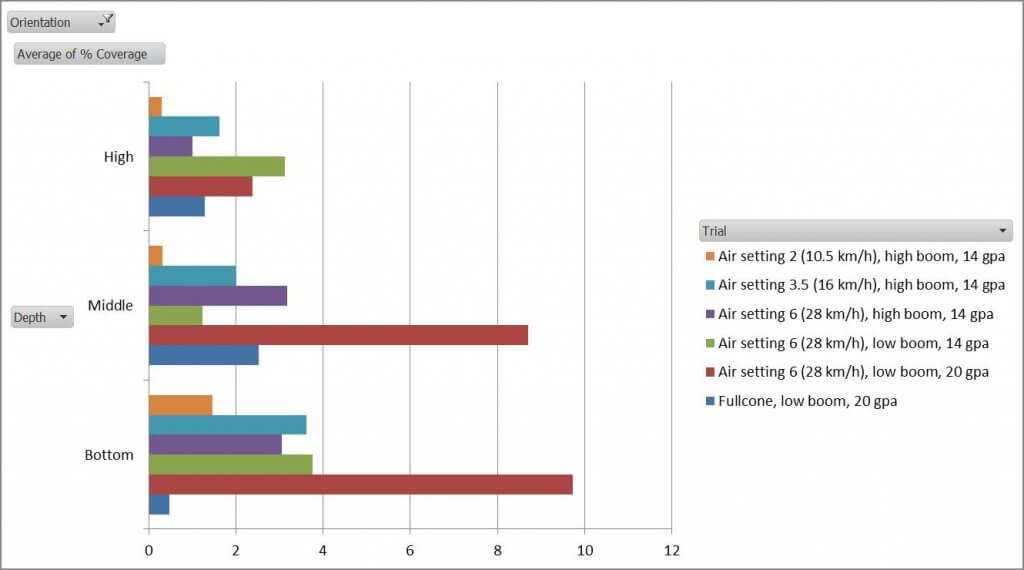
The percent area covered on water sensitive papers was affected by nozzle configuration (P<0.0001). Ground rigs produced ~4.0-12.0% area coverage, while aerial produced ~0.7-1.0%. It is not appropriate to compare ground and aerial spraying using water sensitive paper. Water sensitive paper does not reliably resolve deposits under ~60 µm and therefore underestimates the deposits from aerial applications because their spray quality tends to be finer. Further, these figures have not been normalized to reflect the differences in sprayer volume (190 L/ha for ground versus 47 L/ha for aerial).
The nozzle configurations with the highest percent area covered were produced by the 360 Undercover drop pipes and the TeeJet drop hoses (~9.5-12.0%). Coverage variability increased with percent area covered, but the lower 95% confidence limit with the pipes and hoses still exceed the upper limit of all overhead broadcast nozzles.
When area covered was converted to volume, estimated deposit volume on water sensitive papers was also affected by nozzle configuration (P<0.0001). The estimated volume calculated from deposit area showed fewer statistical differences across nozzle configurations compared to area data. However, once converted, there was no statistically significant difference in the volume deposited by drops or most broadcast methods.
Copper deposition
FES residue analysis (i.e. evaluating the amount of copper deposited on targets expressed as mass density) complements the water sensitive paper data. There are some differences that should be noted:
- All applications sprayed the same amount of tracer per planted area. As such, depositions are more fairly compared with no need for normalization.
- FES can resolve copper deposits as low as 0.5 µg/sample and may be more sensitive than the WSP method, which does not reliably resolve deposits under ~60 µm.
- WSP will only resolve coverage on one surface. However, when these papers are subjected to FES, deposits on both sides of the paper will be accounted for, providing a more accurate result.
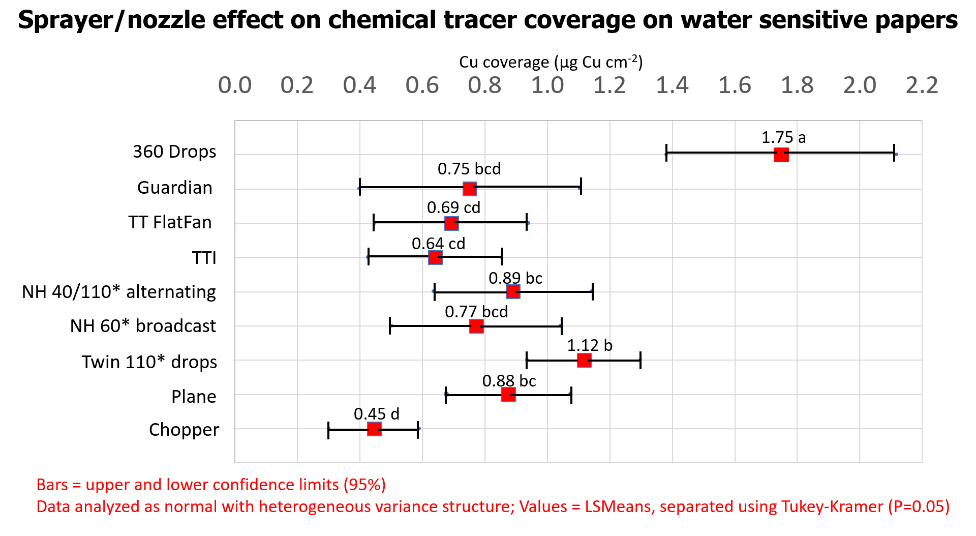
As anticipated, there was no correlation between the area coverage or volume estimates and the FES-derived copper deposition data. Estimated copper mass density on water sensitive papers was affected by nozzle configuration (P<0.0001). Analysis showed 56% more copper deposited from the 360 Undercover nozzles (1.75 µg/cm2) compared to the next highest deposition (1.12 µg/cm2) which was from the drop hose configuration (P<0.05). We feel the TeeJet drop hose configuration would have performed better still had the nozzles been directed at the silks, and the alternating broadcast nozzles been omitted and flow redistributed to the nozzles on the drops (see below).
Copper deposition from the airplane was similar to ground rigs with broadcast overhead nozzle configurations. The airplane deposited ~2x the copper as did the helicopter. It is assumed this is because the rotary atomizer nozzles on the airplane produced a much finer spray quality than the TTI nozzles on the helicopter. This increased the number of droplets considerably and has been shown to produce better coverage, particularly at such low sprayer volumes. Learn more about droplet size and behaviour here.
Average copper deposition from the Guardian Air nozzle set was similar to all other ground sprayer overhead broadcast setups, but had the highest variability (Between 0.4 and 1.12 µg/cm2). Comparatively, the lower 95% limit of the 360 Undercover drop pipe deposited 3.4x the copper as the lower limit of the Guardian Air.
Conclusions
- The best deposition was produced from the Yield Center 360 Undercover drop pipes, followed closely by the TeeJet Duo nozzle body on drop hoses.
- The deposition from ground sprayers with overhead broadcast nozzles was ~30% less than that of the two drop nozzle systems tested.
- The deposition from Guardian Air and TTI nozzles were among the lowest of broadcast nozzle configurations with higher variability, but differences tended not to be statistically different (P=0.05) compared to other broadcast nozzles.
- The deposition from the airplane was similar to the ground rig overhead broadcast applications, but the helicopter deposited the lowest amount of copper overall, likely due to droplet size (see image below).
Next steps
In the summer of 2022 we re-evaluated promising nozzle configurations from this study, as well as other application methods (see bulleted list below).
- Include various RPAAS (remote piloted aerial application systems) designs.
- Include the Agrotop Beluga drop hose (Greenleaf Technologies, Louisiana, USA) with two nozzle bodies to span the silking zone of the canopy.
We used water sensitive paper as a qualitative indicator, but folded them to get adaxial and abaxial data. We also used copper deposition to indicate dose. Once the results are analyzed we’ll write a companion article to this one.
In 2021 and 2022 a separate study was performed to evaluate the efficacy, ease-of-use and return on investment of the Beluga drop hoses in corn. An article describing that work can be found here.
Thanks to the agrichemical companies, students, equipment owners and operators that donated their time and equipment to make this study possible.
Bonus
Watch these very cool slow-motion videos of the airplane and helicopter applications. Note that there is no difference in how the spray behaves once released; It deposits as a function of wind, gravity and momentum and is not “blown in” by the helicopter.