
- Read nozzle tables: find nozzle color in the top row, pressure in the left column, intersecting cell gives flow rate.
- Use tables for calibration and to choose nozzle rates; remember different nozzles or pressures with same flow give different spray angles and droplet sizes.
- Avoid operating nozzles at extremes of pressure or flow; use pressure for small adjustments, change nozzle for large rate changes.
- Validate every nozzle and check overlap and spray pattern by measuring flow and observing with a partner standing behind the sprayer.
This text was generated by OpenAI GPT 5 Mini
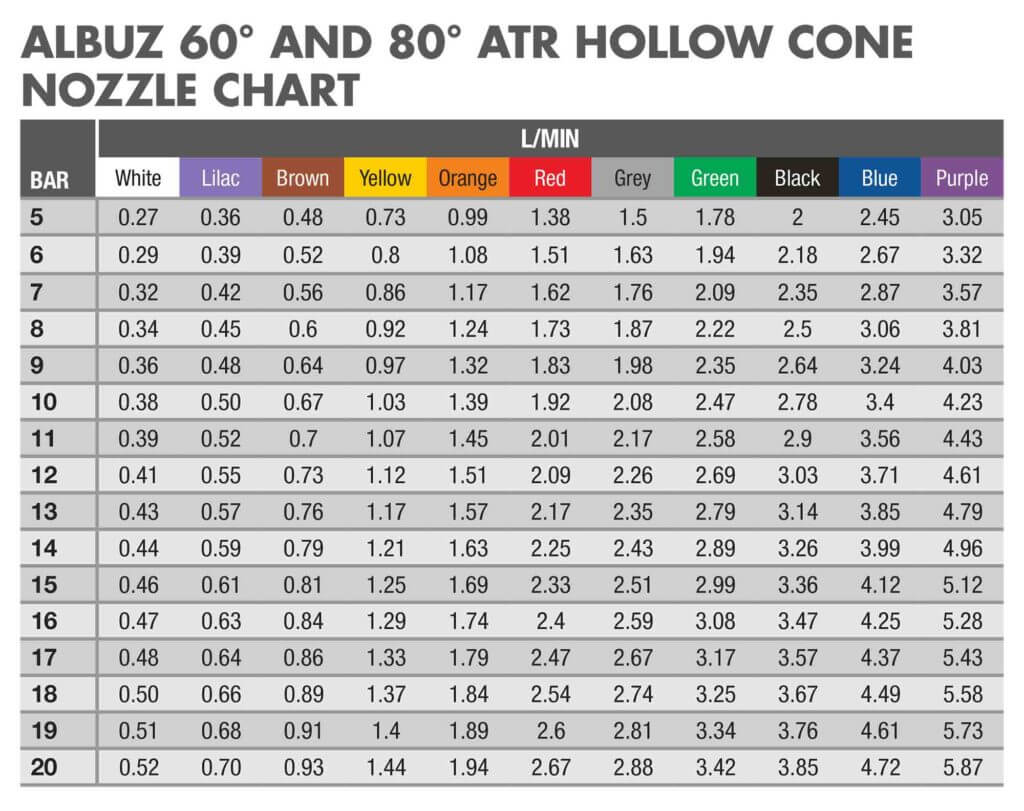
Airblast operators should know how to read a nozzle table. They are found on dealer and manufacturer websites as well as in their catalogs. Table layout varies with brand, but they all relate a nozzle’s flow rate to operating pressure. The better tables also provide the spray angle and the median droplet size (i.e. spray quality).
Operators need this information to complete calibration calculations (aka sprayer math) and when deciding how to distribute nozzle rates, angles and spray quality along a boom relative to the target canopy.
This article focusses on hollow and full cone nozzles, which are commonly found on airblast sprayers. For more information on flat fan nozzle tables (e.g. for banded under-canopy or, vertical booms or broadcast applications from horizontal booms), refer to this article.
Reading the table
Let’s use the table below to determine a nozzle’s flow rate for a given pressure. First, find the nozzle colour in the top row. Second, find the operating pressure in the left-most column. Finally, the flow rate is indicated in the cell at the intersection between the row and column. For example, a red ATR hollow cone nozzle operated at 9 bar will emit a flow rate of 1.83 L/min.
Perhaps you want to determine which nozzle will give a specific flow rate. Find the rate in the body of the table and trace the column and row to determine which nozzle/pressure combination will achieve it. For example, if we want a flow rate of ~1.00 L/min, we can use a Yellow at 10 bar or an Orange at 5 bar. Yellow is the better choice since the Orange would have to be operated at the bottom of its pressure range (more on that later).
Note: Do not to confuse TeeJet’s ISO-standardized TXA or TXB nozzles with TXVK or ConeJet nozzles. They may be the same colour, but their outputs are very different.
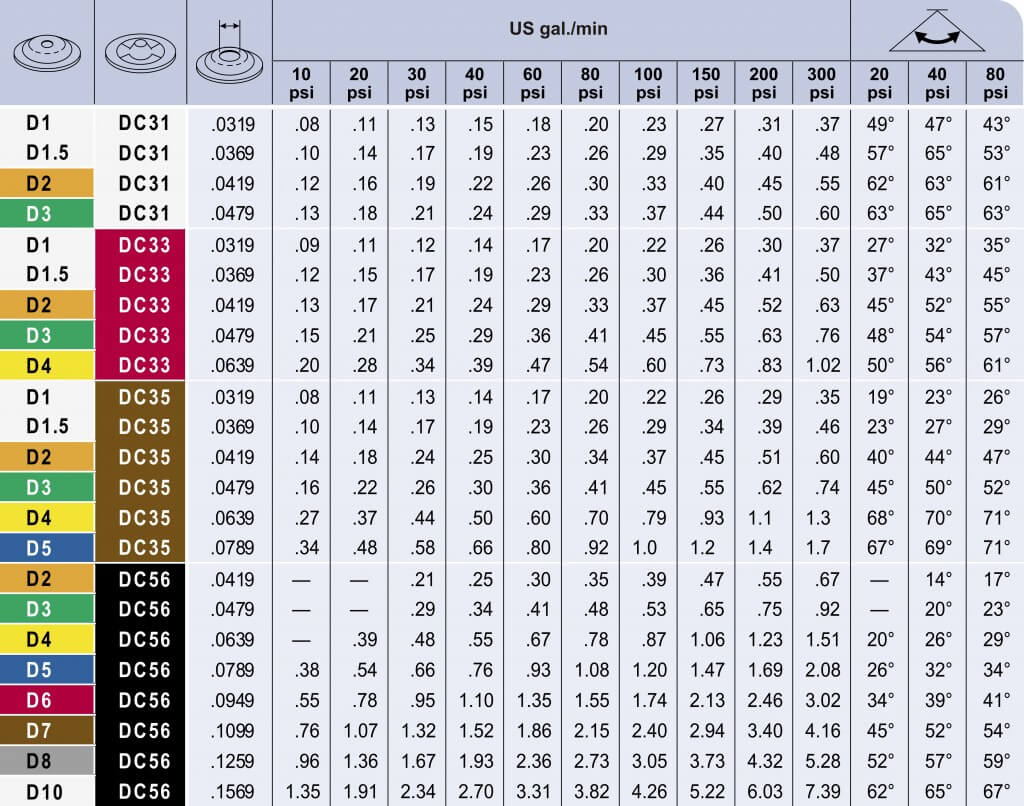
Higher flow rates or full cone patterns can be achieved using combination disc and core (or disc and whirl) nozzles. Depending on the manufacturer, the disc plate is defined by it’s diameter in 64th’s of an inch. The core or whirl plate might be described by the number of holes (e.g. 2-hole, 3-hole, etc.), or some other manufacturer-specific nomenclature (e.g. 45’s, 25’s etc.).
Using the table below, we see that a D2 disc and a DC35 core will emit 0.34 gpm at 80 psi. By continuing along the row, we see that the spray angle for this combination will be 47 degrees at that pressure.
Pressure problems
Do not choose a nozzle at the extreme of their flow or pressure range. A trailed PTO sprayer will experience pressure changes from driving on hills, or rate controllers will create pressure changes in response to changes in travel speed. In either situation, coverage will be compromised if the nozzle is pushed outside its optimal range.
Note: Use pressure to achieve small changes in flow, but for more extreme changes, switch nozzles. Remember, it takes 4x the pressure to get 2x the flow. Stated differently, it takes 1/4 the pressure to get 1/2 the flow.
You may not find a nozzle/pressure combination that emits the rate you are looking for. When your desired rate or pressure falls between the figures listed in the table, you can take the average. When nozzling an entire boom with different nozzle rates, get each position as close as you can to achieve the overall boom rate for a given pressure. It’s always a compromise – don’t stress over it.

Different nozzles, same rate
Different disc core combinations, or molded nozzles at different pressures, can produce similar flow rates. However, their spray quality and spray cone angles can be very different (see last three columns in the TeeJet table above).
The angle of the spray cone can have a big impact on spray coverage. When the target is far away from the corresponding nozzle (e.g. the tops of nut trees), or the canopy is very, very dense (e.g. citrus canopies), consider tight-angled full cones under high pressure. This is inefficient and can give variable coverage, but it is sometimes the only option in extreme situations.
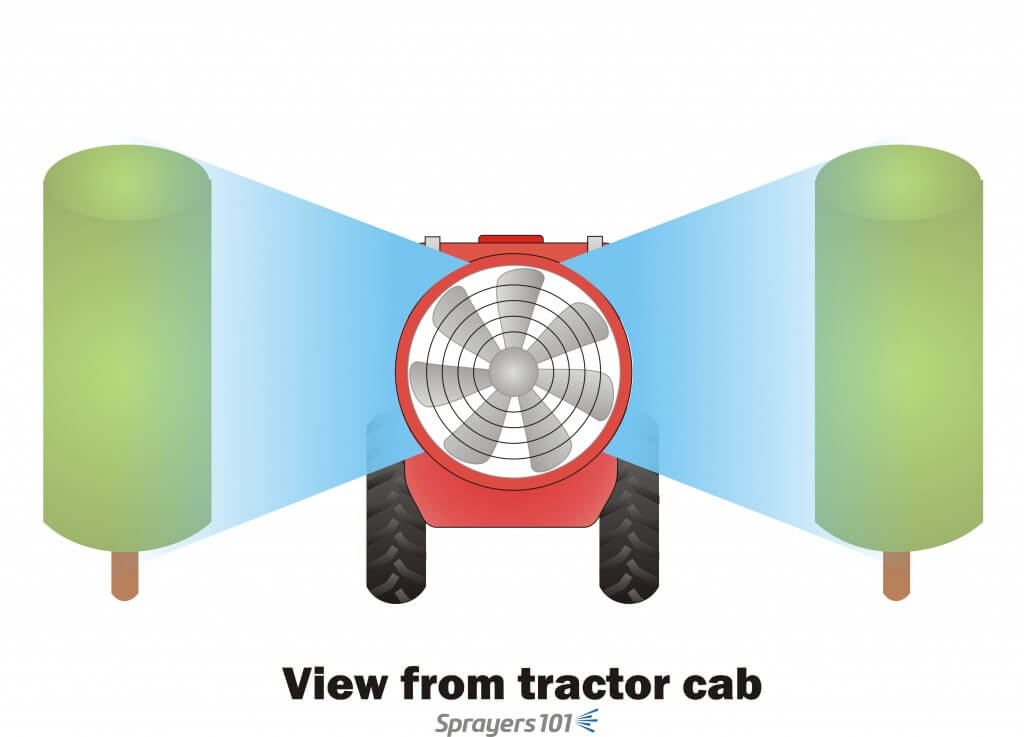
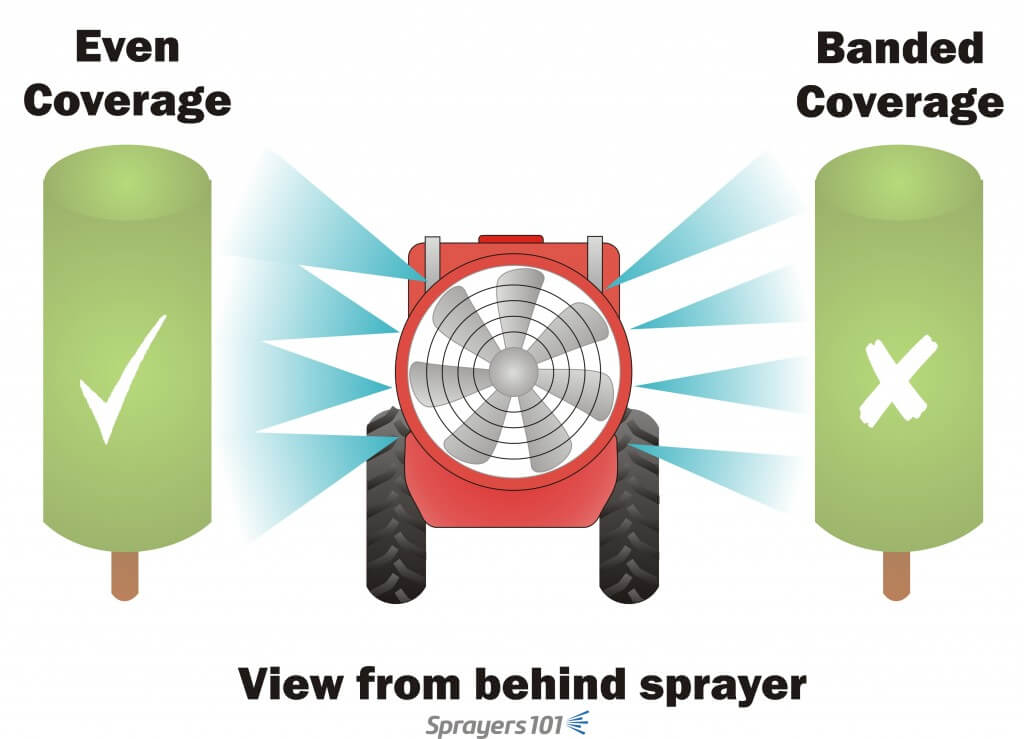
When the target is very close to the sprayer, full cones do not overlap and create undesirable striping or banded coverage. Creating a full, overlapping spray swath that spans the entire canopy is a function of nozzle spacing, distance-to-target, and sprayer air-settings. It can also be affected by humidity, wind speed and wind direction at the time of spraying.
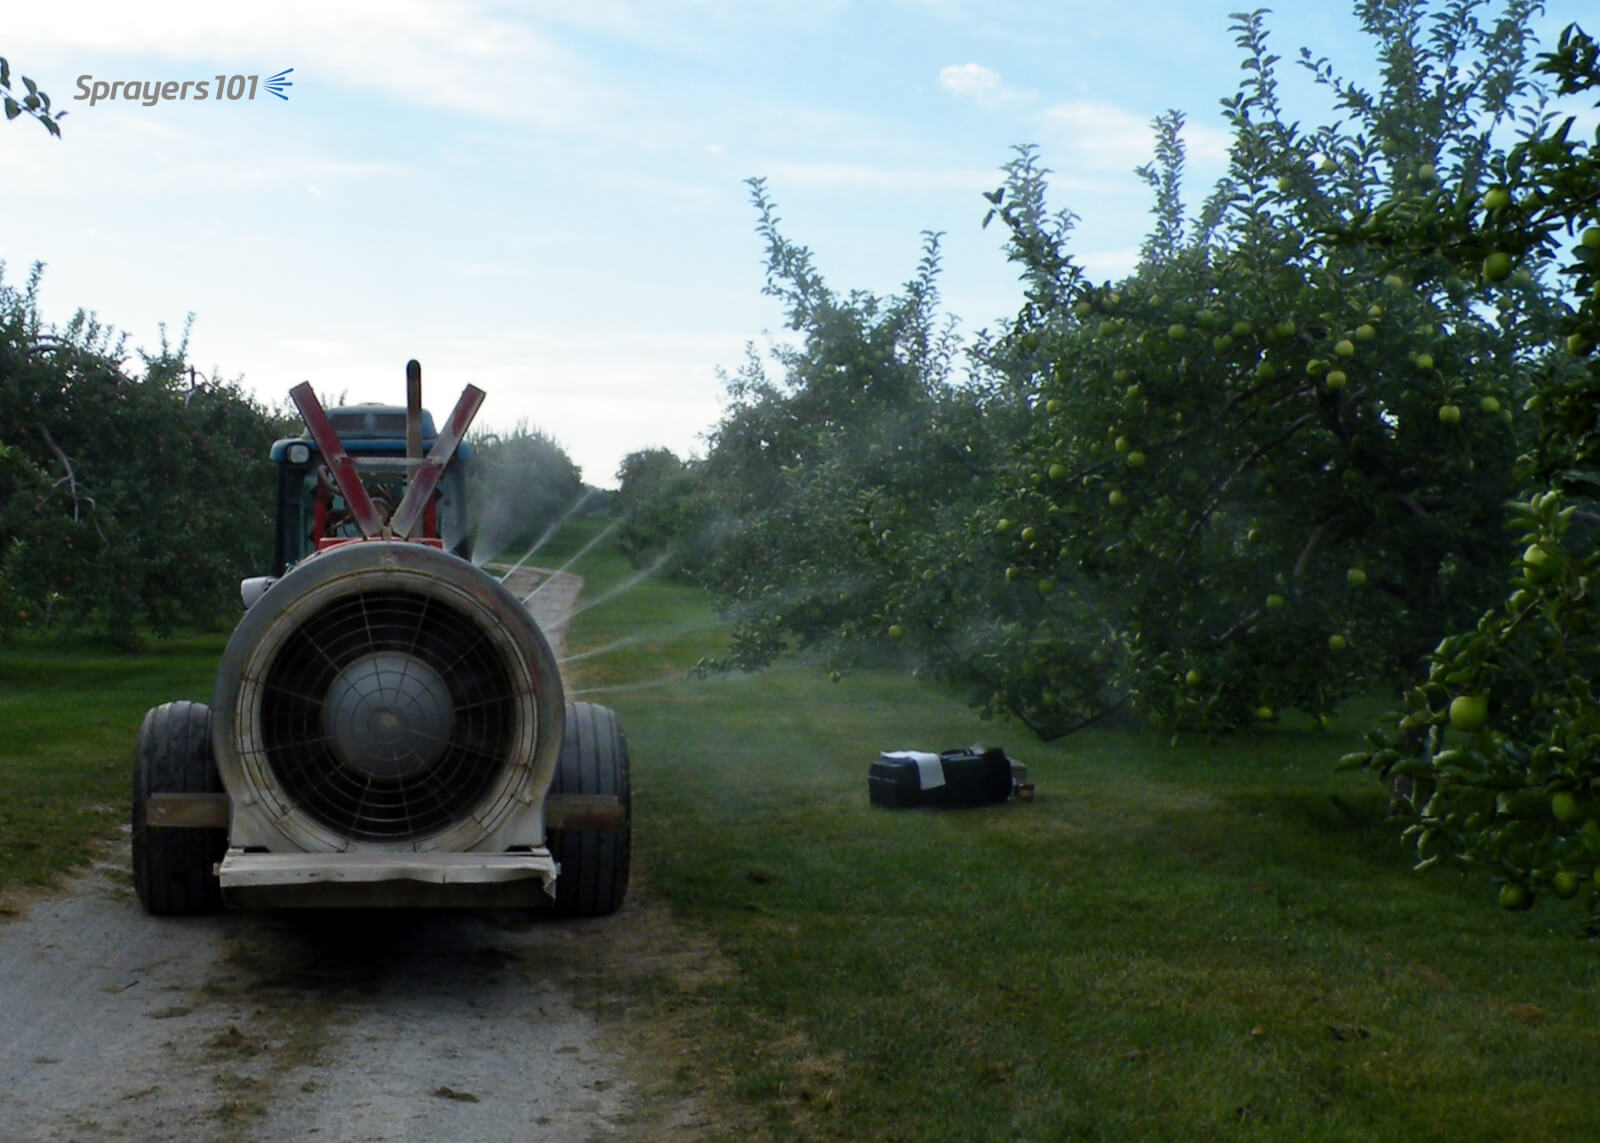
Confirm your settings by parking the sprayer in the alley between crops. With the air on, spray clean water while a partner stands a safe distance behind the sprayer to look for gaps in the swath. The partner will see things the operator’s shoulder check will not reveal.
Nozzle tables can be wrong
Sometimes nozzles do not perform per the nozzle table. We have discovered errors in published tables, worldwide. Here are the big three:
- Conversion errors. Manufacturers publish catalogs in Metric and in US Imperial, but we have found many errors in the conversions.
- Spray angle errors. When nozzles are operated at the extremes of their pressure ranges, spray angles deviate from those listed in the tables.
- Flow rate errors. When tables are not updated to reflect changes in nozzle design, or the manufacturing process, actual flow rates deviate from those listed in the tables.
Perhaps it’s not the table, but the nozzle itself. Most nozzle manufacturers accept a flow variability up to +/- 2.5% for new nozzles, but we have seen higher. It depends how they are made (machined, stamped, printed) and the material they are made of.
Validate flow rate and pattern
When errors are discovered and reported, the manufacturers can be slow to issue corrections and the errors will persist in old tables. Yes, even apps (which are often based on tables) can be wrong. So, predicted flow rates can prove unreliable. This is why it is important to double check by observing nozzle overlap and validating flow rate when you replace nozzles – even when they are brand new.
Thanks to Dr. David Manktelow (Applied Research and Technologies, Ltd., NZ) for input into this article.