Category: Nozzles and Droplets

For Basics Category

  • Don’t try this tempting shortcut

    Don’t try this tempting shortcut

    There’s a call that I’ve been getting for 20 years now. It came again this week. Someone has a twincap with two small air-induced tips, and they’re applying herbicides and fungicides with low water volumes, often 5 gpa, sometimes less. They call because they want to know how much wind they can spray in. Is 30 km/h OK? They want my blessing.

    I don’t need to hear much more. Some nozzles are sold entirely on the premise that they provide superior coverage – more droplets per square inch – and that this improved coverage permits the reduction of water volumes. Furthermore, the claim goes, when water is reduced, the spray concentration increases and the whole darn package just works a lot faster and better.

    This line of thinking is as old as spraying itself. Applicators seek pesticide performance as well as productivity, and this approach gives them both. The proponents are well aware of their customers’ desires, and sell into it. “Use these tips and cut back on water. Any more than this just runs off anyways. You’ll get better coverage and better performance, get more spraying done.” It’s a convincing argument. Get an edge on your neighbour, the person who’s not in on the secret and is wasting time and water.

    Why don’t I embrace it? There are a few reasons.

    First, it doesn’t tell the whole story. Invariably it involves a twin nozzle setup. Use two nozzles, get more droplets, right? If that were true, believe me, I’d be advocating for quintuples.

    Fact is that the only factors that change droplet numbers are droplet size (spray quality) and water volume. Want more droplets at the same water volume? Make the spray finer. Want to keep spray quality and add droplets? Add water (not nozzles).

    The easiest way to improve coverage at the same volume is to use a finer nozzle, or to increase spray pressure. Depending on how far you go, you could make the spray finer and cut water, and still have more droplets per square inch.

    The hardest way to improve coverage is to purchase a twincap and buy two nozzles, each of them half the size. True, within any given nozzle type, smaller sized tips usually generate finer sprays. But why bother with two tips? They’re more expensive and plug more.

    If someone asks me how to improve coverage without changing water volume, I usually tell them to speed up a few mph. The rate controller will increase pressure and the spray gets finer. If speeding up is not possible, get one size smaller nozzle and run at higher pressure, same speed. Or keep nozzle and speed, and add some gpa, pressure will go up. It’s that easy. No twins necessary.

    Second, the twin nozzle/low volume approach exaggerates the value of the twin nozzle for herbicides. With small plants and relatively open canopies in the early season, plus our high booms and travel speeds, the twin tips are not adding a lot, if anything at all, to coverage. It remains a sum of droplet size and water volume, the angle is not important at this stage. Deposit is by turbulence and wind, most of the time.

    Third, low volume believers ignore a few potential problems. Drift is a big one. Low volume, fine spray operators are surrounded by nervous neighbours. They have fewer hours per day during which drift is acceptably low. And they definitely should not be on the field when wind is at 30 km/h. Basically, they’re a bit uncomfortable (at least they should be) and get less done per day.

    Another potential problem is evaporation. Most sprays, even when applied at lower volumes, are still 90% or more water. The same volume of water evaporates much quicker when atomized into smaller droplets. This has two main downsides: On their way to the canopy, small droplets evaporate and become even more drift prone, and may not impact at all. Those that impact evaporate shortly thereafter. Research has shown that pesticide uptake is better from wet than dry deposits.

    When Delta T (dry bulb minus wet bulb temperature) is high, evaporation can be so strong that it reduces pesticide performance or causes solvent burn. Fine sprays make it worse.

    I also hear about the use of oily adjuvants to control evaporation from small droplets. This could be even more dangerous. Small droplets drift, and evaporation to dryness is actually helpful in reducing the impact of that drift. How? It makes the small droplets disappear, with their remnants dispersing into the turbulent atmosphere. With oily adjuvants, the small droplets stick around and stay potent and their drift damage is much worse.

    Lastly, the practice is possibly off label. Water volume and spray quality label statements are designed to offer good performance and acceptable drift risk. While that part of the label is often a bit dated, it does provide better support from the manufacturer should something go wrong.

    If you’re spraying under hot, dry and windy conditions, the low volume, fine spray approach is irresponsible. Use sufficient water (7 to 12 gpa) to allow low-drift sprays, at least Coarse to Very Coarse, in some case, even coarser.

    Agronomists provide the best possible information for their clients, based on scientific evidence and experience and in accordance with their professional code of ethics. Sometimes the news we deliver aren’t what the customer wants to hear. But we have to represent the interests of all of us, collectively. I find that pretty important.

  • What Nozzle is This? (Field Sprayers)

    What Nozzle is This? (Field Sprayers)

    Us this handy visual guide to identify a mystery nozzle you may find on a field sprayer. We’ve included the most common low-drift nozzles found on North American, European, and Australian sprayers. The list does not contain any conventional flat fan nozzles.

    It’s in alphabetical order by manufacturer.

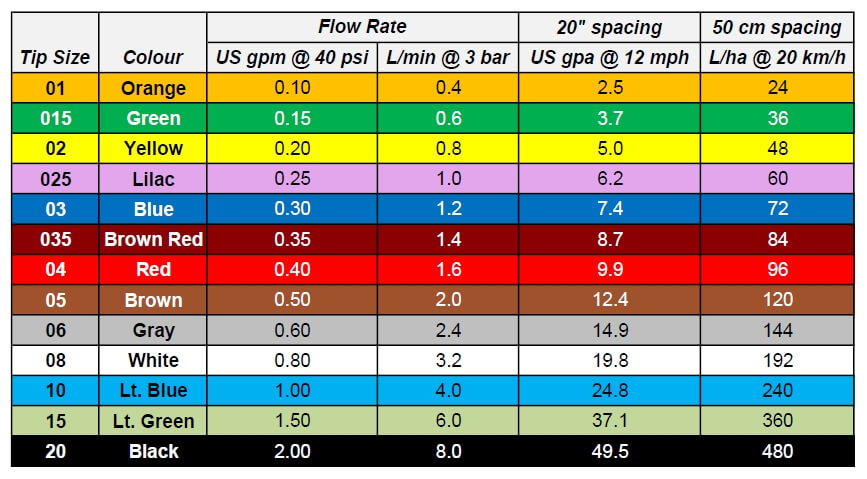
    First, a reminder of the ISO colour coding of nozzles by nominal flow rate, and their approximate output at normal speeds and nozzle spacings.

    ISO Flow rate colour coding and benchmark application volumes for US and metric units

    Also recall that most nozzles have markings that identify their fan angle (usually 30, 40, 65, 80, 90, 110, 120, 130, or 150 degrees, with 80 and 110 being most common) or flow rate (in US gpm, as shown in figure above).

    Albuz (manufactured in France)


    Albuz AVI (also John Deere ULAC)
    Type: Air-Induced
    Average Pressure: 60 psi
    Average Spray quality: VC
    Sizes Available: 01 – 10

    Albuz AVI Twin
    Type: Air-Induced Twin
    Average Pressure: 60 psi
    Average Spray quality: VC
    Sizes Available: 01 – 06

    Arag (manufactured in Italy)

    Arag Compact Fan Air (CFA)
    Type: Air-Induced
    Average Pressure: 60 psi
    Average Spray quality: C
    Sizes Available: 01 – 04
    Arag Compact Fan Air Ultra (CFA-U)
    Type: Air-Induced
    Average Pressure: 60 psi
    Average Spray quality: C-VC
    (intended for 2,4-D label compliance in Australia, available in 01 – 03 sizes only)
    Arag Twin Fan Low Drift (TFLD)
    Type: Pre-Orifice, suitable for PWM
    Average Pressure: 60 psi
    Average Spray Quality: VC – XC
    Sizes Available: 02 – 05

    Billericay Farm Systems (manufactured in UK)

    Billericay Farm Systems Air Bubble Jet (ABJ)
    Type: Air-Induced
    Average Pressure: 60 psi
    Average Spray Quality: M-C
    Sizes Available: 01 – 06
    Billericay Farm Systems EasyJet (known as Pulzar in UK)
    Type: Pre-Orifice, suitable for PWM
    Average Pressure: 60 psi
    Average Spray Quality: M-C
    Sizes Available: 01 – 08

    Greenleaf / Agrotop (manufactured in Germany)

    Greenleaf AirMix (made by Agrotop)
    Type: Air-Induced
    Average Pressure: 60 psi
    Average Spray Quality: C
    Sizes Available: 01 – 06
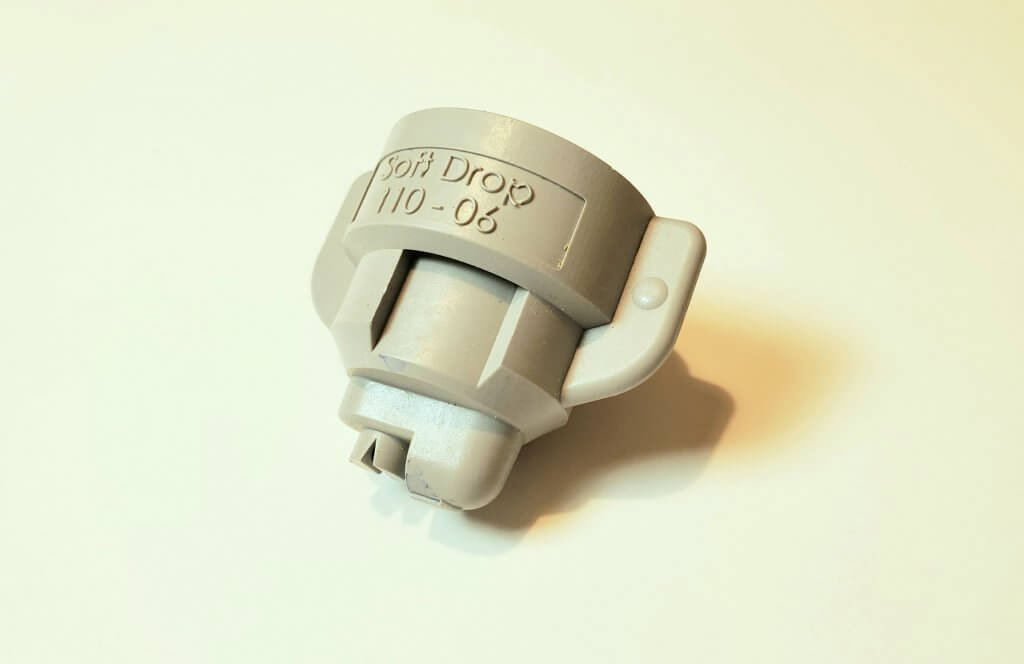
    Greenleaf SoftDrop (made by Agrotop)
    Type: Pre-orifice, suitable for PWM
    Average Pressure: 60 psi
    Average Spray Quality: XC – UC
    Sizes Available: 04 – 10
    Greenleaf TurboDrop-XL (TDXL, made by Agrotop). TDXL-D appears same, but has larger exit size and produces coarser sprays for dicamba
    Type: Air-Induced
    Average Pressure: 60 psi
    Average Spray Quality: TDXL, C-VC, TDXL-D, XC-UC
    Sizes Available: 01 – 15 (08 for -D)
    Greenleaf TADF (made by Agrotop). TADF-D appears same, but has larger exit size and produces coarser sprays for dicamba
    Type: Air-Induced Asymmetric Twin
    Average Pressure: 60 psi
    Average Spray Quality: TADF, C-VC, TADF-D, XC-UC
    Sizes Available: 01 – 15
    Greenleaf Dual Fan (DF, made by Agrotop), asymmetric twin.
    Similar to Hypro TwinCap, assembly can house two nozzles to produce a twin spray.
    Greenleaf Low Drift Dual Fan for PWM (BPDF)
    Uses AirMix nozzles with air portion removed.
    Spray Quality M – XC
    Sizes Available: 06 – 12

    Hypro Pentair / John Deere (manufactured in UK and USA)

    Hypro Guardian (Also John Deere LDX)
    Type: Pre-orifice, suitable for PWM
    Average Pressure: 40 psi
    Average Spray Quality: M
    Sizes Available: 015 – 08

    Hypro GuardianAIR (GA, also John Deere Low-Drift Air, LDA)
    Type: Air-Induced
    Average Pressure: 60 psi
    Average Spray Quality: C
    Sizes Available: 015 – 05
    Hypro Ultra Low-Drift (ULD, also John Deere ULD)
    Type: Air-Induced
    Average Pressure: 60 psi
    Average Spray Quality: C – VC
    Sizes Available: 015 – 08
    Hypro Ultra Low-Drift Max (ULDM)
    Type: Air-Induced, approved for PWM by Hypro
    Average Pressure: 60 psi
    Average Spray Quality: UC
    Sizes Available: 04 – 08
    Hypro GuardianAIR Twin (GAT, also John Deere GAT)
    Type: Air-Induced Twin
    Average Pressure: 60 psi
    Average Spray Quality: M-C
    Sizes Available: 02 – 08

    Hypro 3D (also John Deere 3D)
    Type: Pre-Orifice, suitable for PWM
    Average Pressure: 40 psi
    Average Spray Quality: M
    Sizes Available: 015 – 08
    Hypro TwinCap. Assembly can house two nozzles to produce a twin spray.

    John Deere LDM
    Type: Pre-Orifice, suitable for PWM
    Average Pressure: 60 psi
    Average Spray Quality: C – VC
    Sizes Available: 03 – 10
    John Deere LDM showing characteristic twin pre-orifice

    Lechler (manufactured in Germany)


    Lechler ID
    Type: Air-Induced
    Average Pressure: 60 psi
    Average Spray Quality: C – VC
    Sizes Available: 01 – 10

    Lechler ID3
    Type: Air-Induced
    Average Pressure: 60 psi
    Average Spray Quality: C – VC
    Sizes Available: 01 – 10

    Lechler IDTA
    Type: Air-Induced Asymmetric Twin
    Average Pressure: 60 psi
    Average Spray Quality: C
    Sizes Available: 02 – 08

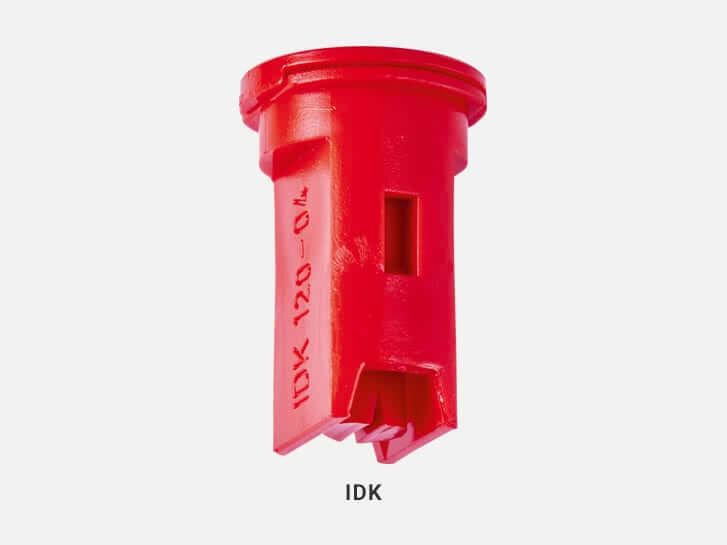
    Lechler IDK (Also Hardi MiniDrift)
    Type: Air-Induced
    Average Pressure: 60 psi
    Average Spray Quality: C
    Sizes Available: 01 – 10

    Lechler IDKT (Also Hardi MiniDrift Duo)
    Type: Air-Induced Twin
    Average Pressure: 60 psi
    Average Spray Quality: C
    Sizes Available: 015 – 06

    MagnoJet (manufactured in Brazil)

    Magnojet MUG
    Approved by EPA for Dicamba in US
    Type: Air-Induced
    Average Pressure: 70 psi
    Average Spray Quality: UC
    Sizes Available: 015 – 05

    TeeJet (manufactured in USA)

    TeeJet AIXR
    Type: Air-Induced
    Average Pressure: 60 psi
    Average Spray Quality: C
    Sizes Available: 015 – 10
    TeeJet AI
    Type: Air-Induced
    Average Pressure: 60 psi
    Average Spray Quality: VC
    Sizes Available: 015 – 15
    TeeJet TurboTeeJet (TT)
    Type: Pre-orifice, suitable for PWM
    Average Pressure: 40 psi
    Average Spray Quality: M-C
    Sizes Available: 01 – 12

    TeeJet TurboTwinJet (TTJ60)
    Type: Pre-orifice Twin, suitable for PWM
    Average Pressure: 40 psi
    Average Spray Quality: M-C
    Sizes Available: 02 – 10

    TeeJet Air-Induced TurboTwinJet (AITTJ60)
    Type: Air-Induced Twin (approved for PWM by TeeJet)
    Average Pressure: 60 psi
    Average Spray Quality: C-VC
    Sizes Available: 02 – 15
    TeeJet TurboTeeJet Induction (TTI)
    Type: Air-Induced (approved for PWM by TeeJet)
    Average Pressure: 60 psi
    Average Spray Quality: XC-UC
    Sizes Available: 015 – 15

    TeeJet Twin TurboTeeJet Induction (TTI60)
    Type: Air-Induced Twin (approved for PWM by TeeJet)
    Average Pressure: 60 psi
    Average Spray Quality: XC-UC
    Sizes Available: 02 – 08
    TeeJet AI3070
    Type: Air-Induced Twin
    Average Pressure: 60 psi
    Average Spray Quality: C-VC
    Sizes Available: 015 – 05
    TeeJet AccuPulse TwinJet (APTJ)
    Type: Pre-orifice Twin, suitable for PWM
    Average Pressure: 60 psi
    Average Spray Quality: XC- UC
    Sizes Available: 015 – 08

    Wilger ComboJet (manufactured in US and Canada)


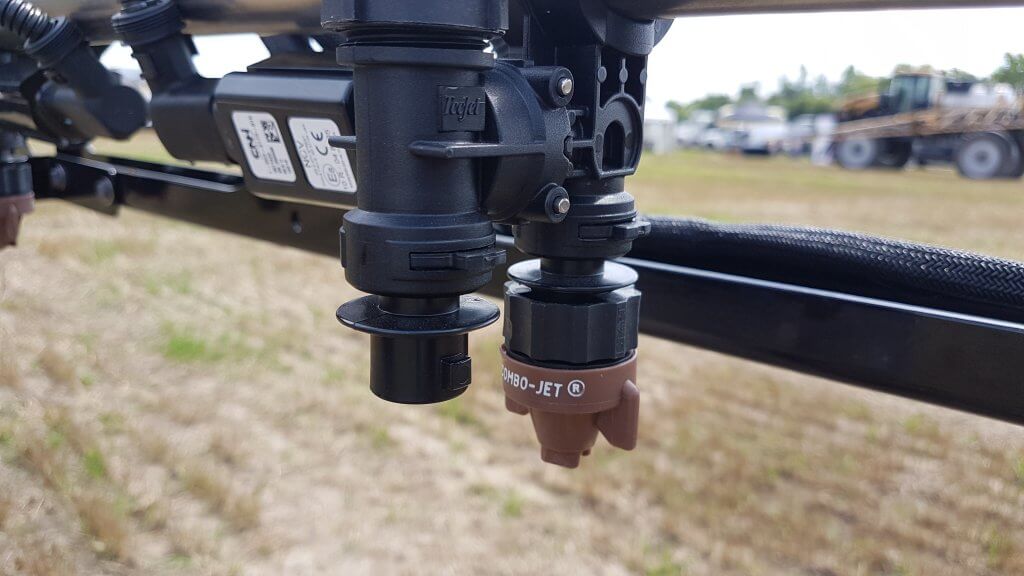
    Wilger ComboJet
    Available as ER,SR, MR, DR, and UR models. Appear similar, requires inscription to differentiate
    Type: Pre-orifice, suitable for PWM
    Average Pressure: 50 psi
    Average Spray Quality:
    ER: M
    SR: C
    MR: VC
    DR: XC
    UR: UC
    Sizes Available: 01 – 25
    Adaptor for Combojet tips on TeeJet connector
  • Nozzle Selection for Boom Sprayers

    Nozzle Selection for Boom Sprayers

    Picking the correct nozzle for a spray job can be a daunting task.  There is a lot of product selection, and a lot of different features.  We try to break the process down into four steps.

    1. Identify Your Needs

    Before making any assumptions about the right nozzle for you, review your needs and objectives. Are you trying to reduce drift? Do you want better coverage? Are you moving towards more fungicide application? Do you need a wide pressure range?

    It’s always a good idea to review your experience with your previous nozzle. What, if anything, would you like to change?

    2. Identify Flow Rates

    Most spray operations fall into one of three categories, (a) pre-seed burnoff (3 to 7 US gpa); (b) in-crop early post-emergence (7 to 10 US gpa); (c) late season application to mature canopies (10 – 20 US gpa).

    To find the right nozzle size, you need to know the application volume, the travel speed, and the nozzle spacing. Most sprayers have 20” nozzle spacing, but some have 15” spacing. Use these metric or US units charts to find the right flow rate for common nozzle spacings. Various on-line calculators from Hypro, Greenleaf / Agrotop, Lechler, or Wilger or their apps, are also helpful.

    If you use our chart, the top row lists water volumes. The columns contain travel speeds. Travel speed is somewhat flexible and can change throughout the field.

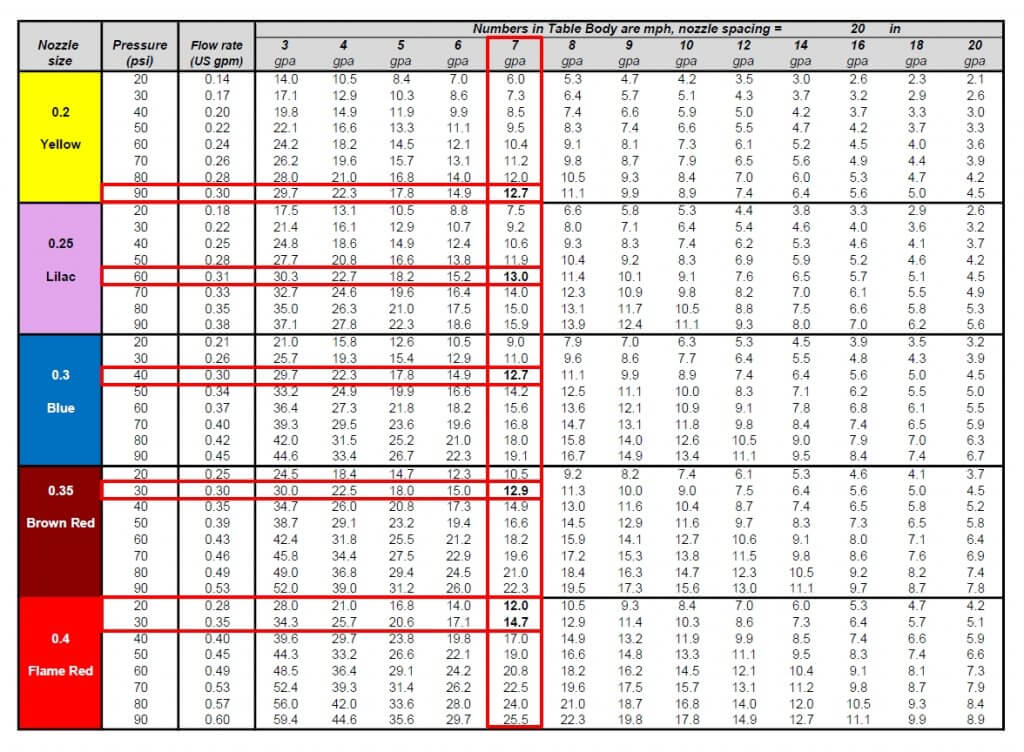
    Let’s assume the water volume is 7 gpa, and the desired application speed is 13 mph. Move down the “7 gpa” column, searching for 13 mph. You will encounter 13 mph about 5 times: 02 nozzle @ >90 psi, 025 nozzle @ 60 psi, 03 nozzle @ 40 psi, and 035 nozzle @ 30 psi (the 035 size is only offered by some manufacturers) and the 04 nozzle at about 25 psi.

    Nozzle chart, in US units, solving for 7 gpa at 13 mph. Five nozzles can produce the required flow, each at different pressures.

    Note that for the smaller nozzle sizes, the spray pressure is perhaps too high, and for the larger sizes, it is too low. Select a size that allows optimum nozzle performance and travel speed flexibility. In this example, the 025 size is optimal, producing an expected pressure of about 60 psi. The column for the 025 nozzle can now be used to predict the travel speed range from 30 psi to 90 psi, about 9 to 16 mph. For the 03 nozzle, the minimum speed would be 11 mph, too fast for some.

    For Pulse Width Modulation (PWM), slightly different rules apply. See here for instructions.

    3. Select the Nozzle Model

    For general spraying, we recommend intermediate spray qualities ranging from Medium to Very Coarse.

    These intermediate spray qualities offer good coverage at reasonable water volumes and good drift control. Their spray quality can be tailored with pressure adjustments to suit specific needs. For images, see here. In alphabetical order:

    Air Induced:

    There is plenty of selection in this popular category, all manufacturers offering similar specs and performance.

    Pulse Width Modulation:

    PWM nozzle selection is improving, but some gaps in availability remain.

    All nozzles should be operated near the middle of their pressure range, for air-induction this is 50 to 60 psi or higher, a bit less for non air-induced types. This allows maximum flexibility when travel speeds change or when spray quality is adjusted with pressure.


    For fusarium headblight, consider a twin fan nozzle.

    Keep your booms no more than 15” to 25” above the heads for best results.

    Air Induced:

    There is an excellent selection of twin fans from most manufacturers.

    Pulse Width Modulation:

    Relatively poor selection, limited flow rate ranges or spray qualities available for some models.


    For finer sprays (lower water volumes), simply increase spray pressure or consider a non-air-induced design.

    There has always been a large selection of finer sprays on the market, remnants from a time when drift was less important. Very few offer flow rates above 06 or 08, decreasing utility for PWM systems.

    Notice that conventional flat fan tips and most pre-orifice tips are absent from these lists. These nozzles are not recommended for herbicides because they produce sprays that are too fine for acceptable environmental protection (ASABE Fine and Medium). The added coverage afforded by such sprays only has value with low water volumes, and in those instances is more than offset by their higher drift and evaporation. An exception is the use of insecticides with contact mode of action targetting small insects such as flea beetles or aphids. In thes cases, finer sprays (ASABE Fine or Medium) may be required to provide effective tragetting.

    Very high flows are sometimes needed (11010 and above, usually for PWM). When this occurs, conventional flat fans have merit because the higher flow rates of any nozzle usually create coarser sprays, and even conventional tips will create sufficient coarseness to prevent drift.


    For the best drift protection, consider these tips.

    The advent of the dicamba-resistant trait in soybeans has spawned interest in very low drift tips that comply with the label requirements for these products. Although superior for drift control, they are not well suited for low volume or low-pressure spraying, nor for contact herbicides or grassy weeds, as spray retention and coverage may be poor. But they are very valuable when drift control is paramount and when higher volumes can be used to maintain adequate coverage.

    The following advice is based on the rules at the time it was written. These may be suitable for 2,4-D application in Australia under the newest APVMA guidelines (check spray quality to be sure it is VC or coarser). Many are also suited for Dicamba in Canada (must be XC or coarser), or dicamba in the US (must be on approved lists such as this one for Xtendimax or this one for Engenia, but caution is advised, some low pressure limits make them impractical. Always check that spray quality can be achieved at pressures that offer travel speed flexibility.

    Air Induced:

    Excellent selection. This market has received much attention in recent years.

    Pulse Width Modulation

    Before making a selection, check the nozzle’s recommended pressure range and the spray qualities within that range from the manufacturer info. The target pressure for these tips may differ from your expectations.

    4. Tweak and Confirm

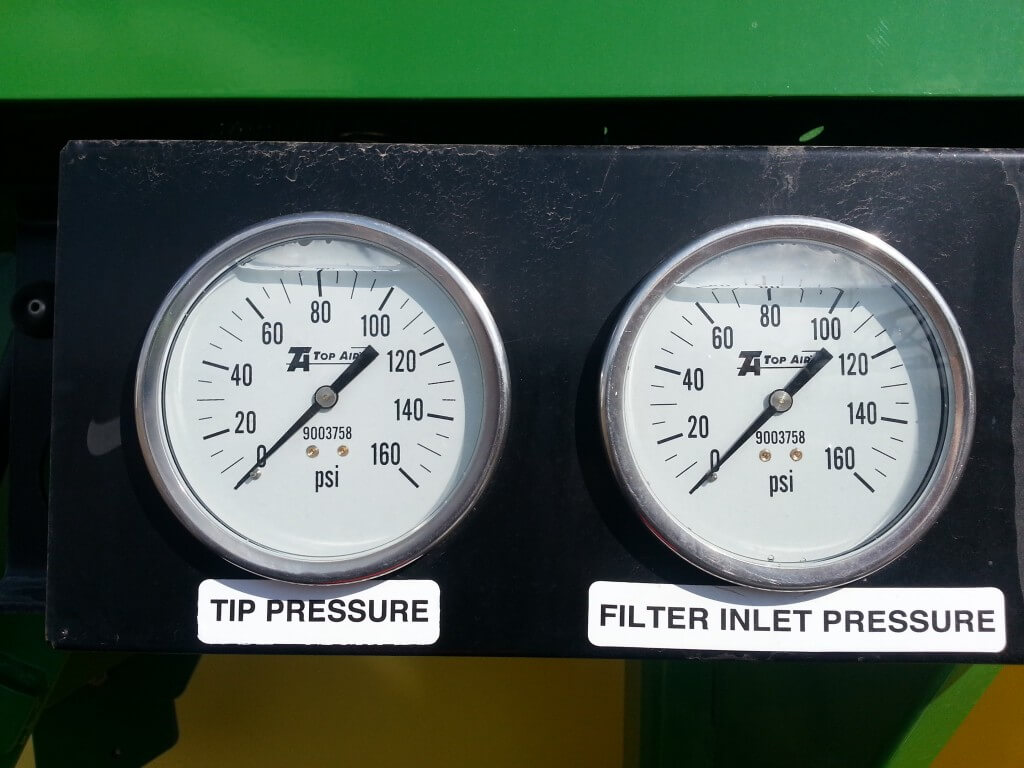
    Under field conditions, the spray pressures which produce the desired water volumes can vary from the charts. Make sure you trust your pressure gauge reading and know the pressure drop from the gauge signal to the nozzles, particularly with PWM, where the solenoid adds additional drop. Add the pressure drop to your target pressure reading. If using a rate controller, use the pressure gauge as your speedometer to ensure optimal nozzle performance. Adjust travel speed until the nozzle pressure meets with your spray quality and pattern goals. If that speed is too slow or fast…you have the wrong size nozzle and/or water volume.

    Spray pressure is more important than travel speed – make your pressure gauge your speedometer.

  • Reducing Selection Pressure for Herbicide Resistance

    Reducing Selection Pressure for Herbicide Resistance

    Herbicide resistance has been called the number one threat to conventional herbicide-based weed management strategies.

    Since the 1970s, the number of cases of herbicide resistant weeds has shown a linear increase both globally (currently at about 500 documented unique weed species x mode of action cases) and within Canada (at about 70 such cases), according to the herbicide resistance website WeedScience.org. The rate of increase has been constant, and there is not yet any reason to believe that growth in the number of cases will slow.

    Figure 1: Growth of global herbicide resistance cases (Source: WeedScience.org)

    By using herbicides, we select for weed biotypes that, for some reason, can tolerate the product. Mutations which confer herbicide resistance are rare, but present at very low levels in most weed populations. Repeated use of the same mode of action will increase the relative frequency of the resistant biotype until it becomes noticeable, and shortly thereafter, problematic.

    The best-known forms of resistance involve single-gene mutations that alter herbicide target sites (target sites might be enzymes that produce essential plant cell building blocks) so that herbicide binding is reduced, resulting in reduced control. As a result, the target pathway keeps working, and the plant grows normally after herbicide application. Other forms of resistance involve the overproduction of the target enzyme by the plant, mechanisms that either metabolize or sequester the herbicides, or changes in uptake of the herbicide. The main mechanisms are summarized in this table:

    Table 1: Mechanisms of herbicide resistance*

    Resistant ClassMechanism
    Target SiteTarget site mutation
    Increased gene copy number
    Enzyme over-expression
    Non Target-SiteEnhanced metabolism
    Differential uptake
    Differential redistribution
    Sequestration
    Delayed germination
    Rapid necrosis / defoliation

    *Source: Bo AB, Won OJ, Sin HT, Lee JJ, Park KW. 2017. Mechanisms of herbicide resistance in weeds. Korean Journal of Agricultural Science 44:001-015.

    The simple act of using a herbicide can select for resistance to that herbicide. While we can’t predict or prevent resistance entirely, we can slow its onset by reducing the frequency of herbicide use, for example by integrating cultural controls such as crop rotation, seeding rate, cultivar competitiveness, and other factors into our agricultural systems.

    A powerful option to slow resistance development is to reduce our reliance on a single mode of action, either by rotating modes of action in successive sprays, or, more importantly, by tank mixing multiple effective modes of action (MEMoA) whenever we make an application.

    Let’s not kid ourselves. The recent discovery of glyphosate (e.g. Roundup) -resistant wild oats in Australia, and glufosinate (e.g. Liberty) -resistant ryegrasses in several countries is sobering.  Relying more on these herbicides will only increase selection pressure.

    If we decide to use herbicides, we need to look at the situation from the perspective of delaying the onset of resistance. What we’re trying to do is buy some time, so that new strategies can be developed.

    How can spray application methods slow the onset of resistance?

    The use of herbicides will continue to select for resistance. The best we can hope to achieve within a herbicide system is to delay that eventuality.

    To better understand our options, we need to talk about a specific type of herbicide resistance called polygenic resistance. This refers to accumulation of additive genes of small effect over time, a process that is more efficient in plants that share genetic material among plants in a population, i.e., they outcross.

    Outcrossing plants receive genetic material from others, increasing their genetic diversity, and therefore their ability to adapt.

    In a field, a population of any specific weed may contain some individuals that have slightly greater tolerance to a herbicide than others. If we apply a slightly lower than label herbicide dose to those individuals, they might survive the application and eventually cross with other survivors and set seed. Their offspring may be as tolerant or even more tolerant than their parents. If this repeats itself over successive generations, the additive effects build until finally, low-level resistance becomes full-blown resistance and even label rate herbicides no longer work. This resistance isn’t a single gene mutation, it’s simply an accumulation of tolerance due to several genes which impact how much of the herbicide active ingredient reaches the target site.

    In a recent study at the University of Arkansas, susceptible Palmer amaranth (P. amaranth has both male and female plants and is therefore an obligate outcrosser) was treated with a range of dicamba doses to identify individuals that survived the higher doses. The researchers allowed the survivors to cross, and then grew out their seed, then repeating the procedure. After just three generations, the experiment produced individuals with a three-fold increase in LD50 (compare LD50 at P0 (111) to P3 (309) in Table 2). Recall that LD50 refers to the dose required to observe 50% of the full effect.

    Table 2: Dicamba doses (g ae/ha) required for 50% (LD50) and 90% (LD90) control of Palmer amaranth populations selected following sublethal doses of dicamba in the greenhouse.*

    HerbicideSelected PopulationLD50LD90
    DicambaP0111213
    P1198482
    P2221546
    P3309838

    *Source: Tehranchian, P. et al.  2017.  Recurrent sublethal-dose selection for reduced susceptibility of Palmer amaranth (Amaranthus palmeri) to dicamba. Weed Science 2017 65:206–212.

    The lessons are three-fold:

    • Herbicide resistance cannot be prevented if herbicides are applied.
    • To prevent polygenic resistance, we need to apply the full label rate and avoid repeated sublethal doses, so that all weeds are killed;
    •  We need to apply Multiple Effective Modes of Action (MEMoA) whenever possible so that when one fails, the others have its back;

    How can this be achieved?

    1. Prevent application practices that result in less effective dosing. Larger weeds, or weeds growing in difficult environmental conditions, may require higher herbicide doses. Early application is helpful because small weeds are easier to control. In addition, crop canopy shading at later staging leads to dose reduction and increases dose variability. Spraying under windy conditions also reduces dose, and can increase deposit variability. For some herbicides such as glyphosate or diquat, the dust generated by wind or fast travel speeds can reduce effectiveness.
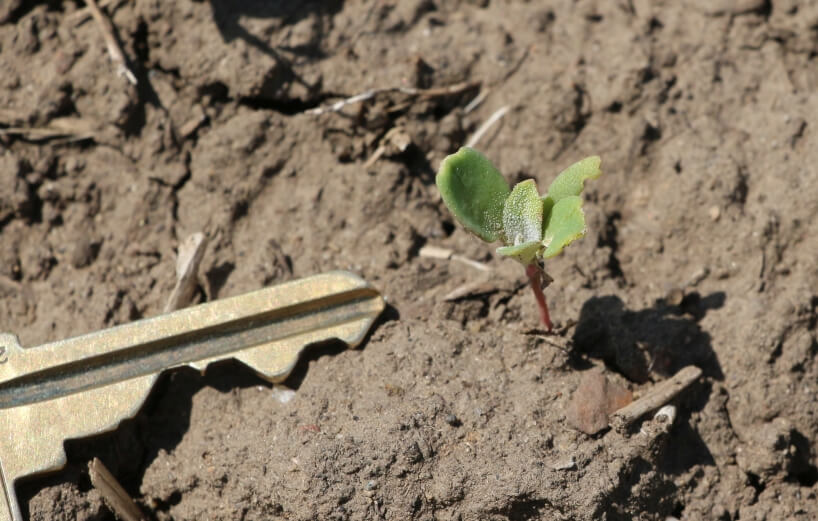
    Figure 2: Smaller, exposed weeds require lower doses to control
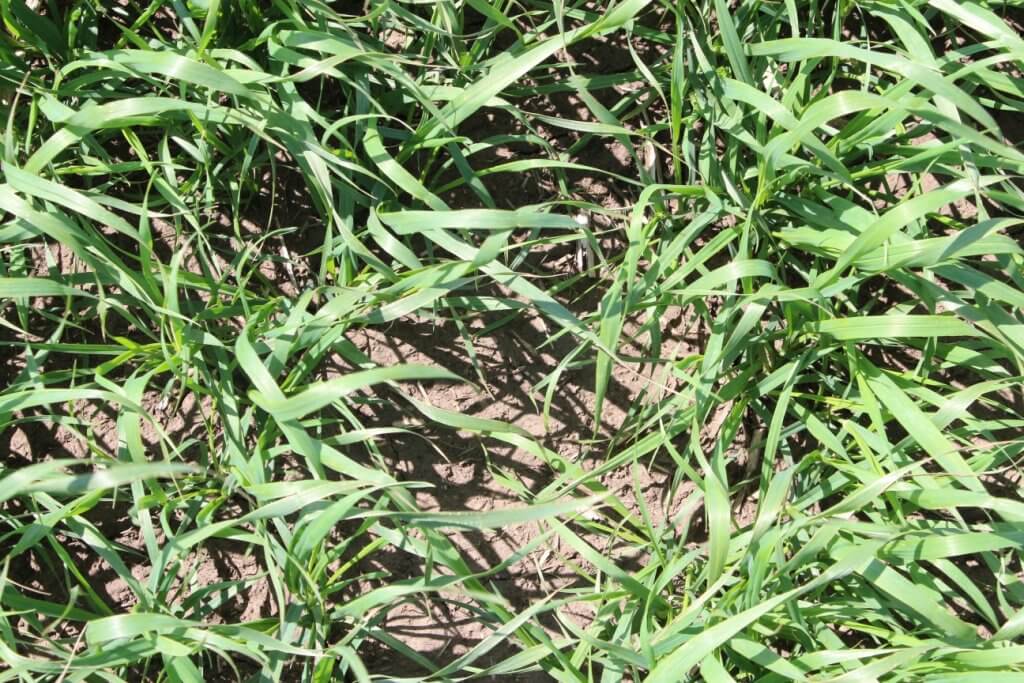
    Figure 3: Crop canopies provide valuable competition to help suppress weeds, but they can also intercept spray, reducing the dose received by weeds.
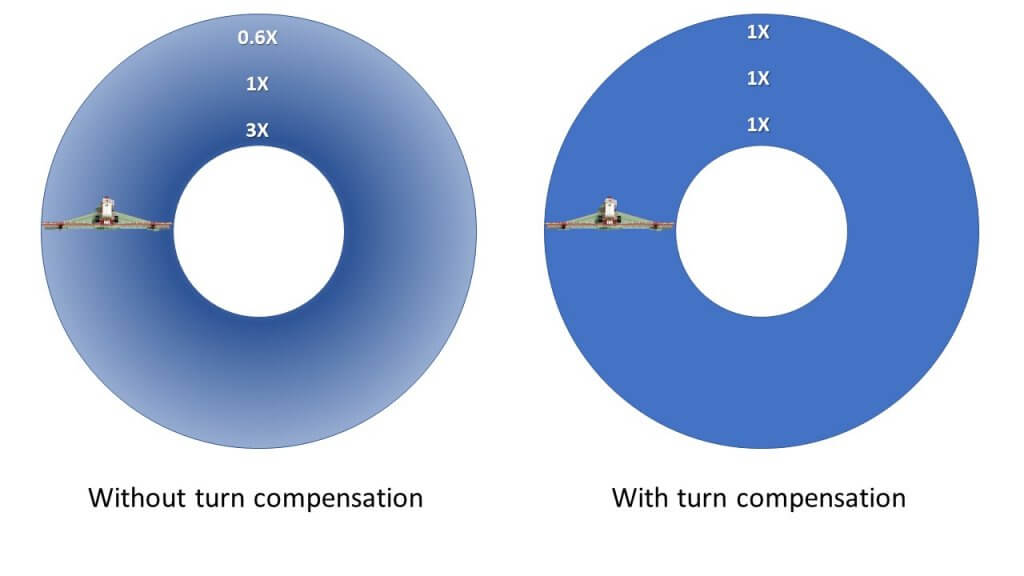
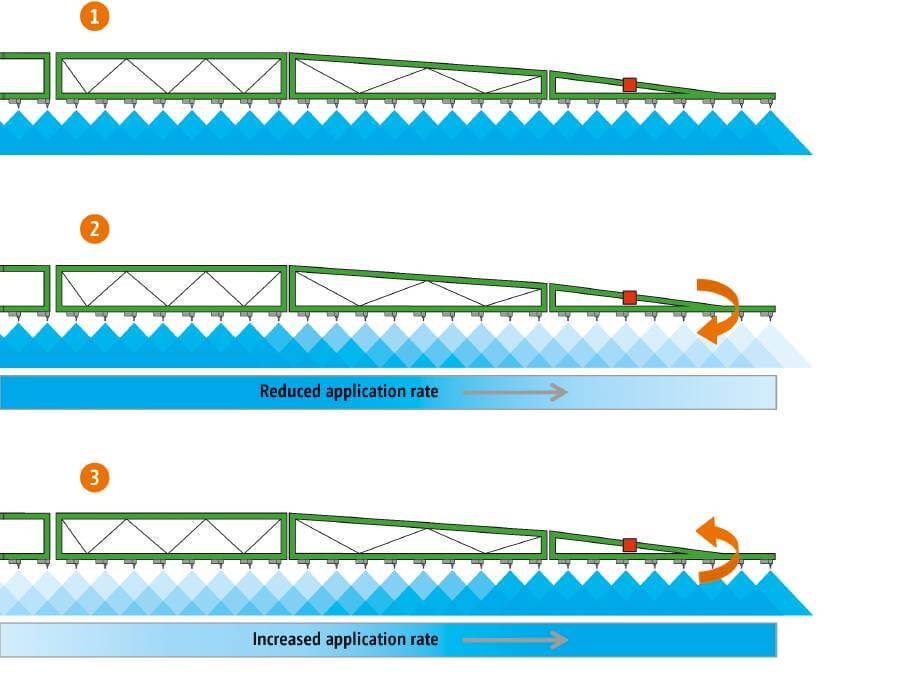
    • Get Pulse Width Modulation (PWM) with turn compensation. If your sprayer makes the same turn around the same feature year after year, then the outer boom region will under-dose the same part of the field over and over. This is the breeding ground for polygenic resistance. Look for this in field corners, around water bodies or tree bluffs, rock piles, etc.
    Figure 4: PWM correction of under-dosing during a turn
    • Prevent boom sway and yaw. Boom movements result in uneven application, which results in lower control. Pull-type sprayers with supporting wheels are best, but these are becoming rare. Suspended boom performance depends on the manufacturer and the levelling technology they use.  However, boom movement is usually more consistent with slower travel speeds.
    Figure 5: Boom yaw causing over- and under-application (Source: Farmonline.com.au)
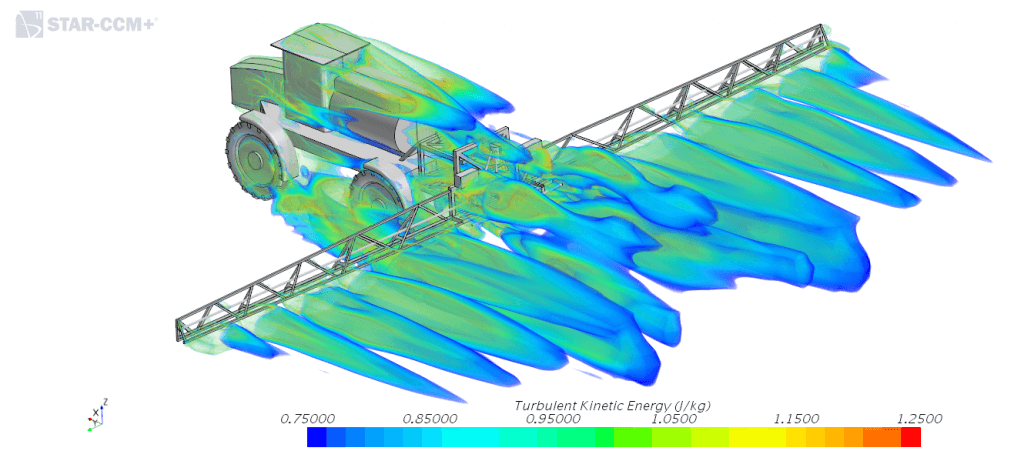
    • Minimize air turbulence. Large sprayers, and those moving at fast speeds, create aerodynamic turbulence that can displace spray. The main problem spots are wheels, in whose tracks measurably less spray is deposited.  The exact dynamics of turbulence is still unknown, but we do know that its magnitude can be reduced with slower travel speeds.
    Figure 6: Turbulence due to sprayer speed (Source: Dr. Hubert Landry, PAMI)
    • Consider spot spraying. The use of optical spot spray equipment, such as the new WEEDit Quadro, or Trimble’s WeedSeeker II, save product during burnoff or post-harvest. These savings can make the use of more elaborate, expensive tank mixes containing multiple effective modes of action, affordable.
    Figure 7: Optical Spot Spraying (WEEDit Quadro) (Source: WEED-it.com)
    • Avoid spray drift. Field margins that harbour weeds rarely receive a full dose of herbicide. Exposing these weeds to spray drift won’t kill them. But it will, over time, select for weeds that are more able to tolerate the herbicide.

    Implications

    Aside from specific technology such as PWM, improved booms, or a spot sprayer, the most effective fix for variable application doses is slower travel speed.

    While this may seem problematic when timing is critical and greater productivity is required, there is a way to drive more slowly and still get more done. We simply need to look at productivity differently.

    We tend to equate productivity with speed. Travel speed. But a spray day is filled with many hours of non-spray time – filling, cleaning, transporting, repairing, fueling, record-keeping, etc. How much time is lost to these activities depends on the operation, but for everyone, it’s useful to do time accounting.

    Record how a spray day’s time is spent. Pay attention to activities during which you can save time without much expense.

    ActionActual TimeTarget Time
    Fuelling, lubing  
    Loading jugs and totes  
    Checking label (rates, rainfastness…)  
    Filling tender tanks  
    Loading sprayer (in yard)  
    Transport to field  
    Entering field data into monitor  
    Checking, recording weather  
    Checking for pest, stage  
    Changing nozzles  
    Spraying load  
    Unplugging / replacing nozzles  
    Replacing nozzle body  
    Making turn  
    Filling sprayer  
    Getting sprayer unstuck  
    Driving to tender truck  
    Waiting for tender truck  
    Spraying out tank remainder  
    Cleaning tank  
    Cleaning filters  
    Flushing boom ends  
    Loading sprayer (in field)  
    TOTAL

    On any given spray day, less time spent filling, or transporting, is credited to spray time.  Our analysis shows that time lost to driving slower can more than be made up with these changes. The productivity gain gives more opportunity to spray under more ideal conditions that save yield and also ensure more uniform application.

    Using productivity analysis, spraying can become more uniform and help delay the onset of resistance.

    Note: The assistance of Dr. Charles Geddes, Research Scientist at AAFC Lethbridge, in drafting this article is appreciated.

  • Reading Airblast Nozzle Tables

    Reading Airblast Nozzle Tables

    Airblast operators should know how to read a nozzle table. They are found on dealer and manufacturer websites as well as in their catalogs. Table layout varies with brand, but they all relate a nozzle’s flow rate to operating pressure. The better tables also provide the spray angle and the median droplet size (i.e. spray quality).

    Operators need this information to complete calibration calculations (aka sprayer math) and when deciding how to distribute nozzle rates, angles and spray quality along a boom relative to the target canopy.

    This article focusses on hollow and full cone nozzles, which are commonly found on airblast sprayers. For more information on flat fan nozzle tables (e.g. for banded under-canopy or, vertical booms or broadcast applications from horizontal booms), refer to this article.

    Reading the table

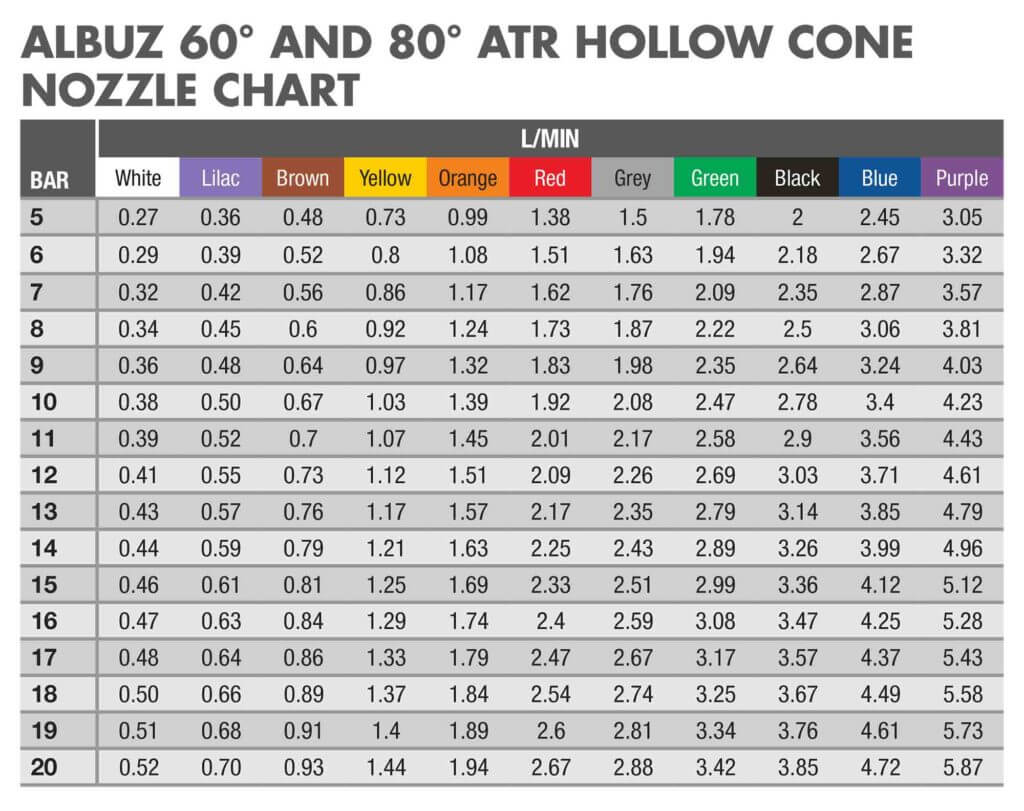
    Let’s use the table below to determine a nozzle’s flow rate for a given pressure. First, find the nozzle colour in the top row. Second, find the operating pressure in the left-most column. Finally, the flow rate is indicated in the cell at the intersection between the row and column. For example, a red ATR hollow cone nozzle operated at 9 bar will emit a flow rate of 1.83 L/min.

    Perhaps you want to determine which nozzle will give a specific flow rate. Find the rate in the body of the table and trace the column and row to determine which nozzle/pressure combination will achieve it. For example, if we want a flow rate of ~1.00 L/min, we can use a Yellow at 10 bar or an Orange at 5 bar. Yellow is the better choice since the Orange would have to be operated at the bottom of its pressure range (more on that later).
    This Albuz nozzle table for 60 and 80 degree molded hollow cones gives flow rates in litres per minute.

    Note: Do not to confuse TeeJet’s ISO-standardized TXA or TXB nozzles with TXVK or ConeJet nozzles. They may be the same colour, but their outputs are very different.

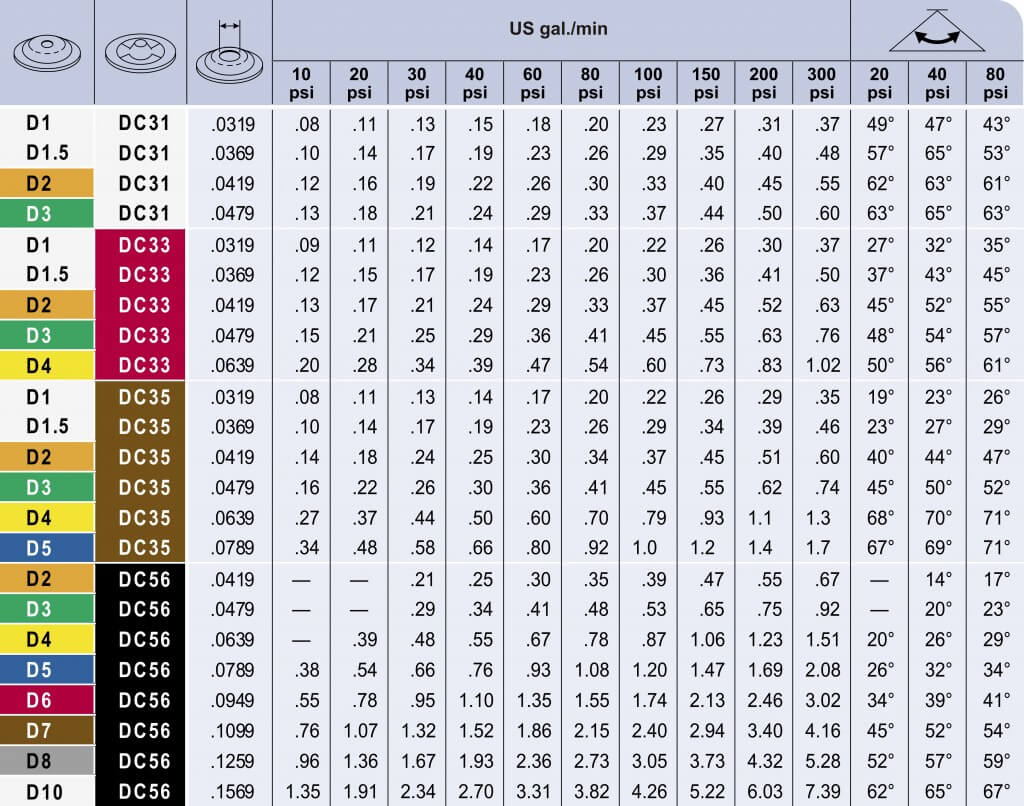
    Higher flow rates or full cone patterns can be achieved using combination disc and core (or disc and whirl) nozzles. Depending on the manufacturer, the disc plate is defined by it’s diameter in 64th’s of an inch. The core or whirl plate might be described by the number of holes (e.g. 2-hole, 3-hole, etc.), or some other manufacturer-specific nomenclature (e.g. 45’s, 25’s etc.).

    Using the table below, we see that a D2 disc and a DC35 core will emit 0.34 gpm at 80 psi. By continuing along the row, we see that the spray angle for this combination will be 47 degrees at that pressure.

    This nozzle Table for TeeJet disc & cores is fairly typical of any manufacturer’s nozzle table. Find the disc & core combination in the two left-hand columns, and follow the row until it intersects your operating pressure to determine the rate in US gallons per minute. Or, if you know your ideal rate already, you can find the best disc & core combination for a given pressure to achieve that rate.
    This TeeJet nozzle table gives the flow rate for a disc (D#) and core (DC#) full cone combination nozzles in US gallons per minute.

    Pressure problems

    Do not choose a nozzle at the extreme of their flow or pressure range. A trailed PTO sprayer will experience pressure changes from driving on hills, or rate controllers will create pressure changes in response to changes in travel speed. In either situation, coverage will be compromised if the nozzle is pushed outside its optimal range.

    Note: Use pressure to achieve small changes in flow, but for more extreme changes, switch nozzles. Remember, it takes 4x the pressure to get 2x the flow. Stated differently, it takes 1/4 the pressure to get 1/2 the flow.

    You may not find a nozzle/pressure combination that emits the rate you are looking for. When your desired rate or pressure falls between the figures listed in the table, you can take the average. When nozzling an entire boom with different nozzle rates, get each position as close as you can to achieve the overall boom rate for a given pressure. It’s always a compromise – don’t stress over it.

    The author looking up nozzle rates during a spring calibration. The operator was running at 190 psi, but the catalogue only listed 180 psi and 200 psi. When span is only 20 psi, it’s fairly safe to approximate the output. When the table only lists in 50 psi increments, it is more difficult to determine the rate without testing the output. This issue usually occurs at pressures above 200 psi, and that’s very high for most horticultural operations. Consider using a lower operating pressure, if possible.
    Looking up nozzle rates during a spring calibration. The operator was running at 190 psi, but the catalogue only listed 180 psi and 200 psi. When the increment is only 20 psi, it’s reasonable to approximate the output. When the span is 50 psi increments, it is more difficult to determine the rate without testing the output (it’s not a linear relationship). This issue usually occurs at pressures above 200 psi, and that’s far too high for cane, bush, vine and high-density orchards. In these situations, consider using a lower operating pressure.

    Different nozzles, same rate

    Different disc core combinations, or molded nozzles at different pressures, can produce similar flow rates. However, their spray quality and spray cone angles can be very different (see last three columns in the TeeJet table above).

    The angle of the spray cone can have a big impact on spray coverage. When the target is far away from the corresponding nozzle (e.g. the tops of nut trees), or the canopy is very, very dense (e.g. citrus canopies), consider tight-angled full cones under high pressure. This is inefficient and can give variable coverage, but it is sometimes the only option in extreme situations.

    Two hollow cone nozzles on top and five full cone nozzles below. Note the lack of spray overlap with the full cones for the first few meters. This would be a concern if the target were closer to the sprayer, such as grape or berry. Also note that the top two nozzles should not be on; their spray will likely not reach the intended target.
    Oops! Two hollow cone nozzles on top and five full cone nozzles below is the exact opposite of how things should be. Note the lack of spray overlap with the full cones for the first few meters. Spray from the top two positions will likely not reach the intended target.

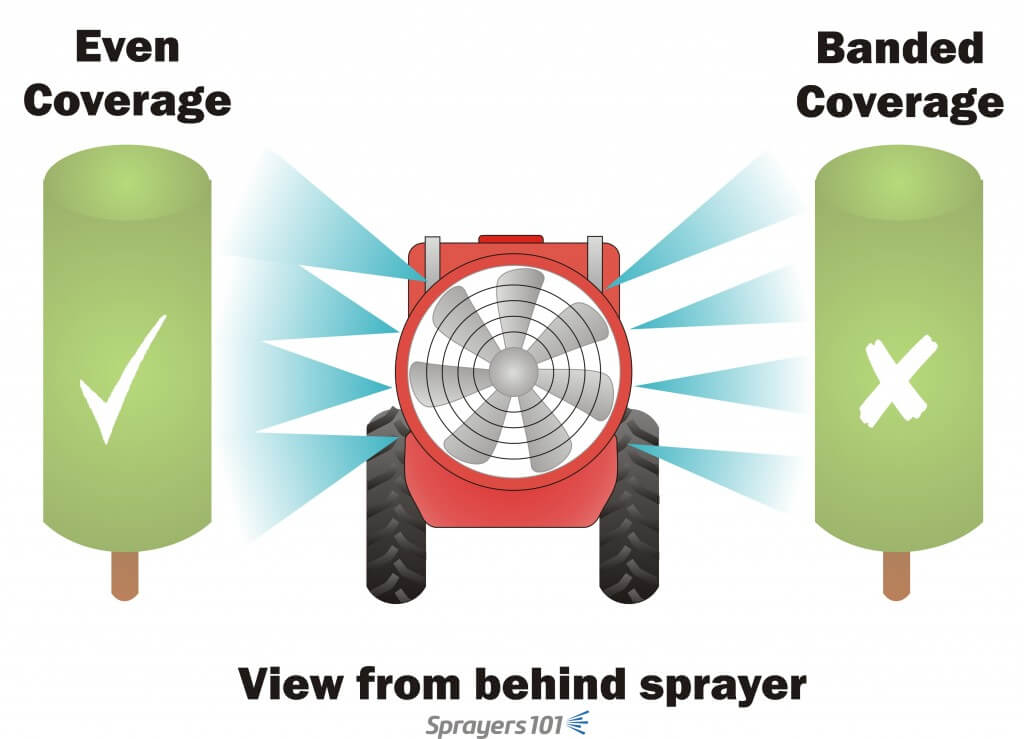
    When the target is very close to the sprayer, full cones do not overlap and create undesirable striping or banded coverage. Creating a full, overlapping spray swath that spans the entire canopy is a function of nozzle spacing, distance-to-target, and sprayer air-settings. It can also be affected by humidity, wind speed and wind direction at the time of spraying.

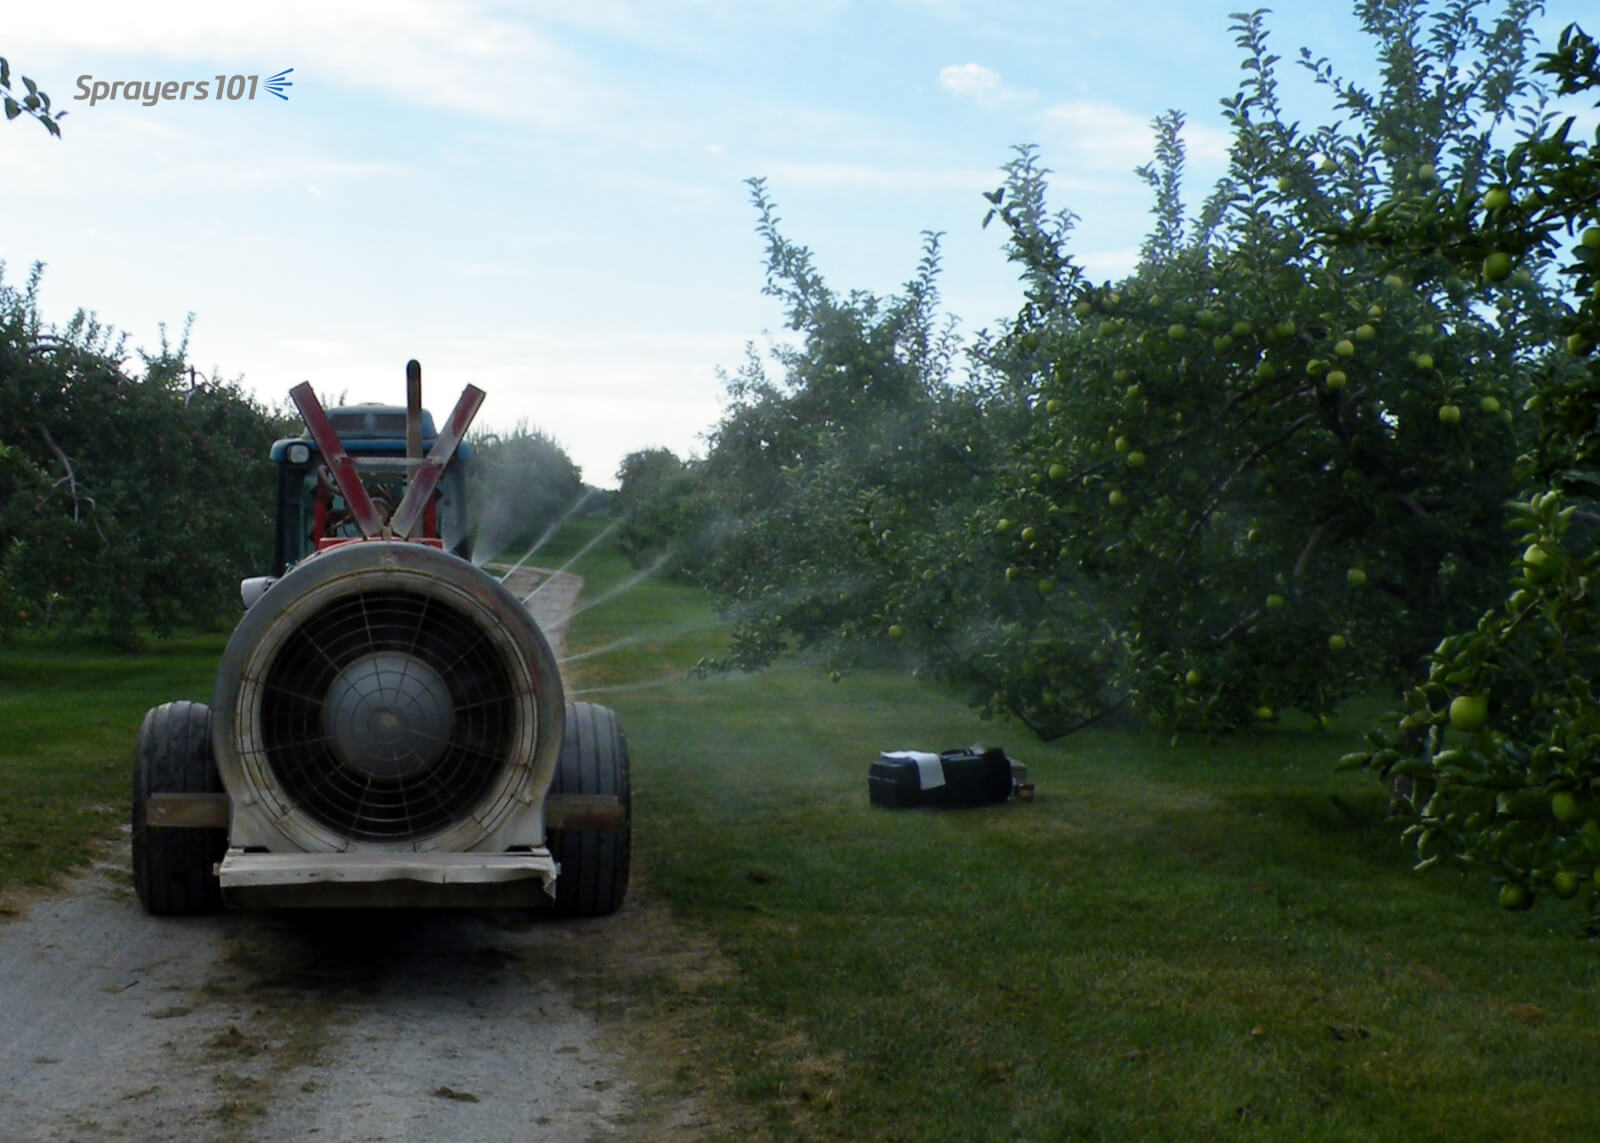
    Confirm your settings by parking the sprayer in the alley between crops. With the air on, spray clean water while a partner stands a safe distance behind the sprayer to look for gaps in the swath. The partner will see things the operator’s shoulder check will not reveal.

    Shoulder checks may not show you what’s really happening. Have someone stand behind the sprayer while spraying clean water to see the nozzle spray overlaps sufficiently to span the entire canopy.
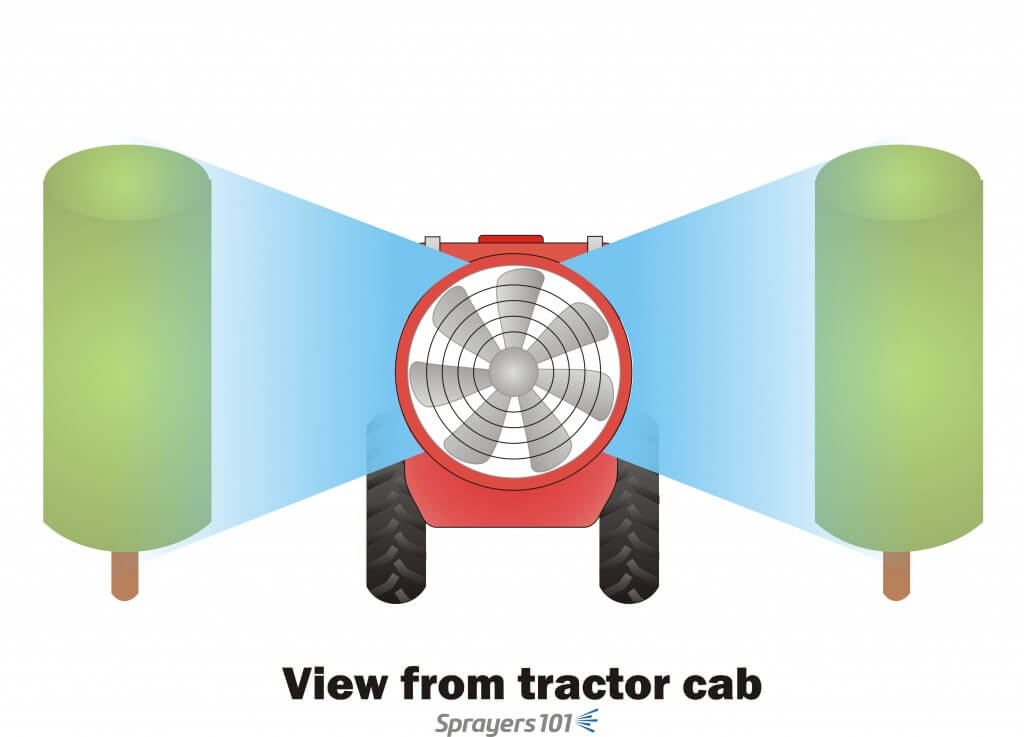
    Here’s what the operator sees. But, shoulder checks may not show you what’s really happening. Have someone stand a safe distance behind the sprayer while spraying clean water to see the nozzle spray overlaps sufficiently to span the entire canopy.
    Shoulder checks may not show you what’s really happening. Have someone stand behind the sprayer while spraying clean water to see the nozzle spray overlaps sufficiently to span the entire canopy.
    Here’s what the partner standing behind the sprayer sees. Take a picture with a smartphone to show the operator.

    Nozzle tables can be wrong

    Sometimes nozzles do not perform per the nozzle table. We have discovered errors in published tables, worldwide. Here are the big three:

    • Conversion errors. Manufacturers publish catalogs in Metric and in US Imperial, but we have found many errors in the conversions.
    • Spray angle errors. When nozzles are operated at the extremes of their pressure ranges, spray angles deviate from those listed in the tables.
    • Flow rate errors. When tables are not updated to reflect changes in nozzle design, or the manufacturing process, actual flow rates deviate from those listed in the tables.

    Perhaps it’s not the table, but the nozzle itself. Most nozzle manufacturers accept a flow variability up to +/- 2.5% for new nozzles, but we have seen higher. It depends how they are made (machined, stamped, printed) and the material they are made of.

    Validate flow rate and pattern

    When errors are discovered and reported, the manufacturers can be slow to issue corrections and the errors will persist in old tables. Yes, even apps (which are often based on tables) can be wrong. So, predicted flow rates can prove unreliable. This is why it is important to double check by observing nozzle overlap and validating flow rate when you replace nozzles – even when they are brand new.

    Thanks to Dr. David Manktelow (Applied Research and Technologies, Ltd., NZ) for input into this article.