Category: Boom Sprayers

Main category for sprayers with horizontal booms

  • Diluting 20,000-Fold with a 30 Gallon Remaining Volume in a 1,200 Gallon Tank

    Diluting 20,000-Fold with a 30 Gallon Remaining Volume in a 1,200 Gallon Tank

    (This short article is an addendum to this article)

    Our goal in this example is to dilute by a factor of 20,000.

    The maximum amount of dilution possible with a 1,200 gallon tank and a 30 gallon remainder is 1200/30=40.

    The formulae:

    Dilution per Rinse = final dilution ^(1/# of rinses)

    Rinse Volume = (dilution per rinse * remaining volume) – remaining volume

    • One rinse diluting by 20,000 – impossible with a 1,200 gallon tank (max achievable is 40-fold);
    • Two sequential rinses, each diluting by a factor of 20,000^(1/2) = 141. Also impossible with a 1,200 gallon tank;
    • Three sequential rinses, each diluting by a factor of 20,000^(1/3) = 27. A volume of 780 gallons can do this  (27*30)-30=780 gallons. For three rinses, the total volume is 2,340 gallons.
    • Four sequential rinses, each diluting by a factor of 20,000^(1/4) = 12. A volume of 330 gallons can do this, for a total volume of 1,320 gallons;
    • Five sequential rinses, each diluting by a factor of 20,000^(1/5) = 7. A volume of 180 gallons can do this, for a total volume of 900 gallons;
    • Six sequential rinses, each diluting by a factor of 20,000^(1/6) = 5.2. A volume of 126 gallons can do this, for a total volume of 757 gallons.

    Second, let’s assume the operator is prepared to prime the boom where it doesn’t harm soybeans. Now the first new product tank takes care of the last dilution, lowering the cleanout dilution requirement by 1,200/30 = a factor of 40. Now the cleanout dilution requirement is only 20,000/40 = 500.

    • One 1,200 gallon tank rinse can only achieve 40-fold dilution.
    • Two rinses, each diluting by 500^(1/2) = 22. Rinse volumes of 640 gallons are sufficient, for a total of 1,280 gallons.
    • Three sequential rinses, each diluting by a factor of 500^(1/3) = 7.9. A volume of 210 gallons can do this, for a total volume of 630 gallons;
    • Four sequential rinses, each diluting by a factor of 500^(1/4) = 4.7. A volume of 112 gallons can do this, for a total volume of 448 gallons.
  • How Clean is Clean?

    How Clean is Clean?

    One of the more perplexing questions in tank cleanout is knowing when the cleaning process is good enough to prevent harm. This question is especially relevant to producers that grow canola and use Group 2 herbicide products, or grow soybeans and use dicamba on some of their area. In both of these examples, crops can be extremely sensitive to very small residues.

    When does an applicator know that the cleaning job was good enough? In about two weeks! There is no easy way to tell, except to be precautionary.

    A bit of math can help put us in the ballpark. First, we need to know the tolerance of a crop to the herbicide, preferably expressed as a proportion of the tank mix to be cleaned. Let’s use dicamba as an example. It’s been reported that non-dicamba tolerant soybeans can show leaf-cupping symptoms from dicamba at rates as low as 1/20,000 of the label rate.

    Recall that sprayer cleanout is really two separate processes that we’ve written about here, here, and here. The first is dilution of the remaining volume in the system. The second is decontaminating specific sprayer components (filters, boom ends, hoses). We’ll focus on dilution in this article.

    If you’re diluting, the second piece of information you need is how much liquid is left in the sprayer when you start cleaning. All sprayers have a certain amount of liquid left in the tank and associated plumbing after the tank is empty. The sump, the suction line feeding the pump, and the lines returning to the tank via agitation or sparge are most common. Even when the pump no longer draws liquid, those lines retain some volume of product. This volume can’t be pushed out to the boom, most of it goes back to the tank.

    The volume of this “remaining liquid” is likely somewhere between three and thirty US gallons.

    The remainder volume depends on the sprayer, and also how the tank is emptied. Some applicators simply spray until the solution pump pressure drops, others choose to drain the remaining liquid from a sump valve. When draining, product should be captured in pails rather than allowing it on the ground where it will harm the soil and possibly make its way into runoff.

    It’s always preferable to spray the tank empty in a field.

    As we’ll see below, a low remaining volume greatly improves the efficiency of the dilution process. It’s a sprayer feature that should be considered at purchase.

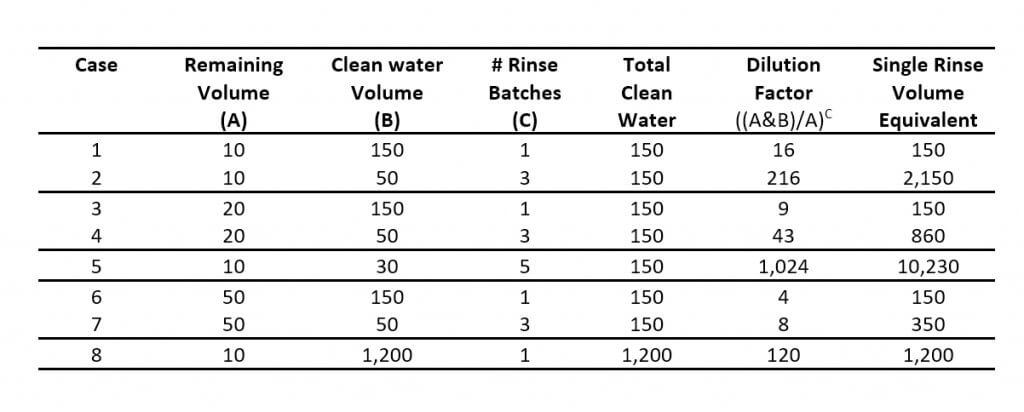
    The table below has some sample calculations. Note that the paired cases (1&2, 3&4, 6&7) all use the same total water volume, but compare a single vs triple rinse of three different remaining volumes.

    Comparing Case 1 to Case 3 or Case 6, (remaining volumes of 10, 20, and 50, respectively), it’s clear that minimizing the remaining volume is important.

    It’s also striking that the same amount of clean water, subdivided into three smaller repeat batches (Case 2, 4 and 7), is much more powerful than using single batches with the same total clean water amounts.

    Reducing the size of each batch even further and increasing the number of batches (Case 5) approaches what a properly executed continuous rinse can do.

    Is it necessary to dilute to the level that’s safe for the next crop? Not always. The next product in the tank acts to dilute the remainder once again, possibly by a factor of 100, depending on the remaining volume and the tank size (Case 8). The material in the boom, however, won’t be diluted by this additional volume, and therefore may harm the crop unless it is first sprayed out elsewhere, especially when section ends are not drained and rinsed.

    This is where a recirculating boom is valuable, providing an opportunity to charge the boom without spraying. The penalty is that the boom volume is then returned to the tank in the process, increasing the amount that needs to be diluted.

    Let’s return to the dicamba example with a 20,000-fold dilution requirement and a 1,200 gallon tank. We’ll consider two examples. In the first, the operator wants to prime the boom in the soybean field without any harm to the dicamba-susceptible beans. A 20,000-fold dilution is needed.

    We’ve looked at five options that each assume a remaining volume of 10 gallons. Note that our goal is the same – dilute by a factor of 20,000.

    The formulae:

    Dilution per Rinse = final dilution ^(1/# of rinses)

    Rinse Volume = (dilution per rinse * remaining volume) – remaining volume

    The maximum amount of dilution possible with a 1,200 gallon tank and a 10 gallon remainder is 120 (see Row 8, Table above).

    • One rinse diluting by 20,000 – impossible with a 1,200 gallon tank (max achievable is 120-fold);
    • Two sequential rinses each diluting by a factor of 20,000^(1/2) = 141. Also impossible with a 1,200 gallon tank;
    • Three sequential rinses, each diluting by a factor of 20,000^(1/3) = 27. A volume of 260 gallons can do this  (27*10)-10=260 gallons. For three rinses, the total volume is 780 gallons.
    • Four sequential rinses, each diluting by a factor of 20,000^(1/4) = 12. A volume of 110 gallons can do this, for a total volume of 440 gallons;
    • Five sequential rinses, each diluting by a factor of 20,000^(1/5) = 7. A volume of 60 gallons can do this, for a total volume of 300 gallons.

    The first two examples don’t work because the tank isn’t big enough. But the three remaining examples all work equally well, they just consume different amounts of clean water.

    If that doesn’t seem like a lot of work, then repeat this calculation with a 30 gallon remainder volume, common on many sprayers. Short on time? We did it for you here.

    Second, let’s assume the operator is prepared to prime the boom where it doesn’t harm soybeans. Now the first new product tank takes care of the last dilution, lowering the cleanout dilution requirement by 1,200/10 = a factor of 120. Now the cleanout dilution requirement is only 20,000/120 = 166.

    • One 1,200 gallon tank rinse can only achieve 120-fold dilution.
    • Two rinses, each diluting by 166^(1/2) = 13. Rinse volumes of 120 gallons are sufficient, for a total of 240 gallons.
    • Three sequential rinses, each diluting by a factor of 166^(1/3) = 6. A volume of 50 gallons can do this, for a total volume of 150 gallons.

    The math is simple, and can be done using the formula in the first table, or this app:

    The hard part is knowing what the remaining volume is. It would be very useful for a manufacturer to provide this information.

    In the meantime, you can estimate on your own. Add water with surfactant to your tank, and spray it empty. While spraying, turn the agitation on and off to fill and activate the sparge, if equipped. Once the tank is empty and the spray pressure drops, stop and drain the sump into pails. Ensure that the pump suction line and the pressure line up to and including the agitation and sparge lines also drain. Disconnect these if necessary. If there is a filter housing in this circuit, remove it as well.  Avoid collecting liquid from the pressure line beyond where the the agitation or sparge split off, as this will be pushed out to the boom.

    An alternative is to estimate the length of hose in this circuit, using the following table as a guide:

    And remember, diluting the remaining liquid is only one part of a cleaning process.

  • Testing the Effectiveness of Sprayer Rinsing Methods using Dicamba

    Testing the Effectiveness of Sprayer Rinsing Methods using Dicamba

    This work was performed with Mike Cowbrough, Weed Management Specialist (Field Crops) with OMAFA.

    The unprecedented number of dicamba drift complaints in the United States has proven to be a polarizing issue in the agriculture community. The debate continues as to the relative influence of contributing factors.

    The sensitivity of soybeans to trace amounts of dicamba has been known for more than 50 years (Wax et al. 1969). Research has shown that less than 0.2% of the highest recommended use rate can cause a 10% yield loss in non dicamba-tolerant soybean (Robinson et al., 2013). Many horticulture and ornamental crops are equally sensitive to low doses of dicamba.

    Relative volumes of Callisto (33% field rate), Roundup (6% field rate) and Xtend (0.16% field rate) known to cause 10% yield loss in conventional soybean.

    The inherent volatility of the active, and its subsequent potential for off-target movement, is also well known. Research has shown that XtendiMax, Engenia and FeXapan are far less volatile than their predecessors. However, research has also shown that there is some degree of volatilization for 36 hours following application, peaking 6-12 hours after treatment (Mueler, 2017). Studies by Jacobson et al. (2014) showed dicamba present in the air 60-72 hours after treatment.

    While sensitivity and volatility are suspected of being the primary culprits, there are other factors that contributed to the estimated 3.6 million acres of soybean reported damaged in the United States in 2017 (Bradley, 2017):

    • inappropriate sprayer set-up,
    • physical drift,
    • the use of older dicamba chemistries, and
    • contamination of filling or spray equipment (aka carry-over)

    The Experiment

    In 2017, we decided to learn more about sprayer contamination. The following is a summary of the labelled cleaning protocol. It’s noted that rinsate disposal must comply with local regulations:

    1. Drain sprayer immediately after use.
    2. Flush all inner surfaces with water.
    3. Fill sprayer with an ammonia-based solution and soak overnight.
    4. Concurrently, remove and soak strainers, screens and nozzles.
    5. Circulate solution for 15 minutes and flush through the boom for one minute.
    6. Drain sprayer, replace strainers, screens and nozzles, and flush once more with water.

    This thorough protocol is not unique to dicamba, and historically has not been followed by sprayer operators. Instead, operators choose cleaning methods that reflect the risk of damage and the time and effort required to clean the sprayer. The majority flush with water, may or may not perform serial rinses and may or may not address dead end plumbing. Where possible, operators schedule sprays that present the least potential for carry-over damage (e.g. moving into corn following soybean). There is no way to know for certain that the sprayer is sufficiently cleaned.

    Sprayer

    Our research sprayer had a tank capacity of 60 L and was calibrated to deliver a spray volume of 15 gallons per acre. RoundUp Xtend was added at the highest labeled rate of 2 L/acre (consisting of glyphosate at 1,200 gae/ha and dicamba at 600 gae/ha). We reserved the solution for reuse by collecting spray in jugs.

    Rinses

    Serial rinse

    On a typical sprayer, the capacity of the clean water tank is ~10% that of the product tank. To perform a triple rinse, the operator introduces 1/3 of that volume to the product tank through a washdown nozzle, circulates for 10 minutes, and then sprays the product tank empty. This is repeated two more times to empty the clean water tank.

    Our intent was to scale the process in the same ratio using the research sprayer. That would mean using a 6 L volume of clean water to represent 10% of the 60 L product tank. It follows that we would have to perform three, 2 L rinses.

    However, that was insufficient volume to engage the pump and still provide enough rinsate to spray in our trials. We calculated the minimum required volume to be 8 L per rinse. We circulated for 5 minutes through a washdown nozzle. Following our third rinse, we noted that the rinsate still smelled of dicamba, and elected to run a fourth 8 L rinse. Rinsate was collected from multiple nozzles spaced evenly along the boom.

    We then opened the suction filter and the two line filters and poured the remaining solution into a bucket. We topped the volume up to 8 L with clean water and scrubbed the filters with a brush.

    Continuous rinse

    The continuous rinse process continually introduces clean water via the washdown nozzle via a dedicated pump. Concurrently, the product pump sprays from the nozzles and circulates via the agitation/bypass line. We used 32 L of clean water (a volume equivalent to that used in the serial rinse) and collected rinsate in four, 8 L volumes.

    Rinsate was collected from multiple nozzles spaced evenly along the boom. We then opened the suction filter and the two line filters and poured the remaining solution into a bucket. We topped the volume up to 8 L with clean water and scrubbed the filters with a brush.

    Continuous rinse using 1% ammonia solution

    We followed the continuous rinse process, as previously described, in order to collect the filter residue.

    Possible artifacts

    The limitations involved in scaling down introduce two potential artifacts to this experiment. First, the ratio of clean water to product volume is high compared to typical practices for both rinses. We estimate the volume remaining in the sprayer when “empty” did not exceed 4 L.

    Second, continuous rinsing was sampled in batches, which means the fourth and final volume collected represents an average of the active remaining in the system rather than the final concentration. As such, it would likely be more concentrated than what truly remained in the sprayer.

    Application

    Rinsate was applied to glyphosate tolerant soybean on 30” rows. Rinsate was applied at 20 gpa using a handboom with AIXR 11002 nozzles. Ontario locations were Ridgetown, Elora, Winchester and Woodstock.

    Results

    Crop Injury

    Regardless of rinse procedure, crop injury was greatest after the first rinse cycle and diminished after each subsequent cycle (Table 1). The first half of the continuous rinse procedure caused greater injury than the serial rinse, but injury was equivalent for the final half. Crop injury was less when rinsate was applied to soybeans at an early vegetative stage (V2) compared to when rinsate was applied to soybeans at later vegetative stages (V5-V6) or the early reproductive stage (R1).

    Table 1: Visual Injury (%) of soybean 14 days after the application of rinsate that was collected from two different sprayer cleanout procedures.

    TreatmentEloraRidgetownWinchesterWoodstock
    % Visual Injury at 14 days after application
    Crop stage at applicationV5V2V6R1
    Weed-Free Control0000
    RU Xtend100100100100
    Serial Rinse # 110075100100
    Continuous Rinse # 1 (25% water)10095100100
    Serial Rinse # 275659090
    Continuous Rinse # 2 (50% water)85709595
    Serial Rinse # 355506075
    Continuous Rinse  # 3 (75% water)55506075
    Serial Rinse # 425102535
    Continuous Rinse # 4 (100% water)25102535
    Filters – Serial Rinse15301025
    Filters – Continuous Rinse15301025
    Filters – Continuous with 1% ammonia25452035

    We were surprised to observe dicamba injury even in the final stages of both rinse procedures. This reinforces how sensitive soybeans are to low doses of dicamba and demonstrates the importance of following the labelled water – ammonia – water sequence.

    When comparing damage from filter residue (following a continuous rinse) the rinsate extracted using a 1% ammonia solution was more injurious than rinsate from plain water. Cundiff et al. (2017) found no difference between the use of water or water-and-ammonia when cleaning out a sprayer. We speculate that the ammonia was more effective at removing dicamba from the sprayer, or it increased the residue’s potency.

    Soybean yield

    Yield losses appeared to mirror visual injury; as dicamba injury decreased, so did soybean yield loss. Yield losses were observed following application of all rinsate treatments, which is understandable given that dicamba injury also occurred following the application of all rinsate treatments.

    Yield losses were greater in the first half of the continuous rinse protocol, but were par with the serial rinse for the second half (Table 2). Yield losses were observed following the application of rinsate collected from filters, demonstrating the importance of following a thorough sprayer decontamination that addresses dead-end plumbing, filters and nozzles.

    Table 2: Yield (% of weed-free control) of soybean following the application of rinsate that was collected from two different sprayer cleanout procedures.

    TreatmentEloraRidgetownWinchesterAverage
    Yield (% of weed-free control)
    Crop Stage at applicationV5V2V6V2-V6
    Weed-Free Control100100100100
    RU Xtend0000
    Serial Rinse # 1044115
    Continuous Rinse # 1 (25% water)01304
    Serial Rinse # 233651036
    Continuous Rinse # 2 (50% water)2261328
    Serial Rinse # 374896676
    Continuous Rinse  # 3 (75% water)72895776
    Serial Rinse # 486968689
    Continuous Rinse # 4 (100% water)86978289
    Filters – Serial Rinse939610096
    Filters – Continuous Rinse87979593
    Filters – Continuous with 1% ammonia79859285

    Other observations

    1- Dicamba injury delayed soybean maturity and date of harvest by over 14 days at the Elora site. Delayed maturity was observed at the Winchester locations as well.

    2- Heavy rainfall shortly after the application of rinsate at the Winchester location caused water ponding. Since dicamba is very water soluble, crop injury and yield loss was higher in areas in the trial where water ponded after application.

    3- Dicamba injury appeared to accentuate other stress symptoms at the Elora site, specifically potash deficiency. In the absence of dicamba injury, soybean plants did not exhibit potash deficiency symptoms.

    Take Home

    • Continuous rinsing was as effective as four low-volume rinses.
    • Plots sprayed with the cleanest water rinsate (both protocols) averaged 11% lower yields than unsprayed plots.
    • Filter rinsate (following continuous rinse with water) resulted in an average 7% yield loss.
    • Filter rinsate (following continuous rinse with 1% ammonia) resulted in an average 15% yield loss.

    Citations

    • Bradley, K. 2017. “A Final Report on Dicamba-injured Soybean Acres”. University of Missouri Integrated Pest Management online. https://ipm.missouri.edu/IPCM/2017/10/final_report_dicamba_injured_soybean/
    • Cundiff, G.T., Reynolds, D.B. and T.C. Mueller. 2017. Evaluation of dicamba persistence among various agricultural hose types and cleanout procedures using soybean (Glycine max) as a bio-indicator. Weed Science. 65(2), pp. 305-316.
    • Jacobson, B., Urbanczyk-Wochniak, E., Mueth., M.G., Riter, L.S., Sall, J.H., South, S. and Carver, L. 2014. “Field Volatility of Dicamba Formulation MON 119096 Following a Post-Emerge Applciation Under Field Conditions in Texas”. Monsanto Report Number MSL0027193.
    • Mueller, T. 2017. “Effect of adding Roundup PowerMax to Engenia on vapor losses under field conditions” (Presentation).
    • Robinson, A.P., Simpson, D.M. and W.G. Johnson. 2013. Response of glyphosate-tolerant soybean yield components to dicamba. Weed Science. 61(4), pp. 526-536.
    • Wax, L.M., Knuth L.A., and Slife F.W. 1969. Response of soybean to 2,4-D, dicamba, and picloram. Weed Sci 17, pp. 388-393.
  • Application Recordkeeping: Focus on Environmental Conditions

    Application Recordkeeping: Focus on Environmental Conditions

    Note: This article was written by Bob Wolf of Wolf Consulting and Research, and first appeared as an NDSU Extension Service publication. Bob has agreed to reproduce the article on our website.

    When applying crop protection products, a good steward is one who can identify and record the environmental factors that may negatively impact making an application; particularly, the possibility of spray drift.

    New label language states: “Avoiding spray drift at the application site is the responsibility of the applicator.” A wise sprayer operator must possess the ability to assess the environmental conditions at the field location to determine how best to spray the field, or maybe decide it would be best not to spray that field, or part of that field, at that time. Instruments that assess environmental conditions are available to assist applicators in making good decisions.

    Making the correct measurement is the critical first step. Record the information measured to document the application conditions. Quality records help mitigate against any misapplication allegations, such as a drift complaint. Many of the items listed below are based on past legal experiences with applications involving spray drift litigation.

    The following guidelines should help you measure and accurately record environmental conditions at the application site.

    1- Document any instrument used by recording the manufacturer and model number. Accurate portable weather instruments are recommended. Portable weather instruments are available that log and store data, and aid in auditing and recordkeeping. Some will have Bluetooth/wireless capabilities.

    2- Environmental measurements include wind speed and direction, temperature, and relative humidity.

    3- At a minimum, record data at the start and finish of the job. Consider more often as conditions change or for a job that lasts over a longer period. For example, make observations when tank refilling for larger fields. Time stamp all observations with a.m., p.m., or military time.

    4- Take meteorological readings as close to the application site as possible. Be advised that the weather data received via a smart phone or local weather station may not be accurate for the location being sprayed.

    Note the specific location where the measurement was made, such as GPS coordinates, field entry point, field location, etc. Check the label to see if it requires a specific observation location in relation to the treatment area.

    5- Make all measurements as close as possible to the nozzle release height (boom height) and in an area not protected from the wind by the spray machine or your body. For aerial applications, six feet is suggested when using a hand held instrument.

    6- Record wind speed averaged over a 1 to 2 minute time span. Note the time the observation was recorded. Most instruments give an average over a period of time. Make sure the instrument’s anemometer is facing directly into the wind.

    Do not record winds as variable or with a range i.e. 4 to 8 mph – an average gives a better indication of the transport energy. Light and variable winds, where directions may change several times over a short period, can be more problematic than higher speed winds in a sustained direction. Observe any label restrictions on wind speed.

    Wind direction requires a similar averaged measurement. Record direction in degrees magnetic from a compass (0-360°). The use of alphabetic characters, i.e., N, S, NW, to indicate wind direction is discouraged. The key for determining direction is to have an accurate assessment method: trees moving, dust, smoke, a ribbon on a short stake, etc. Face directly into the wind and record the direction from which the wind is coming. A ribbon on a stake with the ribbon blowing directly at your body is a simple fail safe approach. Movement of smoke, particularly from moving aircraft, or dust may help determine direction.

    7- Record temperature and humidity since they can be helpful in determining temperature inversion potential. It may be advisable to record both temperature and humidity well before and after the application for this purpose. In fact, recording a morning low and an afternoon high would be useful regarding determining the potential for an inversion. Take temperature measurements with the instrument out of direct sunlight. Shade the instrument with your body or spray equipment. This is especially critical if you are trying to assess temperature differentials for determining if an inversion is in place.

    8- Be alert to field level temperature inversion conditions which typically occur from late afternoon, can be sustained through the night, and into the next morning. Beware, inversions can start mid-afternoon. Observe conditions such as the presence of ground fog, smoke layers hanging parallel to the ground, dust hanging over the field/gravel road, heavy dew, frost, or intense odors (i.e., smells from manure or stagnant water from ponds are held close to the surface when inversion conditions exist). Inversions commonly occur with low (less than 3 mph) to no wind speeds. Spraying in calm air is not advised. If a mechanical smoker is used note wind direction and smoke dissipation with a time stamp.

    9- Note any variances due to terrain or vegetation differences, tree lines, buildings, etc.

    10- Initial or sign all recordings to indicate who made the observation(s).

  • Spray Coverage in Carrot, Onion and Potato

    Spray Coverage in Carrot, Onion and Potato

    This research was performed with Dennis Van Dyk (@Dennis_VanDyk), vegetable specialist with the Ontario Ministry of Agriculture, Food and Rural Affairs.

    Prior to 2017, Syngenta introduced the UK to the Defy 3D nozzle, which is a 100° flat fan, designed to run alternating 38° forward or backward along the boom. They prescribed a boom height of 50 to 75 cm, 30-40 psi, and travel speeds of 10 to 14 km/h in cereals and vegetables. Compared to a conventional flat fan, they claimed that the angle and Medium-Coarse droplets promise less drift and improved coverage.

    In 2017, Hypro and John Deere began distributing the Defy 3D in North America. Our goal was to explore coverage from the 3D in vegetable crops. We compared the nozzle’s performance to common grower practices in onion, potato and carrot in the Holland Marsh area of Ontario.

    Experiment

    We used a technique called fluorimetry. A fluorescent dye (Rhodamine WT) was sprayed at 2 mL / L from a calibrated sprayer based on protocols generously provided by Dr. Tom Wolf.

    Tissue samples from the top, middle and bottom of the canopy were collected from random plants.

    The samples were rinsed with a volume of dH2O and this rinsate was then tested to determine how much dye was recovered.

    The tissues collected were dried and weighed to normalize the samples to µL of dye per gram dry weight to allow for comparison.

    In addition, we used water-sensitive paper as a check in key locations in the canopy to provide laminar and panoramic coverage. Papers were digitized and coverage determined as a percentage of the surface covered.

    In carrot and onion, we compared a hollowcone, an air-induction flatfan, and alternating 03 3D’s at 500 L/ha (~40 cm boom height, ~3 km/h travel speed, ~27ºC, 3-9 km/h crosswind, ~65% RH).

    In potato we compared the alternating 05 3D’s to a hollowcone at 200 L/ha (~55 cm boom height, ~10.5 km/h travel speed, ~22ºC, 6-8 km/h crosswind, ~65% RH).

    Water-sensitive papers were originally intended as a coverage check, and not as a source of analysis, but their use revealed interesting information. The following images are the papers recovered a single pass in each crop.

    Carrot

    Onion

    Potato

    Results

    The following table represents the percent coverage of these paper targets. Papers were digitized using a WordCard Pro business card scanner and analysis made using DepositScan software. This table is small, but you can zoom in for a quick comparison. The following three histograms show the same data graphically for carrot, onion and potato, respectively. Remember, this only represents a single pass, so don’t draw any conclusions about coverage yet.

    Carrot

    Onion

    Potato

    It was interesting to note differences in coverage observed on the papers versus the results of the fluorimetric analysis. It was anticipated that while water-sensitive paper serves for rough approximation of deposition, fluorimetry would be far more accurate. This is because of the droplet spread on the paper, and the evaporation and concentration of a spray droplet en route to the target. Again, here is a small table, and again, the next three histograms show the same data graphically for carrot, onion and potato, respectively.

    Carrot

    Onion

    Potato

    Observations

    While water-sensitive paper is an excellent diagnostic tool for coverage, fluorimetry allows for greater resolution. The high variability in coverage meant little or no statistical significance, however the means suggested the following:

    • In carrot, the 3D deposited more spray at the top of the canopy.
    • In onion, the hollowcone spray had a higher average deposit, and penetrated more deeply into the canopy.
    • In potato, the hollowcone deposited more spray at the top, with little or no difference mid-canopy.

    Each nozzle performed well at the top of the canopy, which is quite easy to hit. Certainly they exceeded any threshold for pest control. With the possible exception of hollowcone in onion, nozzle choice had only minor impact on mid-bottom canopy coverage. And so, if coverage is not a factor for distinguishing between these nozzles, we should consider drift potential. Due to the comparably smaller droplet spray quality, the hollowcone is far more prone to off target movement. This leads us to select the AI flat fan or the 3D as the more drift-conscious alternatives.

    Future analysis would benefit from a larger sample size to reduce variability, and the inclusion of an air-assist boom to better direct spray into the canopy.

    Applitech Canada (Hypro / SHURflo) is gratefully acknowledged for the 3D nozzles. Thanks to Kevin D Vander Kooi (U of G Muck Crops Station) and Paul Lynch (Producer). Assistance from Will Short, Brittany Lacasse and Laura Riches is gratefully acknowledged. Research made possible through funding from Horticultural Crops Ontario.