- Droplet size largely determines spray drift and pesticide efficacy; nozzle droplet information should be accessible.
- Measuring droplets is difficult: they are tiny, evaporate, and impingement methods like water sensitive paper need spread factors and miss very small droplets.
- Laser instruments revolutionized droplet sizing; main methods include laser diffraction, laser shadowing, pulsed laser imaging, and phase Doppler systems.
- Sampling bias is critical: spatial sampling overrepresents slow small droplets, while temporal methods measure velocity to correct abundance.
- Traverse scans and replicates are required because droplet size varies across the pattern and measurement setups introduce variability.
This text was generated by OpenAI GPT 5 Mini
It’s often been said that droplet size is the most important factor governing spray operation success. Both spray drift and pesticide efficacy depend to a large degree on droplet size. For something this important, the droplet size information from nozzles ought to be accessible and easy to understand.
There are a few problems to overcome before we get there.
The first is the difficulty in measuring droplets in the first place. Spray droplets are very small and evaporate quickly. In the early days of spray technology research, sprays would be captured on a surface and individual droplets measured and counted under a microscope. A common approach was to use magnesium-oxide coated glass slides. The magnesium oxide layer was soft, and an impinging droplet left a tell-tale crater behind, much like those found on the moon’s surface. This allowed the analysis to be done after evaporation. Magnesium oxide does a great job but relies on droplets having enough momentum to leave their mark. There is also a spread factor (ratio of crater diameter to droplet diameter) that has to be known.
Water-sensitive paper (WSP) is the modern version of this concept, and we’ve written much about the topic. Jason in particular has done a deep dive on how WSP works and how it’s analyzed.
We can also add dye to spray mixtures to see deposits on various glossy paper surfaces. The resolution of the dye-droplets can be better than those from WSP but their deposits can also be so faint that they pose thresholding and analysis problems.
The great thing about impingement methods like WSP is that they’re easy to use, and they are particularly useful for a quick visual and qualitative assessment of coverage. If wanted, coverage can be quantified by scanning the WSP for percent area covered or deposit density.
Droplet size determination is problematic on WSP because one needs to know the spread factor (how much larger the deposit is compared to the in-flight droplet that caused it) to back-calculate the original size of the in-flight droplet.
Spread factor depends on droplet size, velocity, formulation, and the nature and orientation of the surface it’s collected on. The SF formula provided by the paper manufacturers is a good start but it is far from perfect.
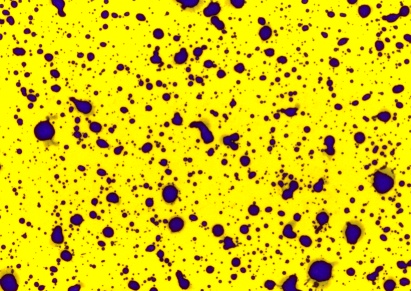
In addition, the overall droplet density has to be low enough to avoid overlaps or coalescence. Usually a water volume over 50 to 100 L/ha will create issues. The WSP also has to collect the droplet in the first place. Smaller droplets often move around larger objects such as a leaf, or a similar sized piece of paper. If they impact at a sharp angle, the deposit will be elongated due to smearing and that creates additional difficulties.
Even if the paper collected the smallest droplets, they may not appear as stains. Droplets below a certain diameter (about 50 µm) do not leave a visible deposit on the paper.
So, while WSP is a great tool for visualizing a deposit, its limitations usually prevent it from being used to accurately measure the droplet size spectrum of a spray.
The Rise of the Laser
In the 1970s and 80s, we saw the introduction of laser-based droplet size measurements. With these, a spray simply needed to be directed into a such an instrument, and it very quickly determined the diameter, and in some cases, the velocity, of the droplets. The principles employed by various laser instruments differed, and although one could now rapidly obtain data in-situ, the numbers among the instruments didn’t always agree.
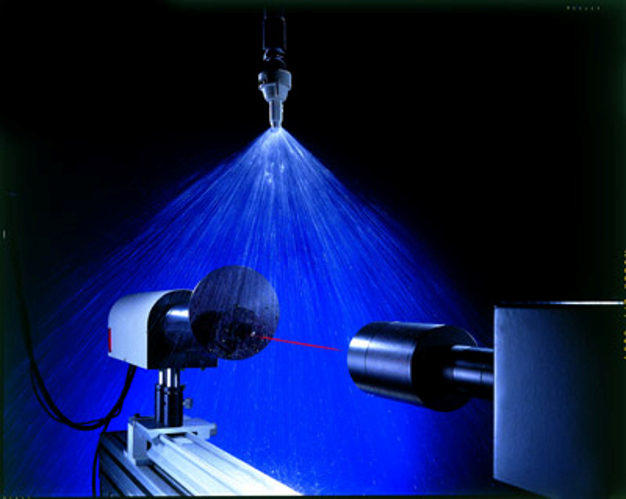
The Most Common Laser Systems
Laser diffraction: One of the first droplet sizing instruments is manufactured by Malvern (https://www.malvernpanalytical.com/en), and is still in use today. A laser beam passes through a spray cloud. The system uses a laser diffraction principle that works as follows, according to Malvern: “Large particles scatter light at small angles relative to the laser beam and small particles scatter light at large angles. The angular scattering intensity data is then analyzed to calculate the size of the particles responsible for creating the scattering pattern, using the Mie theory of light scattering.”
To calculate the droplet sizes responsible for the scattering behaviour, the laser system has light-sensitive sensors in concentric circles behind the spray plume. When a sensor in the middle of these rings picked up a signal, it likely originated from a larger droplet because of its lower light scattering properties. Sensors further from the centre picked up smaller droplets. The system thus had an idea of the relative frequency of the various droplet sizes in the spray cloud and modelled these according to the classic Rossin-Rammler spray distribution model, from which descriptive parameters are calculated.
Laser diffraction is the most popular method for in-situ droplet sizing. The company Sympatec (https://www.sympatec.com/en/) also offers a system that competes with Malvern that is found in many labs.
Laser Shadowing: The Particle Measuring Systems (PMS) system was one of the earliest laser systems. It was a very compact and sturdy system that shone a laser light at the spray cloud and the droplets in that cloud cast shadows against a sensor array a fixed distance away. The size of these shadows could then be measured to arrive at a droplet size distribution. The PMS was particularly good at measuring small droplets.
Although long discontinued, the PMS system had the basic appearance of a torpedo and was often mounted on aircraft or in wind tunnels to measure cloud aerosol sizes. Very cool. The company still manufactures other particle measuring devices (https://www.pmeasuring.com/).
Pulsed Laser Illumination: This is a different approach to the laser shadowing of the PMS system. Oxford Lasers systems (https://oxfordlasers.com/) use a video camera to view the spray cloud and freeze images from using a very high frequency pulsed laser light. This light illuminates the cloud briefly which allows a still image to be briefly displayed. Image analysis then measures the diameter of each particle in the image, adjusting for out-of-focus images. It’s possible to analyze the speed and direction of the particles by comparing the particle position in subsequent images. This system is quite popular among scientists due to its ease of use. A portable unit that can be deployed in fields is available.
Phase Doppler: In the mid 1980s, a system was developed that uses the Doppler principle to measure both the speed and diameter of droplets. Two out-of-phase laser beams intersected in a spray cloud, and a droplet passing through the intersection point created a Doppler burst that signalled the speed of the droplet. The burst signal also contained information on the droplet diameter, derived from a frequency shift of the two laser beams utilized in the system. This system has very high data acquisition and was the first to create a temporal sample of the spray, increasing the accuracy of the droplet size measurements.
Initially brought to market by Aerometrics (later acquired by TSI) and called the Phase/Doppler Particle Analyzer (PDPA), it is now mainly offered by Dantech systems (https://www.dantecdynamics.com/).
Sampling Bias: Temporal vs Spatial
It’s not straightforward to measure a sample of moving objects. It may seem intuitive that if one wants to know how many objects are present, taking a picture and counting the objects would provide the answer. But when objects move at different speeds, that answer will be incorrect because the slower moving objects will be over-represented.
Let’s assume you’re working on a traffic count project to understand the number of people crossing a bridge either walking or cycling. Let’s also assume that one walker and cyclist depart for the bridge every 5 seconds, i.e., there are the same number of each. If you wait until the bridge is full of people crossing and take a picture it will show more people walking on the bridge than riding bicycles. That is because the bicycles are faster and many will already have left the frame. Thus counting the number of people in the picture over-estimates the number of walkers because they move slower.
The same problem arises with these laser systems because in a hydraulic spray, the smaller droplets move slower than the larger droplets. Any system that takes a picture and counts what’s in it will have what’s called a spatial sample, overestimating the slower (smaller) droplets.
A temporal sample can measure the velocity of the droplets and therefore account for their speed, giving a more accurate measure of the abundance of the droplets. In the case of the PDPA, it acheives this simply by counting all the individual droplets that pass, in sequence, through its meassurement area, called the probe volume. As they pass, it notes their velocity and diameter.
To address this issue with a spatial sampling instrument, many labs now use wind tunnels and direct the spray to be tested with the wind direction. This forces the droplets to move at more or less the same velocity as the wind, eliminating or at least minimizing the speed differences before the droplets reach the laser instrument.
WSP produces a temporal sample because it ultimately catches all droplets, but it has different types of sampling bias. Large deposits usually cover smaller ones. Smaller droplets may not impact on the target due to poor collection efficiency. Small droplets may dry too quickly to leave a visible stain. As a result, even if we had accurate spread factors, we would tend to under-estimate the number of smaller droplets, opposite of the error of spatial systems.
Scanning the pattern
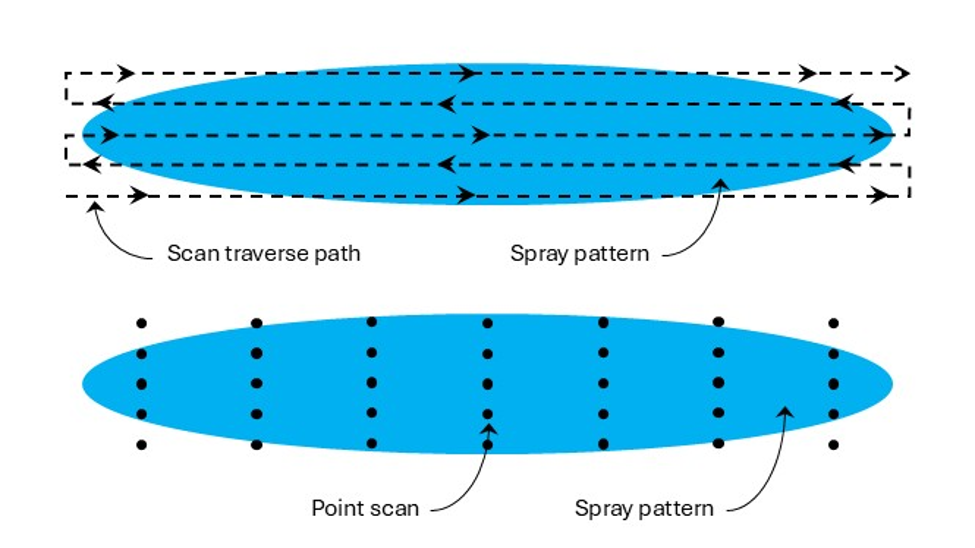
Droplets are not distributed uniformly within a spray pattern. In a flat fan nozzle, for example, the centre of the pattern contains the smaller droplets. The outside edges of the pattern contain fewer small droplets and more large droplets. Some laser systems have a very shallow depth of field, and the PDPA is a point-measurement. As a result, it is not accurate to simply point the measuring device at a single location of the spray pattern. Accurate droplet size spectra from lasers requires a thorough traversing scan of the spray pattern along at least its long axis, and preferably two or more such traverses at increasing distances from this central axis. The scanning method would likely need to be adjusted to suit various types of atomizers, such as hollow cone nozzles.
If no traversing mechanism is available, it is acceptable to measure the spray at several discrete locations and then merge the data prior to analysis. In all cases, three replicate samples should be taken so that an estimate of variability is available.
Many labs, having compared a full scan with many traverses to those with fewer traverses have opted for a simple back and forth traverse with little loss in accuracy.
Sometimes sprays are atomized within a chamber to prevent the droplets from contaminating the surrounding area if they contain any active ingredients. These chambers can also add measurement errors from, say, small droplets that recirculate within the chamber, or due to any glass surfaces through which the laser lights must pass. These all need to be considered, as they add to the many variables that create different results even when comparing identical sprays between labs.
The next topic, covered here, is how to use the information we gather from droplet measurements. As you might expect, this is also not as straightforward as it seems.
