- WSP visualizes spray coverage; quick qualitative checks inform spray performance and can indicate biologically meaningful differences.
- WSP underestimates spreading on plant surfaces and is best used as a relative index, not absolute deposit measurement.
- Minimum detectable droplet size varies by brand and conditions, roughly 30 to 100 μm; finer droplets often go undetected.
- Stain to droplet conversion uses spread factors but depends on conditions, making droplet sizing unreliable except under controlled setups.
- Use stable imaging; prefer scanners or calibrated cameras. Aim 10 μm per pixel, filter deposits under three pixels, and save lossless files.
This text was generated by OpenAI GPT 5 Mini
This is not a typical article for www.sprayers101.com. We like to develop actionable, data-driven content written in an easily-read format. Some articles discuss the results of research, some describe best practices and techniques, and occasionally there’s a song parody. But this article is different.
We recently wrote about the three commercially-available brands of water sensitive paper (WSP). The article was an impartial comparative evaluation of how these papers resolved spray coverage. But in order to be fair in our evaluation, we had to decide the best method for assessing them. This led us down a rabbit hole far deeper than we could have imagined. The science of image processing is complicated and there are many ways that WSP can be interpreted using a myriad of home-grown and commercial methods. We decided to share what we learned.
Which method is best for you? How far should we take a tool that was originally developed for quick, subjective comparisons? What follows is a three-part primer in digitizing and analyzing water sensitive paper. If you’re a grower that has never used WSP, you need only read to the end of the next sentence. Buy it and try it. If you’re a consultant, a researcher, or just interested in wringing all you can from this excellent agronomic tool, then get comfortable.
Here, in part 1, we’ll explore a brief history of WSP, describe a few limitations in what it is capable of resolving, and start down the road of how to capture a digital picture for later analysis. Welcome to the world of blob-analysis.
Introduction
Spray coverage describes the degree of contact between spray droplets and the target surface area. This metric can be used to predict the success of an application. One of the easiest methods for visualizing coverage is to use water sensitive paper, which is a passive, artificial collector that turns from yellow to blue when contacted by water.
WSP is often used to evaluate iterative changes to a spray program. Placed strategically throughout a target canopy, or directly on the ground, achieving uniform, threshold coverage translates into improved efficacy, reduced waste, reduced off-target contamination and reduced risk of pesticide resistance development. WSP tends to underestimate the spreading effect that can occur on plant surfaces (especially when surfactants are used), but they are effective as a relative index.
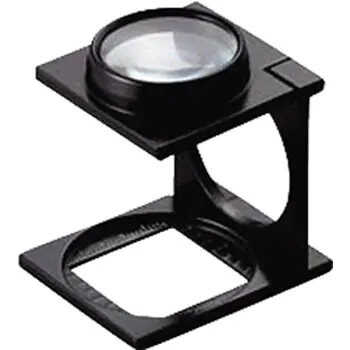
The simplest use of WSP, and the primary reason it was commercially developed, is to perform qualitative assessments. For example, when observers judge one paper to be visibly “bluer” than another, subsequent measurements have shown it can represent an increase of 20% in foliar deposit. In other words, if you can perceive a difference with the naked eye, it likely represents a biological impact. This fast and rudimentary use of WSP provides immediate and actionable feedback and is therefore valuable information for any sprayer operator. It has been suggested that manual counts become impractical at ~200 stains/cm2, but higher counts are possible using a loupe or linen tester-style lens.
WSP can also be used for in-depth, quantitative assessments. This requires a camera or scanner to produce a digital image of the WSP and specialized analytical software to extract the relevant data. Considerable research has been performed to establish the limits of what can be learned from WSP. The four pieces of information commonly sought are listed here from easiest and most reliable to hardest and least reliable (or arguably, impossible) to determine.
- The percent surface area covered.
- The density of deposits on the target area.
- The size of the droplets that left the stains.
- The dose applied to the target surface.
This document will describe the fundamentals of image analysis and provide examples of commercial tools and protocols used to extract coverage data from WSP. It will also describe the assumptions and the limits intrinsic to these methods so the user can decide the degree of time and effort to invest versus the reliability of the results.
A brief history of WSP
In 1970, a journal article described a new method for sampling and assessing spray droplets. Photographic paper treated with bromoethyl blue created a yellow surface that changed colour when it encountered moisture. The pH-based reaction was fast and irreversible, leaving a distinct blue stain to mark the deposition.
Ciba-Geigy Ltd. made water sensitive paper commercially available in 1985 (later as Novartis in 1996 and as Syngenta since 2000). It is produced in several formats, but aluminum foil packages of 50, 76 x 22 mm (1 x 3 in.) papers are the most popular. Odds are if you’ve ever used water sensitive paper, it originated from Syngenta in Switzerland. Recently, two new options have been made commercially available: Innoquest’s SpotOn Paper (United States) and WSPaper (Brazil).
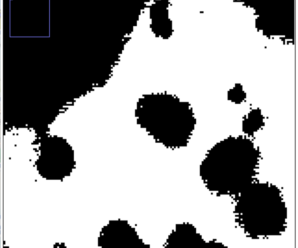
Once dry, the blue stains on WSP are irreversible and papers can be stored for a few years. However, unstained portions will continue to react to moisture from humidity, dew, or fingerprints, so care must be taken in their handling and storage. According to Syngenta, stains can be permanently fixed using isopropanol (or a similar solvent) to remove the yellow layer, leaving black stains on white paper.
Limitations of water sensitive paper
a. Minimum drop detection diameter
In hot and dry conditions, not all droplets that contact WSP will leave stains. En route from nozzle to target, droplets can concentrate through evaporation, leaving insufficient water to stain the paper. Syngenta states that droplets <100 µm in diameter will not be reliably resolved in “tropical conditions”. For most conditions, their minimum droplet diameter is closer to 50 µm. Innoquest states that their minimum drop detection diameter, under most environmental conditions, is between 60 and 90 µm.
This isn’t to say that smaller droplets can’t be detected. In absolutely ideal conditions, the smallest detectible droplet diameter for any brand of WSP is closer to 30 µm (Syngenta, Innoquest, SprayX – Personal Communication). Microscopic analysis of Syngenta’s papers reveals that droplets finer than this can leave physical “craters” on the surface, but have insufficient water to cause the colour change. The stain diameter created by a droplet is always larger than the droplet diameter, to a degree that is dependent on the spread factor.
b. Spread factor
The size of a stain is sometimes used to extrapolate the size of the droplet that produced it. The stain diameter is divided by a spread factor, which is determined under specific conditions. For example, Syngenta’s spread factors were established using the magnesium oxide and silicon‐oil‐method at 20°C and a 40% relative humidity for droplets at sedimentation velocity. “Sedimentation velocity” can be thought of as terminal velocity, which accounts for the fact that droplets moving at higher speeds will leave larger diameter stains. Consider the splash produced by a water balloon hitting a surface fast or hitting it slow.
Spread factors are not constant for all droplet sizes. For Syngenta’s WSP, a 59 µm droplet is expected to leave a 100 µm diameter stain (a spread factor of 1.7) and a 285 µm droplet is expected to leave a 600 µm diameter stain (a spread factor of 2.1). This relationship is sometimes captured using calculus. One research article employed this formula: feDm = 0.74057 + 0.0001010399 × Dm + 0.02024884 × ln(Dm) (where fe is spread factor and Dm is stain diameter in microns). Volume was then calculated per: Vg = (π × Dg3) / 6 (where Vg is droplet volume in µm3 and Dg is droplet diameter in µm). Innoquest determined their spread factors to be [0.4508 × Ln(Observed Stain Diameter)] – 0.6221 (Personal Communication).
Given that droplet sizing excludes the finest droplets, relies on situation-specific spread factors, assumes the droplet has reached terminal velocity and can be stymied by overlapping and elliptical stains (discussed in the next installment of this document) it is questionable whether there is any practical value in the exercise except perhaps for a relative comparison under highly controlled conditions.
Digitizing WSP
Digital images are produced using cameras or scanners. Cameras employ a grid of light-sensitive sensors, each of which reflect and record their portion of an image. Cameras capture images quickly but are prone to focus and distortion issues because the lens must be held very close to the WSP. SprayX’s DropScope accounts for this by individually calibrating each unit to compensate for variation during assembly and by employing software to account for lens distortion. When high resolution is required, cameras are the more expensive and complicated option. However, when resolution is not an issue, even a smartphone camera can be used (as with the SnapCard app; which as of 2026 is no longer be available, but a new app called SprayDex offers possibilities).
Flatbed scanners press multiple papers against a glass platen fixed above the light-sensitive sensors. This minimizes potential focus issues. Compared to cameras, scanners experience less distortion because they do not use a fixed grid of sensors. Instead, they rely on the speed and consistency of a carriage motor that draws an array of sensors along the image, capturing discrete slices. Scanners are less expensive than cameras, but they are much slower and low-end varieties can sometimes skip tiny slices of the image. This is not an issue when scanning office documents, but it can cause problems when analyzing a high resolution image.
a. Pixels
A pixel (a contraction of Picture Element) is the numerical information recorded by a light-sensitive sensor. The word “digitizing” means “converting to numbers”. The most rudimentary pixel value is an eight digit (or 8-bit) number. Each bit is either a 1 or a 0, so each pixel value is one of 28 (that’s 256) possible unique combinations. A picture displayed as a grid of 8-bit numbers wouldn’t make sense, so the computer substitutes shades or colours according to a look-up table.
Today’s sensors report higher pixel values to give more depth to the digitized image. An RGB (Red, Green, Blue) image records separate 8-bit values for red, green and blue colours. That’s 2563, or 16,777,216 possible unique colour combinations for a single 24-bit pixel.
With such a nuanced spectrum, two colours might look the same to the naked eye but represent different pixel values. Therefore, image analysis is more precise when we can work with the pixel values (the actual numerical data) and not shades or colours (an interpretation of the data).
b. Resolution (scale)
Before we can analyze an image, we must first know the scale. Each pixel is the smallest element in a grid that makes up the digital image. The scale of the image determines the real-life size that each pixel represents, making it possible to calibrate size measurements. We often refer to image resolution in Dots Per Inch (DPI). In this case, “dots” refers to pixels. The higher the DPI, the higher the resolution as the diameter of each pixel represents a smaller real-life length.
Camera resolution is described in terms of megapixels (MP) where 1 MP represents a grid of light-sensitive sensors capable of producing a 1 million-pixel area. When planning to print an image, the convention is to use a minimum resolution of 300 pixels per inch. For example, a standard 8 x 10 in. print would need 2,400 x 3,000 pixels for a total area of 7.2 million pixels. This would require a 7.2 megapixel camera.
The area we are dealing with is typically less than the entire 1 x 3 in. paper. Even if we captured the entire paper, a 1 MP camera would provide 600 pixels per inch, or approximately twice the resolution required for a typical 8 x 10 in. print. That may seem sufficient, but remember we are examining the image very closely, which would be similar to blowing the print up to the size of a billboard. For reference, the SprayX DropScope uses an 8 MP camera. The iPhone 7 camera used to capture SnapCard images for this document is 12 MP.
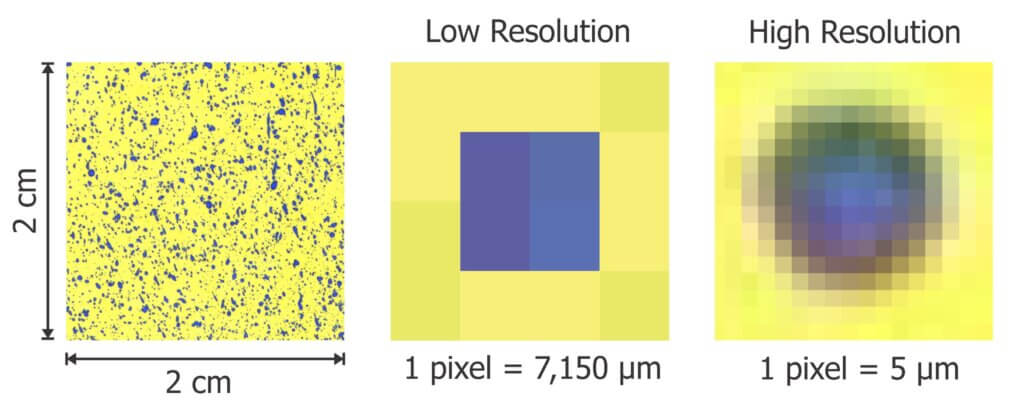
So, what is the ideal resolution and what are the downsides of getting it wrong? A low resolution image has a low pixel density, which might cause us to see multiple deposits as a single deposit or to miss the smallest deposits entirely. The minimum diameter of a detectable deposit must be about the same as the imaging resolution. For example, if a pixel represents a 30 μm diameter, the smallest deposit we could reliably resolve would be about the same size. Software that registers deposits sizes less than the limit of resolution are likely due to an algorithm error and should be ignored.
This is further complicated by stains that lie at an intersection overlapping multiple pixels. In this case, more than one pixel might represent a colour that is blue enough to register as stained, reporting a larger deposit than was actually there.
It is tempting to go to the highest resolution possible, but this can also cause problems, such as detecting and misidentifying inconsistencies in the surface texture of the paper as stains. Additionally, high-res images create logistic issues; They take longer to scan and to process as well as create large files that take up a lot of storage space. Image formats (e.g. JPEG) can compress the image file to make it smaller, but data is lost. Other formats (e.g. TIFF, PNG, BMP) are not as efficient at saving space, but they preserve the original data and are therefore preferred.
We suggest that 10 µm : pixel provides enough resolution, a reasonable processing time and a manageable file size. Further, given that a deposit could overlap multiple pixels, we propose employing a filter that removes any deposits less than a three pixel, or 30 µm, span. This lower limit eliminates artifacts and is still smaller than the smallest stain WSP can possibly produce. Some software allows the user to set this limit, and some make the choice on our behalf.
Next article: Image analysis software and thresholding.