Category: Rates and Calibration

For basics category

  • Reading Airblast Nozzle Tables

    Reading Airblast Nozzle Tables

    Airblast operators should know how to read a nozzle table. They are found on dealer and manufacturer websites as well as in their catalogs. Table layout varies with brand, but they all relate a nozzle’s flow rate to operating pressure. The better tables also provide the spray angle and the median droplet size (i.e. spray quality).

    Operators need this information to complete calibration calculations (aka sprayer math) and when deciding how to distribute nozzle rates, angles and spray quality along a boom relative to the target canopy.

    This article focusses on hollow and full cone nozzles, which are commonly found on airblast sprayers. For more information on flat fan nozzle tables (e.g. for banded under-canopy or, vertical booms or broadcast applications from horizontal booms), refer to this article.

    Reading the table

    Let’s use the table below to determine a nozzle’s flow rate for a given pressure. First, find the nozzle colour in the top row. Second, find the operating pressure in the left-most column. Finally, the flow rate is indicated in the cell at the intersection between the row and column. For example, a red ATR hollow cone nozzle operated at 9 bar will emit a flow rate of 1.83 L/min.

    Perhaps you want to determine which nozzle will give a specific flow rate. Find the rate in the body of the table and trace the column and row to determine which nozzle/pressure combination will achieve it. For example, if we want a flow rate of ~1.00 L/min, we can use a Yellow at 10 bar or an Orange at 5 bar. Yellow is the better choice since the Orange would have to be operated at the bottom of its pressure range (more on that later).
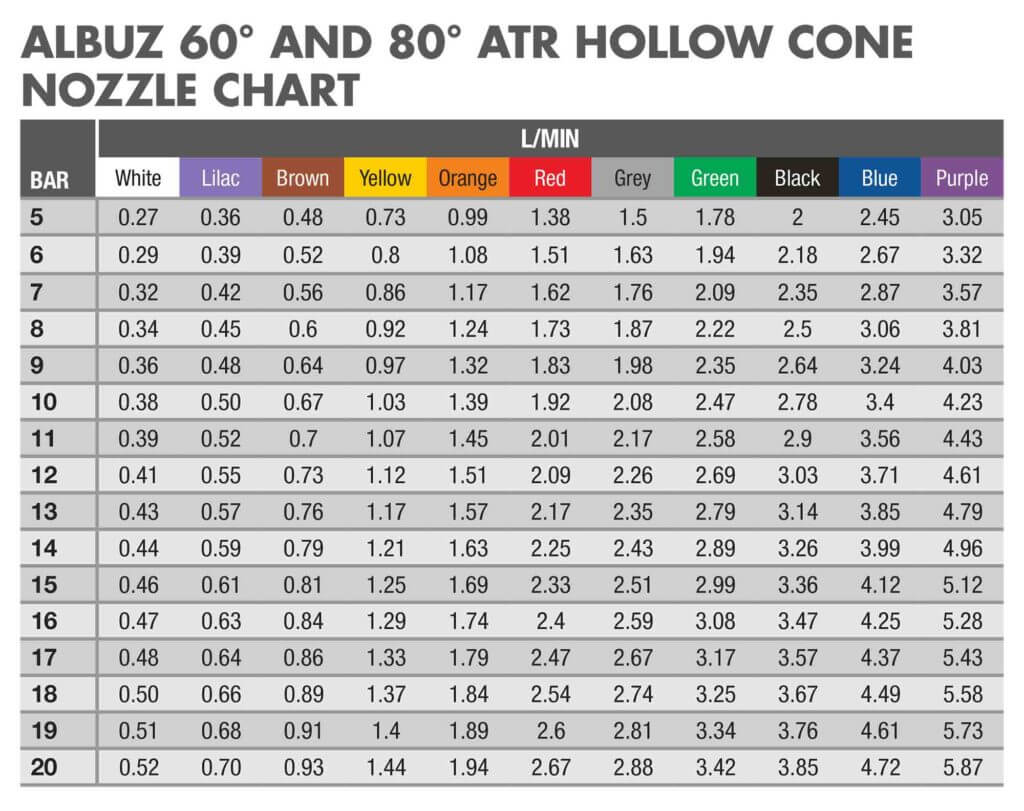
    This Albuz nozzle table for 60 and 80 degree molded hollow cones gives flow rates in litres per minute.

    Note: Do not to confuse TeeJet’s ISO-standardized TXA or TXB nozzles with TXVK or ConeJet nozzles. They may be the same colour, but their outputs are very different.

    Higher flow rates or full cone patterns can be achieved using combination disc and core (or disc and whirl) nozzles. Depending on the manufacturer, the disc plate is defined by it’s diameter in 64th’s of an inch. The core or whirl plate might be described by the number of holes (e.g. 2-hole, 3-hole, etc.), or some other manufacturer-specific nomenclature (e.g. 45’s, 25’s etc.).

    Using the table below, we see that a D2 disc and a DC35 core will emit 0.34 gpm at 80 psi. By continuing along the row, we see that the spray angle for this combination will be 47 degrees at that pressure.
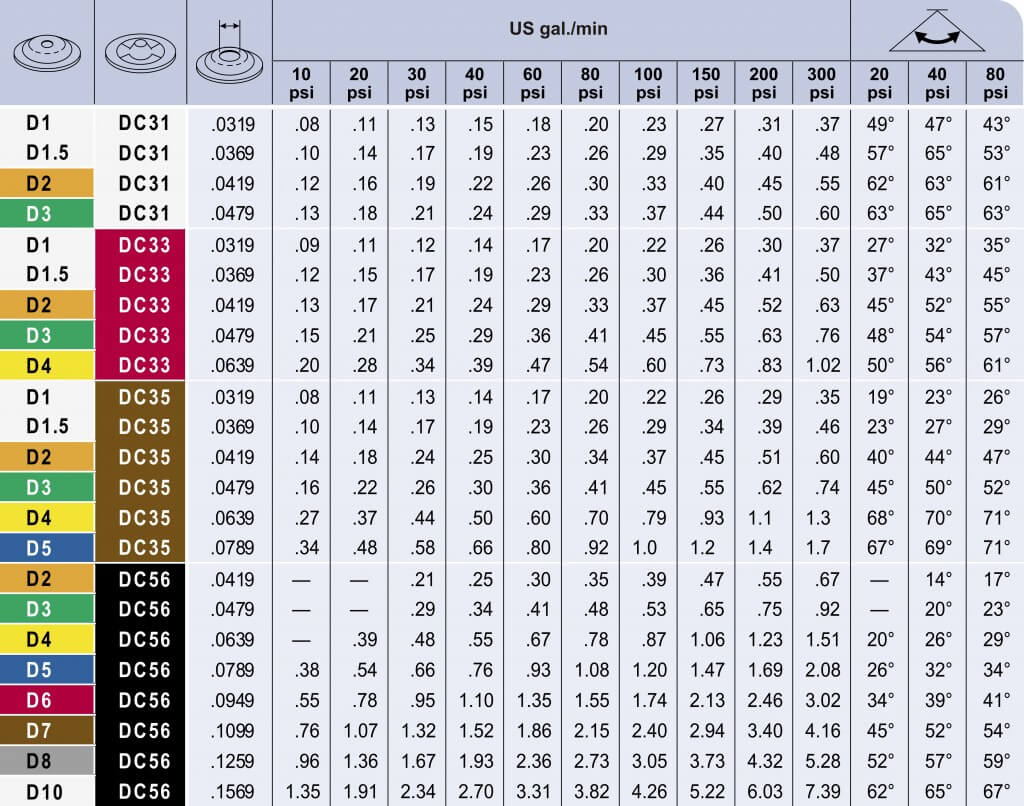
    This nozzle Table for TeeJet disc & cores is fairly typical of any manufacturer’s nozzle table. Find the disc & core combination in the two left-hand columns, and follow the row until it intersects your operating pressure to determine the rate in US gallons per minute. Or, if you know your ideal rate already, you can find the best disc & core combination for a given pressure to achieve that rate.
    This TeeJet nozzle table gives the flow rate for a disc (D#) and core (DC#) full cone combination nozzles in US gallons per minute.

    Pressure problems

    Do not choose a nozzle at the extreme of their flow or pressure range. A trailed PTO sprayer will experience pressure changes from driving on hills, or rate controllers will create pressure changes in response to changes in travel speed. In either situation, coverage will be compromised if the nozzle is pushed outside its optimal range.

    Note: Use pressure to achieve small changes in flow, but for more extreme changes, switch nozzles. Remember, it takes 4x the pressure to get 2x the flow. Stated differently, it takes 1/4 the pressure to get 1/2 the flow.

    You may not find a nozzle/pressure combination that emits the rate you are looking for. When your desired rate or pressure falls between the figures listed in the table, you can take the average. When nozzling an entire boom with different nozzle rates, get each position as close as you can to achieve the overall boom rate for a given pressure. It’s always a compromise – don’t stress over it.

    The author looking up nozzle rates during a spring calibration. The operator was running at 190 psi, but the catalogue only listed 180 psi and 200 psi. When span is only 20 psi, it’s fairly safe to approximate the output. When the table only lists in 50 psi increments, it is more difficult to determine the rate without testing the output. This issue usually occurs at pressures above 200 psi, and that’s very high for most horticultural operations. Consider using a lower operating pressure, if possible.
    Looking up nozzle rates during a spring calibration. The operator was running at 190 psi, but the catalogue only listed 180 psi and 200 psi. When the increment is only 20 psi, it’s reasonable to approximate the output. When the span is 50 psi increments, it is more difficult to determine the rate without testing the output (it’s not a linear relationship). This issue usually occurs at pressures above 200 psi, and that’s far too high for cane, bush, vine and high-density orchards. In these situations, consider using a lower operating pressure.

    Different nozzles, same rate

    Different disc core combinations, or molded nozzles at different pressures, can produce similar flow rates. However, their spray quality and spray cone angles can be very different (see last three columns in the TeeJet table above).

    The angle of the spray cone can have a big impact on spray coverage. When the target is far away from the corresponding nozzle (e.g. the tops of nut trees), or the canopy is very, very dense (e.g. citrus canopies), consider tight-angled full cones under high pressure. This is inefficient and can give variable coverage, but it is sometimes the only option in extreme situations.
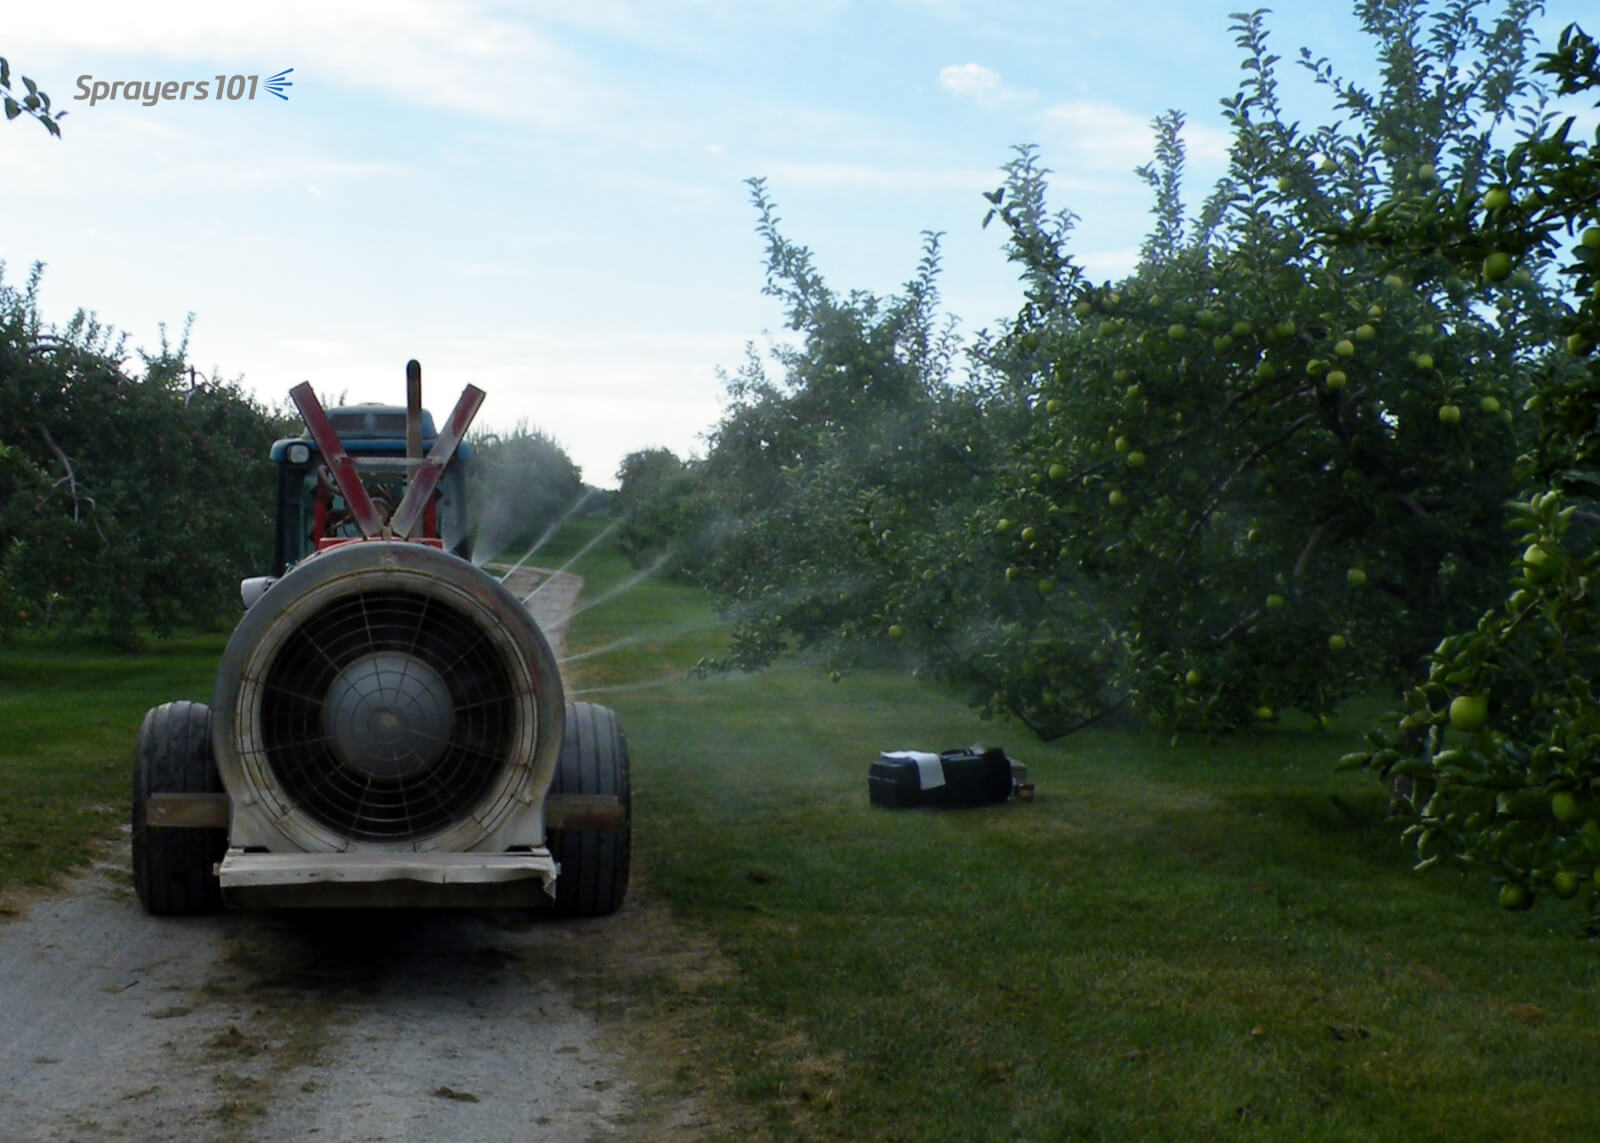
    Two hollow cone nozzles on top and five full cone nozzles below. Note the lack of spray overlap with the full cones for the first few meters. This would be a concern if the target were closer to the sprayer, such as grape or berry. Also note that the top two nozzles should not be on; their spray will likely not reach the intended target.
    Oops! Two hollow cone nozzles on top and five full cone nozzles below is the exact opposite of how things should be. Note the lack of spray overlap with the full cones for the first few meters. Spray from the top two positions will likely not reach the intended target.

    When the target is very close to the sprayer, full cones do not overlap and create undesirable striping or banded coverage. Creating a full, overlapping spray swath that spans the entire canopy is a function of nozzle spacing, distance-to-target, and sprayer air-settings. It can also be affected by humidity, wind speed and wind direction at the time of spraying.

    Confirm your settings by parking the sprayer in the alley between crops. With the air on, spray clean water while a partner stands a safe distance behind the sprayer to look for gaps in the swath. The partner will see things the operator’s shoulder check will not reveal.
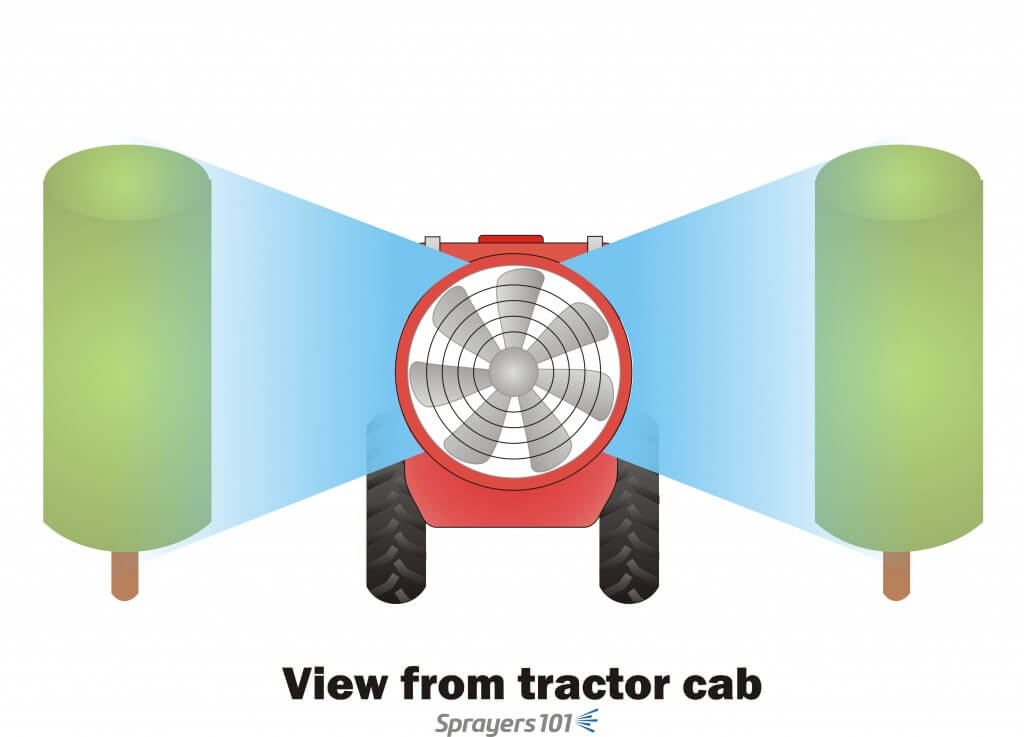
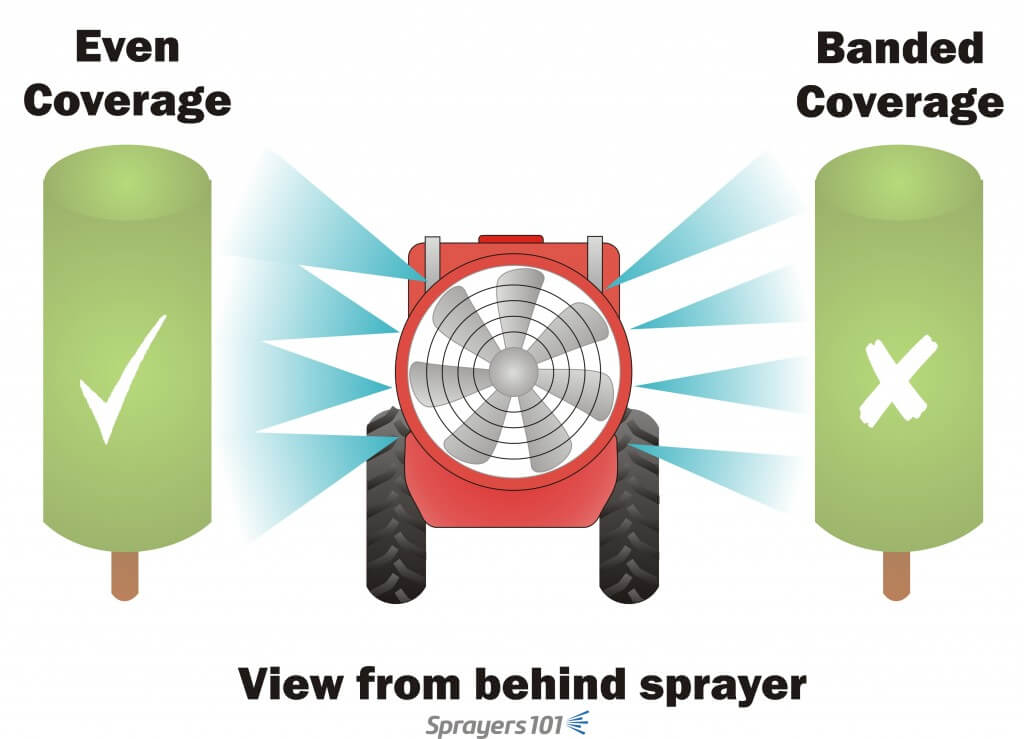
    Shoulder checks may not show you what’s really happening. Have someone stand behind the sprayer while spraying clean water to see the nozzle spray overlaps sufficiently to span the entire canopy.
    Here’s what the operator sees. But, shoulder checks may not show you what’s really happening. Have someone stand a safe distance behind the sprayer while spraying clean water to see the nozzle spray overlaps sufficiently to span the entire canopy.
    Shoulder checks may not show you what’s really happening. Have someone stand behind the sprayer while spraying clean water to see the nozzle spray overlaps sufficiently to span the entire canopy.
    Here’s what the partner standing behind the sprayer sees. Take a picture with a smartphone to show the operator.

    Nozzle tables can be wrong

    Sometimes nozzles do not perform per the nozzle table. We have discovered errors in published tables, worldwide. Here are the big three:

    • Conversion errors. Manufacturers publish catalogs in Metric and in US Imperial, but we have found many errors in the conversions.
    • Spray angle errors. When nozzles are operated at the extremes of their pressure ranges, spray angles deviate from those listed in the tables.
    • Flow rate errors. When tables are not updated to reflect changes in nozzle design, or the manufacturing process, actual flow rates deviate from those listed in the tables.

    Perhaps it’s not the table, but the nozzle itself. Most nozzle manufacturers accept a flow variability up to +/- 2.5% for new nozzles, but we have seen higher. It depends how they are made (machined, stamped, printed) and the material they are made of.

    Validate flow rate and pattern

    When errors are discovered and reported, the manufacturers can be slow to issue corrections and the errors will persist in old tables. Yes, even apps (which are often based on tables) can be wrong. So, predicted flow rates can prove unreliable. This is why it is important to double check by observing nozzle overlap and validating flow rate when you replace nozzles – even when they are brand new.

    Thanks to Dr. David Manktelow (Applied Research and Technologies, Ltd., NZ) for input into this article.

  • Airblast Calibration – Clearing up Confusion

    Airblast Calibration – Clearing up Confusion

    “Sprayer calibration is an important part of any crop protection program.” Everyone says so, so it must be important. But what exactly are they asking you to do, and why?

    When delivering presentations I often take the opportunity to ask audiences to define airblast sprayer calibration. Their responses cover a wide range of activities that can be rolled up into three related, but quite different, definitions:

    1. Sprayer maintenance inspection
    2. Adjusting sprayer configuration
    3. Validating sprayer output
    Ask a group of managers, sprayer operators, agrichemical reps, gov’t regulators and equipment manufacturers to define “calibration”. Be prepared for very different answers.

    Traditionally, calibration refers to Number 3: Validating sprayer output, but all three are required to ensure a safe, effective and efficient application. Don’t panic – your workload didn’t just triple.

    There is a time and a place for each of these activities. Some should be performed more often than others, but none of them are difficult. This is easier to accept when you realize that only a portion of the spray-day is actually spent spraying. Filling, travel time, cleaning and calibration-related activities are all essential components.

    Let’s consider each activity.

    Sprayer maintenance inspection

    This is more maintenance than calibration (e.g. is it properly connected, is it worn out, is it plugged, is it leaking?). It should not be confused with spring start-up or winterization. For those lucky readers in temperate regions, “winterization” is preparing the sprayer for long-term storage post season… we just use antifreeze.

    The maintenance inspection is the morning walk-around, no different from what any operator of heavy machinery must do before starting their work day. Learn more about sprayer inspection and download a helpful checklist in this article.

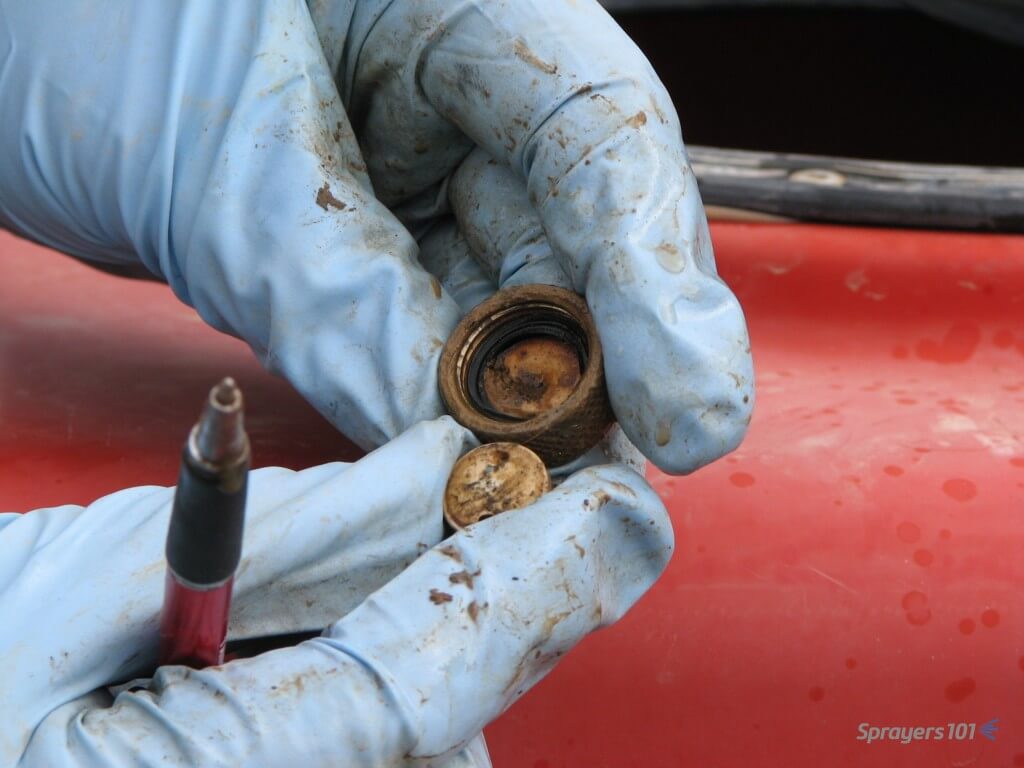
    Here are some nasty disc & cores revealed during a calibration workshop. It certainly explained the poor performance the operator was complaining about. Is it time to replace yours? Photo credit – Dr. H. Zhu, Ohio.
    Here are some nasty disc & cores revealed during a calibration workshop. It certainly explained the poor performance the operator was complaining about. Is it time to replace yours? Photo credit – Dr. H. Zhu, Ohio.

    Adjusting sprayer configuration

    This is an ongoing process whereby an operator makes minor sprayer adjustments (e.g. pressure, travel speed, air settings) to reflect environmental conditions, the product’s mode of action and the nature of the target. Would you apply an insecticide to semi-dwarf pears in high wind using the same sprayer settings to apply a fungicide to nursery whips in high humidity? I hope not.

    The process is more intensive at the beginning of the spray season and again around mid-season (e.g. petal fall or whenever the crop changes sufficiently to require a reassessment). It’s described step-by-step in many articles on this website as well as in Airblast101.

    Yes, it requires an investment of time and effort, but the feedback makes subsequent adjustments faster, easier and more intuitive. There are strategies to reduce the number of adjustments required. Large operations can assign sprayers to blocks with similar crop architecture (e.g. one sprayer works large orchards, another sprayer works young or high-density orchards). Smaller operations can change the order in which crops are sprayed.

    Validating sprayer output

    This accounting activity ensures the sprayer is applying the intended rate at the intended speed. “Sprayer math” is really only theoretical; It helps the operator plan for how much pesticide and water must go in the tank and how long the job will require. How the sprayer actually performs may be a different story.

    According to 1992’s “Tools for Agriculture” a horse can deliver 500 watts of power over 10 hours, but the camel can deliver 650 watts over six. Ontario might not employ camels for spraying, but the old adage still applies: “the right tool for the right job”. Photo Credit – R. Derksen, Ohio. Date and location of photograph is unknown.
    According to 1992’s “Tools for Agriculture” a horse can deliver 500 watts of power over 10 hours, but the camel can deliver 650 watts over six. And you thought establishing tractor speed was difficult. Photo Credit – R. Derksen, Ohio. Date and location of photograph is unknown.

    Validating output, or calibrating, confirms that each nozzle delivers the desired rate and that the sprayer travels at the desired speed, so the crop receives the correct dose with no unexpected left-overs or shortages.

    The operator should perform these activities at the beginning of the season and after any significant change to the sprayer set-up. Examples include new nozzles, new tractor tires, using a different tractor or after replacing a pump or any lines/hoses.

    The validation (i.e. calibration) process is explained in our articles on testing airblast sprayer sprayer output and travel speed.

    Conclusion

    Be sure to perform all three calibration-related activities as required. This will keep records up-to-date, improve your spray coverage, and save you from unexpected sprayer malfunctions – almost all of which are preventable.

  • Validate Airblast Output – Nozzle Calibration

    Validate Airblast Output – Nozzle Calibration

    Sprayer math is important. It ensures the operator applies the correct product rate and has enough to complete the job. But, it assumes the airblast sprayer is behaving as expected… and it often doesn’t. After confirming the airblast travel speed, use one of the following methods to assess sprayer output. There are pros and cons to each.

    The area method

    Operators that claim the sprayer empties in the same place every time assume everything’s alright. They are performing a variation on the area method.

    Essentially, you fill the sprayer with enough water to spray one hectare (or acre) and then spray that area. If the tank empties where expected, you know your output rate (i.e. volume / area). But, there are a few problems with this method:

    • Most operators don’t have an accurate test area marked off, and even when they think they know the area, measurements prove otherwise. They’re always amazed when this happens.
    • The area method has poor resolution. It reveals the total output but does not assess individual nozzles. For example, partially-blocked nozzles and worn nozzles average out (we’ve seen it). Rate controllers provide whatever pressure is required to match the desired output, masking individual nozzle problems.

    The dip stick method

    Another method is to fill the sprayer to a known volume using a flow meter, while observing a sight level or a graduated dip stick. Then, while parked, the operator sprays for a given amount of time and determines the difference in the volume remaining in the tank.

    This method can be defeated if volume is misread. It’s an easy error to make if the sprayer is parked on a grade, or the dipstick shifts in a tank with a rounded bottom. And, of course, it also masks individual nozzle problems.

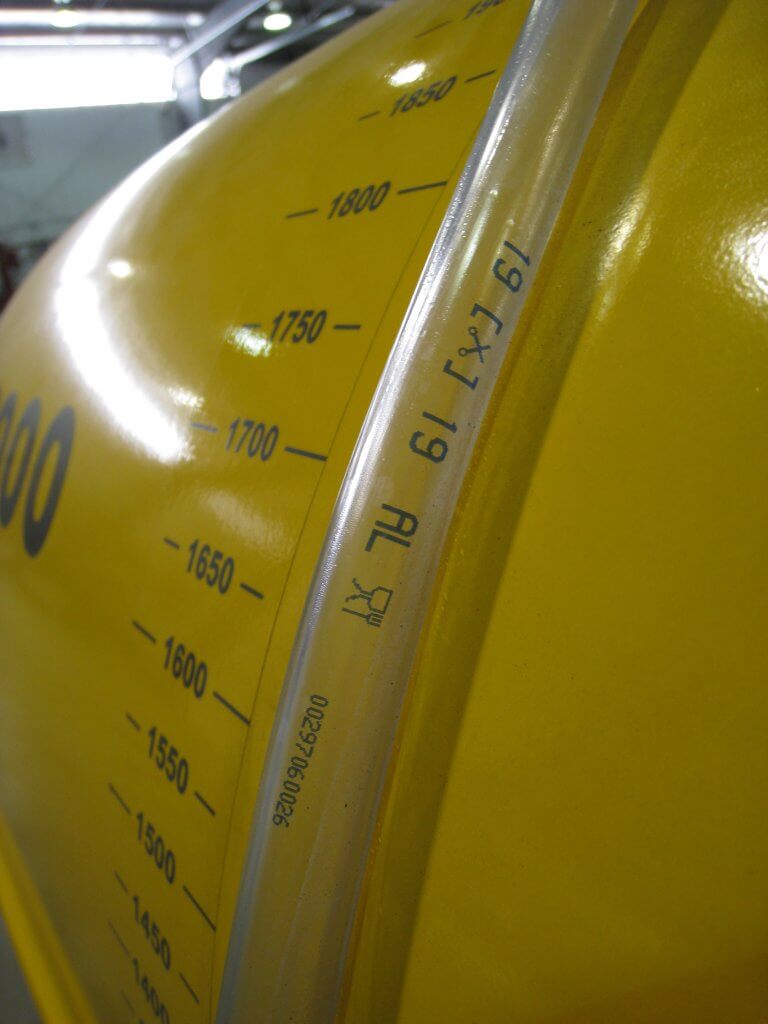
    Sight levels can be misleading when the sprayer is parked on a grade. They are often opaque and hard to read.

    The timed output method

    The preferred method is to measure the output of each nozzle individually. We performed a review on several timed output methods here. It can be messy and time consuming, but it’s accurate. Appropriate personal protective equipment is required to perform the timed output method – expect to get wet.

    1. Fill the rinsed sprayer half-full with clean water and park it on a level surface.

    2. With the fan(s) off, bring the sprayer up to operating pressure. Start spraying with all nozzles open (closing any will change the pressure).

    3. You will need 1 meter (3 feet) of 2.5 cm (1″) diameter braided hose (have a second, longer hose to reach the top of a tower sprayer). It should be stiff enough that you can slip it over a nozzle body while holding the other end. Use it to guide flow into a collection vessel, held with your other hand. The hose not only reaches the top nozzle on towers, but it lets foam dissipate before it gets to the vessel.

    4. When the flow from the hose is steady, direct it into the collection vessel for 30 seconds (a partner with a stopwatch is very helpful). It is preferable to collect for a minute because it improves the accuracy.

    5. Determine and record the nozzle output per minute. Graduations on plastic collection vessels are unreliable. It’s preferable to weigh the output on a cheap, digital kitchen scale. One milliliter of clean water weighs one gram. Don’t forget to subtract the weight of the vessel (this is called taring) and double the output if you only collected for 30 seconds.

    Interpreting the results

    Once you have recorded all the outputs, you will have to convert the output to U.S. gallons or liters per minute, depending on units in the nozzle manufacturer’s catalogue (see common conversions below).

    Replace any nozzles that are 10% (or preferably 5%) more or less than the rated output. This not only indicates a rate problem, but likely a problem with droplet size as well. If enough nozzles are worn, consider replacing all of them. Nozzles should go on as a set, and come off as a set (unless replacing a broken tip, of course). This can be an expensive proposition for large airblast sprayers, but it is part of operational costs.

    Don’t assume new nozzles are accurate. We’ve found +/- 5% flow variation right off the shelf. Keep your receipts.

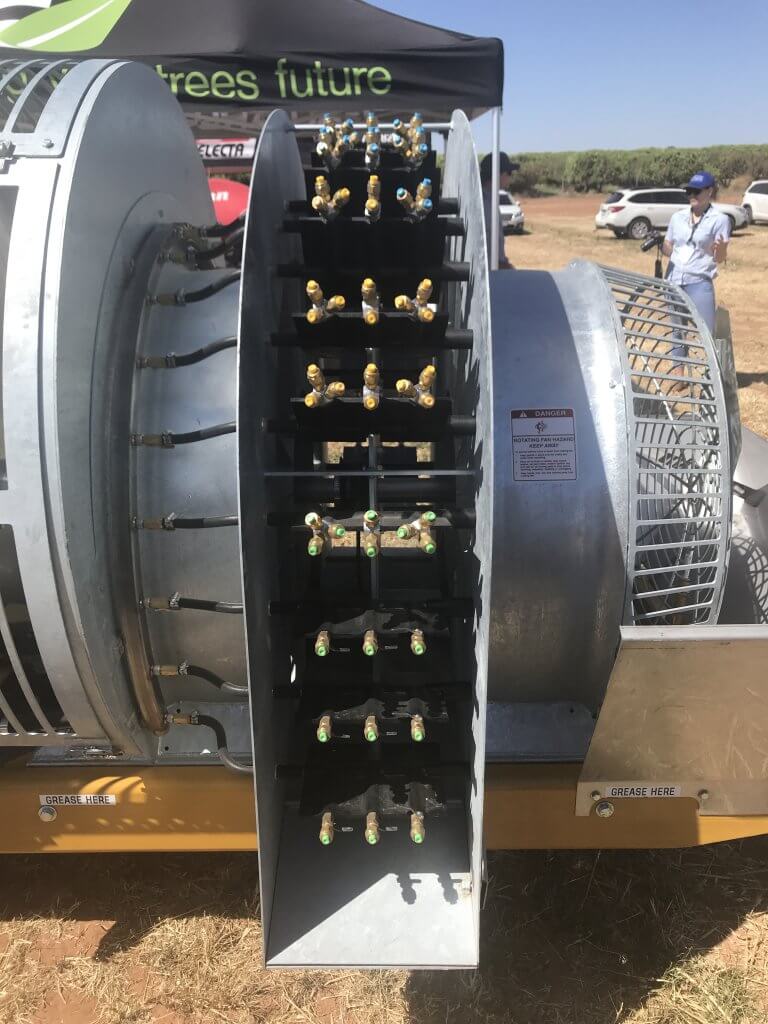
    Testing and replacing nozzles is an important part of sprayer operation, no matter how many there are. This Air-O-Fan is nozzled for Australian almonds.

    Helpful conversions

    Anyone that has tried the timed output method in Canada knows the pain of our Metric-esque (Mocktric?) units. We’re an odd hybrid because our label rates are in metric, but our nozzles and many of our sprayers are US Imperial. You can find a complete collection of conversion tables here, but the most common calculations are reproduced below:

    If collecting in ounces, converting to U.S. Gallons per minute:

    us-gallons-per-minute

    If collecting in millilitres or grams converting to U.S. Gallons per minute:

    us-gallons-per-minute

    If collecting in ounces, converting to litres per minute:

    liters-per-minute

    If collecting in millilitres or grams converting to litres per minute:

    liters-per-minute

    If collecting in ounces, converting to Imperial gallons per minute:

    imperial-gallons-per-minute

    If collecting in millilitres or grams converting to Imperial gallons per minute:

    imperial-gallons-per-minute

    A more sophisticated option

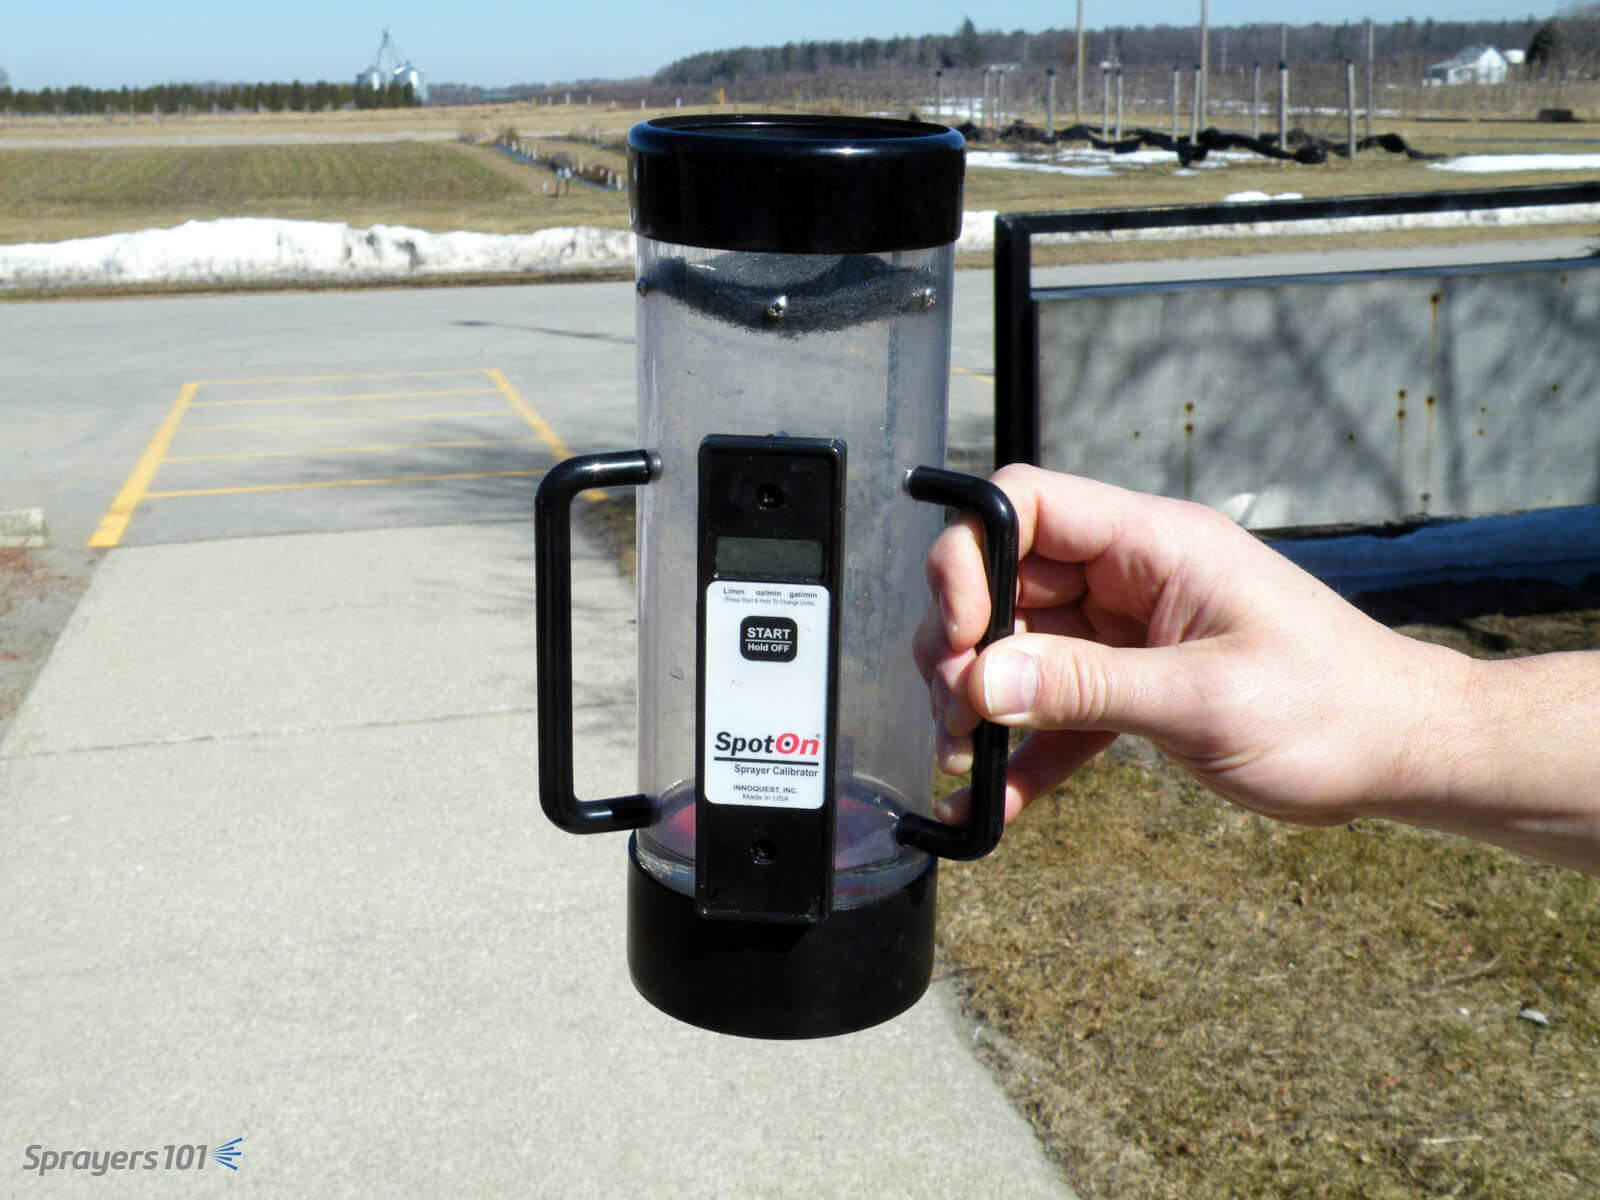
    The timed output method is slow and requires math. You can avoid both problems by using electronic calibration vessels like the Innoquest SpotOn SC-4. We’ve tested both, and they are as accurate as weighing the output – but much faster.

    They can, however, be fooled by foam. We’ve had good results using a length of braided hose to direct the flow and dissipate most of the foam. Typically, foaming means the sprayer wasn’t rinsed enough.

    The SpotOn SC-4 calibration vessel is much easier, faster and more accurate than the classic pitcher-and-stopwatch approach to timed output tests.
    The SpotOn calibration vessel is easier, faster and more accurate than the classic pitcher-and-stopwatch approach to timed output tests. The SC-4 (pictured) is for airblast and SC-1 is for field sprayers.

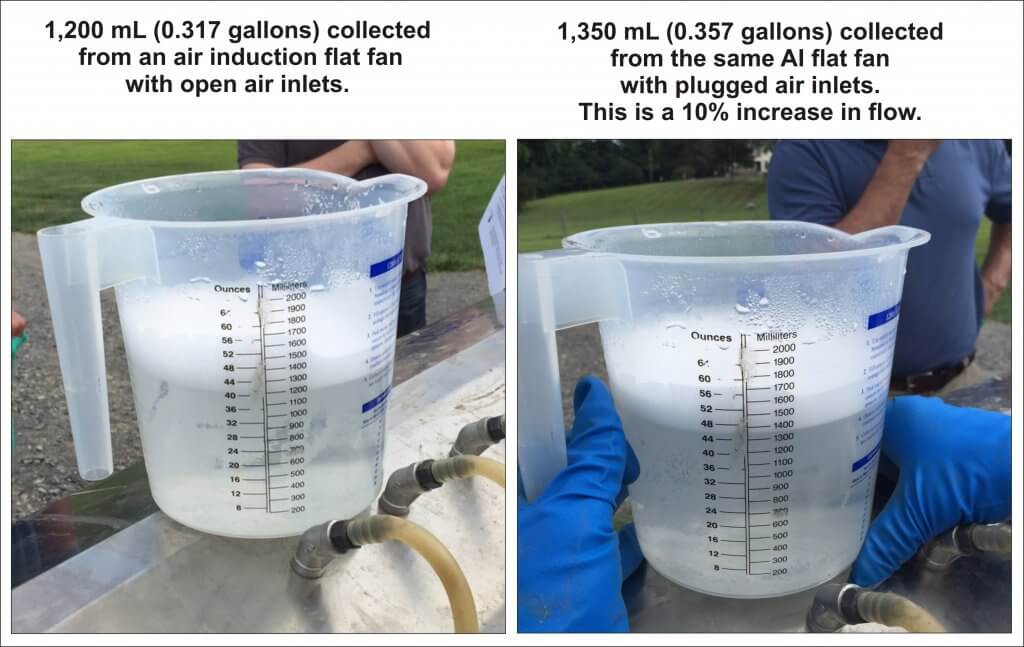
    Another approach is to hose-clamp multiple hoses over nozzle bodies and spray all at once. This is tricky and takes time. Plus, if you suffocate the nozzle’s exit orifice (creating back pressure) or block the air inlets on AI nozzles, you will get a false reading.

    Be careful not to plug air inlets on air induction nozzles – you may get a false reading.

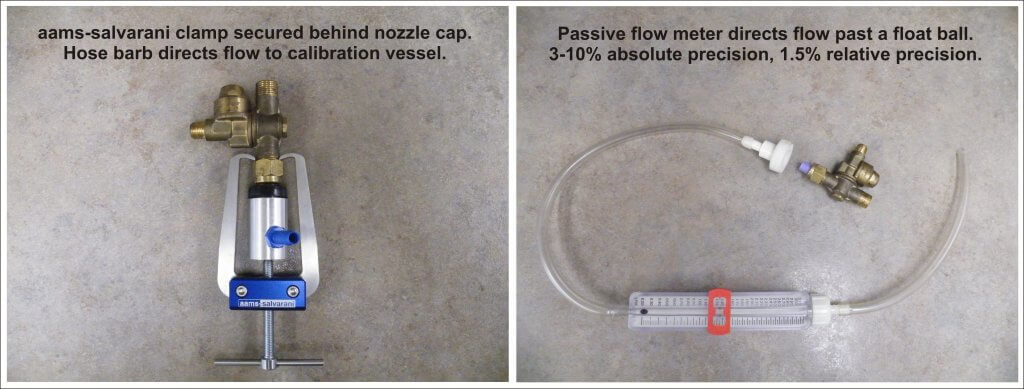
    We prefer nozzle clamps over hose clamps (see the AAMS-Salvarani nozzle clamp pictured below). There are pincers designed to latch behind the nut of the nozzle body, but compatibility can sometimes be an issue (e.g. with Turbomist sprayers).

    Passive flow meters (also pictured below) remove the need for a collection vessel, but they’re a better fit for field sprayers since they have to be held in place manually. They are difficult to source in North America because their accuracy is questionable, but they are fine for comparing relative flow from tip to tip.

    Nozzle clamp or flow meter, avoid suffocating the nozzle exit orifice or AI nozzle air inlets.

    2016_nozzle_flow_meters
    Left: Nozzle body hose clamp. Right: Passive flow meter.

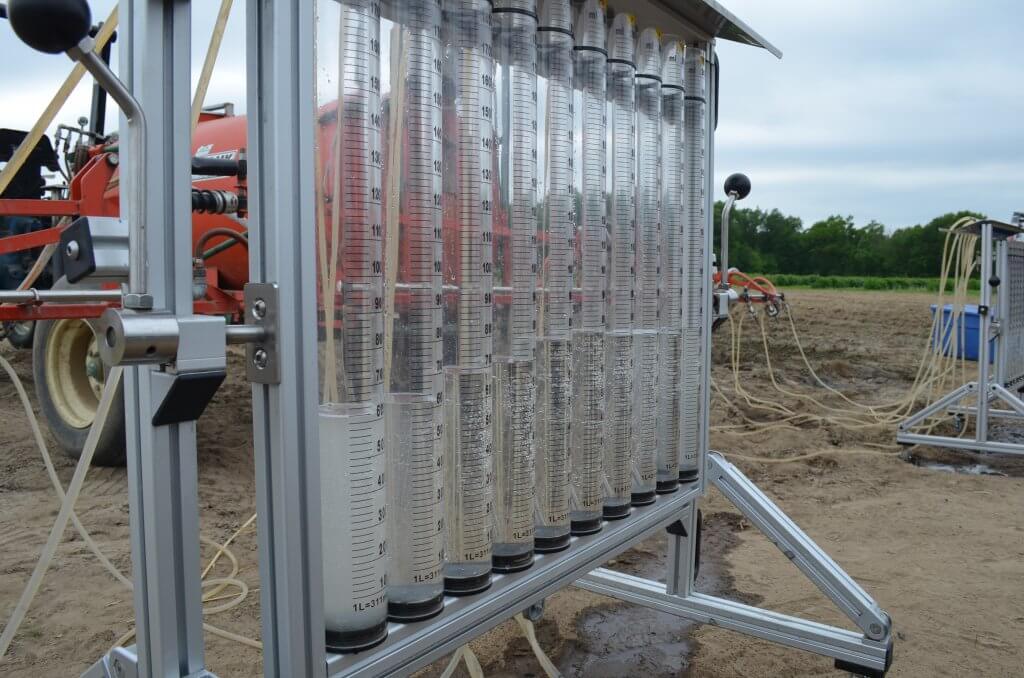
    Some grower groups, or professional consultants, spring for very sophisticated and accurate units, such as AAMS-Salvarani flow measurement system pictured below.

    AAMS-Salvarani flow measurement system. We used these on a pumpkin sprayer in New Hampshire, but they work with airblast too.

    No matter your preferred method, take the time to confirm your sprayer output at the beginning of the season and whenever you make repairs or significant changes to your sprayer.

  • How Low Can You Go?

    How Low Can You Go?

    Listen to an audio recording of this article by clicking here

    There’s a lot of talk about lowering the boom to reduce drift and make twin fan nozzles more effective. But how low can we actually go with a boom before striping becomes a problem?

    We’ve done some calculating and have come up with answers.

    First, a few guidelines. Tapered flat fan nozzles require overlap to generate a uniform volume distribution under the boom. Traditionally, we’ve recommended 30 to 50% overlap with fine flat fan sprays. The small droplets tended to redistribute to fill in any gaps that might occur.

    Overlap from fine sprays is less critical than from coarser sprays because the small droplets redistribute readily.

    The advent of low-drift nozzles changed that advice. This nozzle type produces fewer droplets overall, and, like all fan-style nozzles, puts the coarser ones towards the outside edges of the fan. These don’t redistribute.

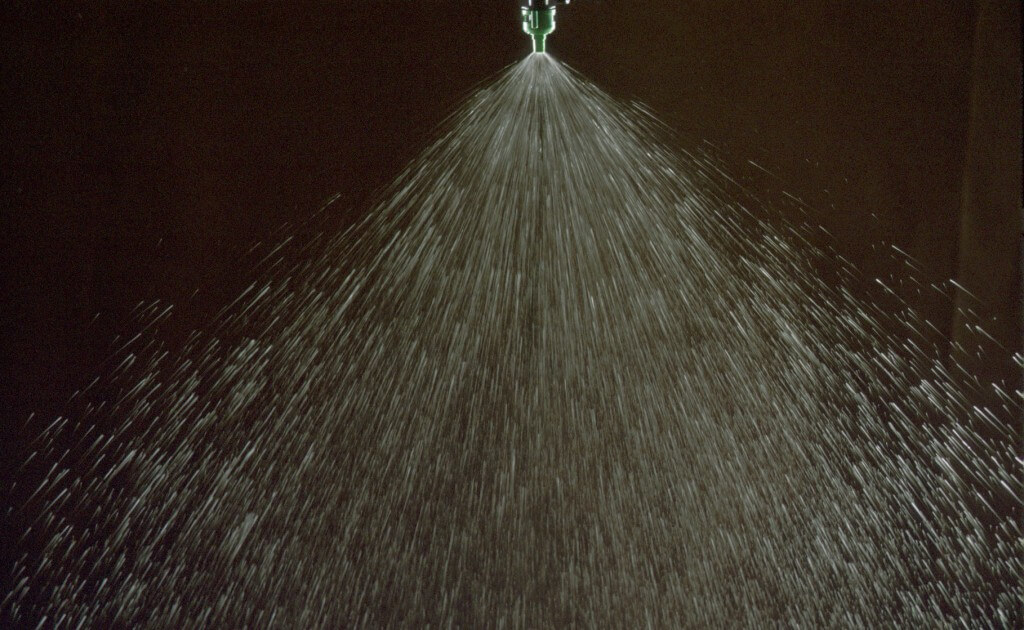
    A typical flat fan spray places the coarser droplets at its periphery, and the smaller ones in the middle. When only the outed edges overlap, that can creates a band of poor coverage.

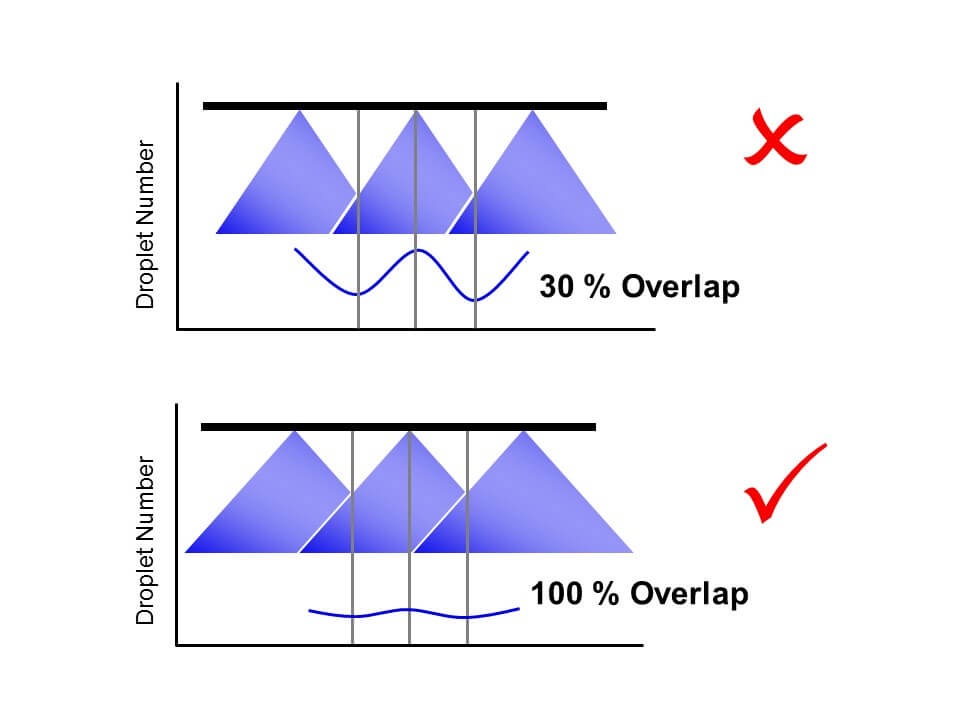
    When we had 30% overlap and these two edges met, a region of relatively few, coarse droplets was formed, and this region contained almost no small droplets. On a patternator, the volume distribution was still good. But when we measured the droplet density, we saw a deficit in coverage at the overlap.

    With low-drift nozzles, we need 100% overlap to distribute both small and large droplets uniformly under the spray swath. Too little overlap and we create bands of relatively few but large droplets that can cause striping.

    Since then, we’ve been recommending 100% overlap for low-drift sprays. This means that the pattern width at the target will be twice the nozzle spacing, and all regions under the boom receive droplets from two adjacent nozzles.

    With this adjustment, small droplets appeared throughout the spray swath, and striping was eliminated.

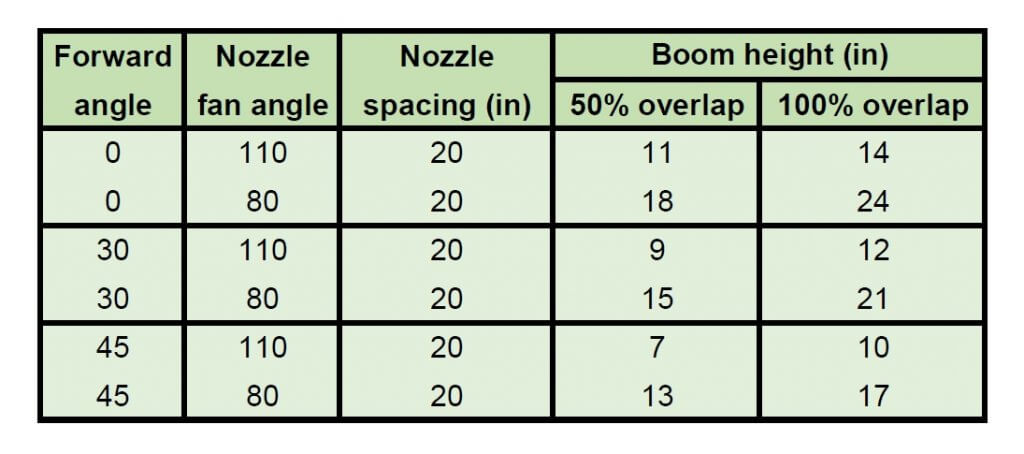
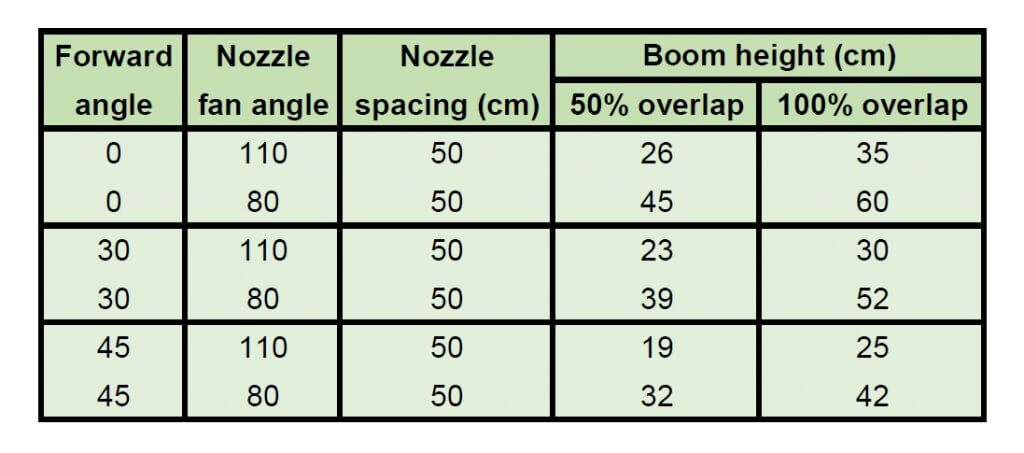
    That leaves the question, just how low can a boom be set without creating this problem? The following tables provide some theoretical numbers.

    Minimum boom heights for achieving 50% and 100% overlap of flat fan spray nozzles (US units)

    Minimum boom heights for achieving 50% and 100% overlap of flat fan spray nozzles (metric units)

    A word of caution: The advertised fan angle on a sprayer nozzle often differs in practice. Not only will it be slightly different by design, it also depends on spray pressure and tank mix. As a result, it’s best to do a visual check. Set the spray pressure to the minimum you expect to use. Inspect the spray patterns and set the boom height so that the edge of each nozzle pattern reaches to the middle of the next nozzle. That means your pattern width is twice the spacing and will give 100% overlap. No tape measure required.

    The tables were generated from a spreadsheet which can be downloaded here:

    • The values are theoretical and assume the fan angles are accurate. Some nozzles don’t produce the advertised fan angle. Enter your actual angle in the spreadsheet if you know it.
    • The theory assumes that the droplets at the edge of the fan always move in their projected direction. In fact, after some distance, say 50 to 75 cm, gravity pulls the droplets down and the pattern no longer widens at the same rate. The rate of pattern collapse depends on the droplet sizes.
    • Use the 0% overlap column to help with banding nozzle pattern width. Simply use the nozzle spacing column to enter your desired band width.
    • Note that angling the nozzles forward or backward decreases your minimum boom height, but depending on the deflection of the spray in the wind, this too has limits.
    • Too high a boom obviously increases drift. But patternation from overlap isn’t affected that much, largely because the pattern is now subject to aerodynamics and that becomes more important.

    Pro Tip: Attach a length of plastic hose or a large zip tie to the boom, cut to your minimum boom height. This makes it easier to see what your boom height is, from the cab or the ground.

    The bottom line is that a boom can be quite low and still allow excellent overlap and pattern uniformity from the nozzles. Yet we all know that most sprayer booms can’t reliably operate that low because they don’t control sway well enough. The ball’s in your court, sprayer manufacturers!

  • Boom Heights at Fan Angles Worksheet

    Boom Heights at Fan Angles Worksheet

    Use this spreadsheet to calculate the minimum boom heights needed for various applications.

    Some caution:

    • The values are theoretical and assume the fan angles are accurate. Some nozzles don’t produce the advertised fan angle. Enter your actual angle in the spreadsheet
    • The theory assumes that the droplets at the edge of the fan always move in their projected direction. In fact, after some distance (say 50 to 75 cm, gravity pulls the droplets down and the pattern no longer widens at the same rate. The rate of pattern collapse depends on the droplet sizes.
    • Use the 0% overlap column to help with banding nozzle pattern width. Simply use the nozzle spacing column to enter your desired band width.
    • Note that angling the nozzles forward or backward decreases your minimum boom height, but depending on the deflection of the spray in the wind, this too has limits.
    • Too high a boom obviously increases drift. But patternation from overlap isn’t affected that much, largely because the pattern is now subject to aerodynamics.