Determining an ideal airblast sprayer travel speed using the “Air Displacements” method

Posted on

About Jason Deveau (Spray Guy)

Dr. Jason Deveau has been the OMAFA Application Technology Specialist since '08. He researches and teaches methods to improve the safe, effective and efficient application of agricultural sprays in specialty crops, field crops and controlled environments. He is the co-administrator of Sprayers101, co-author of the Airblast101 Textbook, a slow cyclist and an even slower runner.

See all posts by Jason Deveau (Spray Guy).

The concept of Air Displacements was developed by Dr. David Manktelow, Applied Research and Technologies Ltd.

What is the “right” speed to drive when spraying?

Airblast sprayer operators must know their average travel speed to calculate how much pesticide and time is required to complete a spray job. Note that it’s an average, not a constant, because travel speed is significantly affected by ground surface conditions (e.g. slippage), grade (e.g. hills) and the weight of the rig (e.g. as spray mix is depleted).

The pursuit of productivity and the unchallenged status quo of traditional spray volumes, blinds many operators to the fact that travel speed is a critical factor in focusing air energy on the target canopy. As long as droplets are small enough to be entrained and directed by the air, we believe that optimizing the fit between air energy and the target canopy leads to the most frugal and effective use of spray mix and should therefore dictate travel speed. If that speed proves to be painfully slow, or terrifyingly fast, then a mismatch is revealed between the sprayer design and the operational conditions and the overall spraying strategy should be reconsidered.

This article describes a method for modelling an ideal travel speed. It can be used as a sanity check for existing operations or for those seeking to evaluate the fit of a new airblast sprayer. However, this method can only approximate travel speed. A true optimization of sprayer settings will require fine tuning using the ribbon method and, ultimately, coverage feedback from water sensitive paper (see here and an older article here). We’ll begin with how to measure average travel speed.

How to measure average travel speed

Beware the tractor speedometer or rate controller that monitors wheel rotations; both can be fooled by changes in wheel size, tire wear or slippage. GPS or radar-based speed sensors are the most accurate method.

Those that prefer a manual method can follow this classic protocol for determining average travel speed:

  1. Go to a row that is representative of the terrain in your planting. Measure out a distance of 50 m (150 ft) and mark the start and finish positions with wire marker flags.
  2. Fill the sprayer tank half full of water.
  3. Select the gear and engine speed in which you intend to spray. If using a pull-behind sprayer, ensure the PTO is running or you could introduce errors.
  4. Bring the sprayer up to speed for a running start and begin timing as the front wheel passes the first flag. This is far easier when there are two people.
  5. Stop the timer as the front wheel passes the second flag.
  6. Stay out of any ruts and run the course two more times.
  7. Determine the average drive time for the three runs (i.e. the sum of all three times in seconds divided by three).
  8. Finally, calculate travel speed using one of the following formulae, depending on preferred units:

Ground Speed (km/h) = Average drive time for 50 m (s) ÷ 13.9 (a constant)

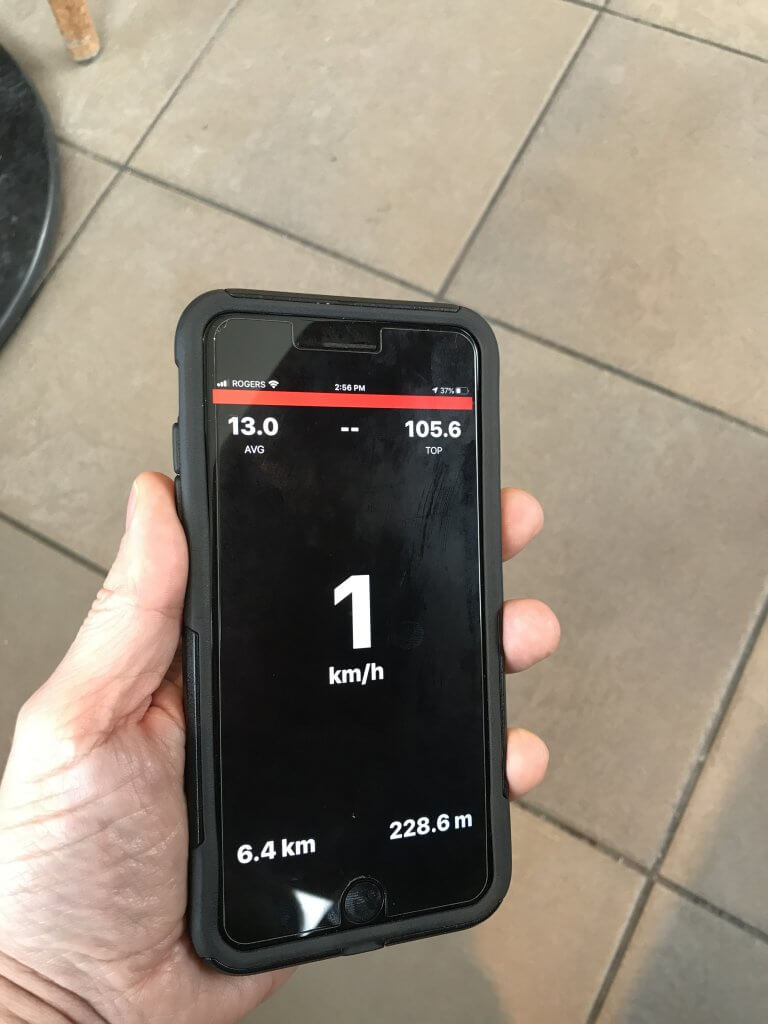
Those that prefer a less accurate but convenient hack can download any smartphone speedometer app that can calculate an average (similar to a runner’s GPS wristwatch). Fill the sprayer tank half full and drive a representative section of your operation with the fan on and the spray off. Consult the phone for your average speed for each pass. Take a screen shot and email it to yourself as a time-stamped component of your spray records.
The “Air Displacements” method

Dwell time

Airblast sprayers use fans to move a volume of air at a certain speed, often measured in m3/hr or ft3/min. Imagine that volume of air as a three dimensional shape extending from the air outlet over a distance. Likewise, imagine the void between the sprayer outlet and the target canopy as a three dimensional shape penetrating roughly halfway into that canopy (assuming we intend to spray every row).

How long must the sprayer dwell in one spot before it pushes all the intervening air out of the way and replaces it with spray-laden air? If the sprayer drives too slowly, it will wastefully push spray through and beyond the target (i.e. blow-through). If the sprayer moves too quickly, the spray will not have an opportunity to penetrate the target canopy and most certainly not reach the highest point. This concept of focusing air energy using travel speed is called Dwell Time.

We want to calculate the volume of air the sprayer generates, compare that to the volume we want displaced, and then determine how fast we must drive to optimize the fit. We can do all this with a tape measure, an anemometer, and a partner to record the data and do a little math.

1. Measure air outlet area

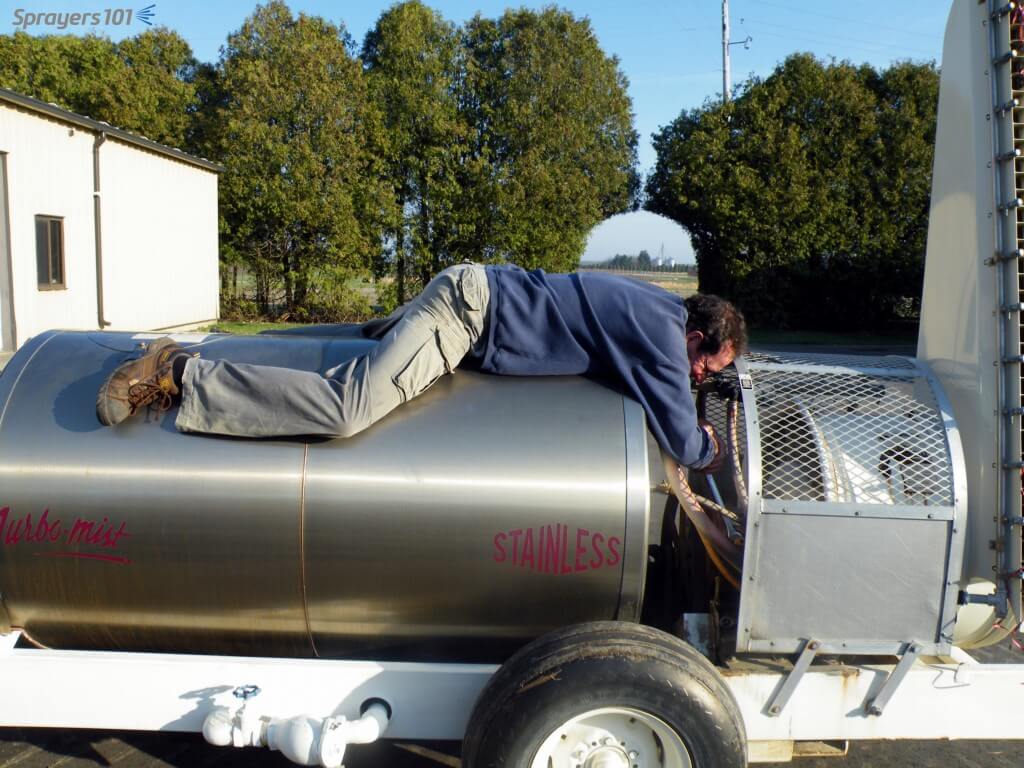
With the sprayer safely off, measure the area of the air outlet(s) on one side of the sprayer. We’ll use a Turbomist 30P Low Drift Tower (below) as an example. There are two air outlets that are 5 cm wide by 150 cm high for a total area of 0.075 m2 on each side. Be sure to look inside the outlet for any irregularities like baffles or obstructions intended to block air. Subtract those areas from the total. Don’t worry about small things like nozzle bodies.

For rectilinear outlets: Height (m) x width (m) = Area (m2)

For circular outlets: 3.14 x radius2 (m) = Area (m2)

The air outlet on this Turbomist 30P Low Drift tower sprayer is 5 cm wide by 150 cm tall for a total area of 0.075 m2.

2. Measure air speed

First, a few safety warnings: High speed air is loud and can carry debris, so always wear ear and eye protection and respect the hazards inherent to working with air-assist sprayers. Only use an anemometer rated for at least 160 km/h (100 mph) (e.g. here). Do not use a handheld weather meter such as a Kestrel because the impellor could be destroyed and become dangerous shrapnel.

Use an anemometer rated for at least 160 km/h (100 mph) (e.g. here). Do not use a handheld weather meter such as a Kestrel because the impellor could be destroyed and become dangerous shrapnel.

Bring the fan up to speed and holding the meter about 25 cm (10 in.) from the outlet, measure the air speed at several locations along the air outlet both vertically and horizontally. We calculate an average speed because many air outlets do not produce uniform air speed or volume along their outlets. For this example, we measured four locations along the air outlet on both sides of the sprayer and saw significant differences. We did this both in low and high gear (see table below).

High GearHigh GearLow GearLow Gear
Location Along OutletLeft Side (m/s)Right Side (m/s)Left Side (m/s)Right Side (m/s)
Top 1/441.180.342.924.6
Upper34.932.226.430.8
Lower30.830.024.026.4
Bottom 1/433.540.226.831.3
Average35.145.730.028.3
Anemometer readings from the low drift tower sprayer outlets, on left and right side, in high and low fan gear. Four readings from bottom to top to determine the average. Readings taken 25 cm from edge of outlet and PTO set to 540 rpm.

Multiple air outlets

Before we continue with the method, let’s change sprayers to this Turbomist 30P Grape Tower (below). The design is intended to spray adjacent rows from the vertical outlets (5 cm x 150 cm = 0.075 m2) along the tower. The upper, inverted outlets (10 cm x 63.5 cm = 0.0635m2) throw spray over the adjacent rows and cover the outside rows. The intention is to improve productivity by covering four rows of grape (or possibly three) per pass.

The Turbomist 30P Grape Tower Sprayer is a multirow system intended to drive every third or fourth row.
Lower, vertical ducts are 5 cm x 150 cm = 0.075 m2
Upper, inverted ducts are 10 cm x 63.5 cm = 0.0635m2

However, when we consider this design through the Air Displacement lens, it’s almost like having two sprayers performing two jobs simultaneously. The vertical outlets and the upper, inverted outlets are different shapes. Further, their position (distance and angle, as the top outlets are angled back more aggressively) relative to their respective target canopies are significantly different. How fast must this sprayer drive to optimize the fit? Do we have to compromise coverage and incur drift and waste from one set of outlets to accommodate the other set? The manufacturer has worked to address this potential issue by partitioning the majority of the air energy to the top outlets, but let’s see how that affects travel speed.

3. Total volumetric flow

Having already measured the outlet area, we then measured average air speed (see table below).

High GearHigh GearLow GearLow Gear
Location Along OutletLeft Side (m/s)Right Side (m/s)Left Side (m/s)Right Side (m/s)
Top Outlet27.026.527.026.0
Bottom Outlet12.013.010.512.5
Average anemometer readings (n=4) for top and bottom outlets, on left and right side, in high and low fan gear. Readings taken 25 cm from edge of outlet and PTO set to 540 rpm.

Now we can use these two values to determine how much air the sprayer generates by calculating total volumetric flow. We first have to convert air speed from m/s to m/h to make the units work, so just multiply it by 3,600. Then we multiply that by the outlet area and we get the table below.

Average air speed (m/s) x 3,600 (a constant) = Average air speed (m/h)

Average air speed (m/h) x Outlet area (m2) = Total volumetric flow (m3/h)

High GearHigh GearLow GearLow Gear
Location Along OutletLeft Side (m3/h)Right Side (m3/h)Left Side (m3/h)Right Side (m3/h)
Top Outlet6,172.06,058.06,172.05,944.0
Bottom Outlet3,240.03,510.02,835.03,375.0
Total volumetric flow for top and bottom outlets, on left and right side, in high and low fan gear, with PTO at 540 rpm.

4. Target volume to displace

Now that we know the volume of air the sprayer generates, let’s determine the volume of air we need to replace with that spray laden air. This is really the only tricky bit because you have to picture a cross section and then measure the shape. See the illustration below.

For the bottom outlet, it’s simple. The outlet is 81 cm from the grape panel and the grape panel is 112 cm high. We calculate the area of a rectangle by multiplying length by width, so:

Length (cm) x Width (cm) = Area (cm2)

However, the sprayer design makes the top outlet’s job trickier to figure out. This isn’t a rectangle, it’s a “quadrilateral”. We get this odd shape when either the sprayer outlet or the target canopy are significantly taller than the other. Fortunately this one has a right angle so we don’t have to brush off our high school trigonometry textbooks. Instead, we can lean on the internet using this link and plug in the values. As we can see below, the cross sectional areas spanning from the outlets and the middle of the target canopies are 0.9 m2 for the bottom outlet, and 2.35 m2 for the upper outlets.

This gives us a cross sectional area, but we need to convert that to a volume so we can compare the air generated to the air needed. To do that, we multiply the cross sectional area by 100 m, representing how much air would be needed over 100 m of row length. The formula and the results are presented below.

Cross sectional area (m2) x 100 m of row length = Target displacement volume (m3)

OutletTarget Displacement Volume (m3)
Top Outlet235.0
Bottom Outlet90.0
Target displacement volume for each outlet over 100 m of canopy row.

5. Displacement rate

We see the target displacement volumes for each outlet are significantly different. Assuming the air from the upper outlet maintains its integrity and reaches its target canopy without being blown off course, it must produce enough air energy to fill more than twice the displacement volume of the lower outlet. We can see from the earlier calculations that it does produce almost twice the total volumetric flow. But is it enough? To know we must calculate the Displacement Rate for each outlet. Let’s just focus on the left side of the sprayer in high gear.

Total volumetric flow (m3/h) ÷ Target Volume (m3) = Displacement Rate ( displacements/h)

OutletDisplacement Rate (displacements/h) for left side of sprayer in high gear
Top Outlet26.25
Bottom Outlet36.0
Displacement rates for the outlets on the left side of the sprayer in high gear.

So we see that the outlets at the top of the sprayer, if stationary, could displace the target volume of air 26.25 times an hour. However, the lower outlet would displace its target volume 36 times in that same hour. We see that we might have a problem. But this is for a stationary sprayer and not a sprayer in motion. The last step gives us what we came here for.

6. Ideal travel speed

We can now determine the ideal travel speed for this sprayer using that same 100 m row length.

[Displacement rate (displacements/h) x 100 m of row length] ÷ 1,000 (a constant) = Ideal travel speed (km/h)

OutletIdeal travel speed (km/h) based on left side of sprayer
Top Outlet2.6
Bottom Outlet3.6
Ideal travel speed for each outlet on the left side of the sprayer in high gear.

As we stated at the beginning of this article, this is only a model. It doesn’t account for canopy density and assumes the spray laden volume of air produced by the sprayer can reach the target intact over a given distance. However it does indicate that there is a potential issue that will lead to either over spraying the adjacent row (slower travel speed) or under spraying the distant rows (faster travel speed) which could lead to waste, drift and poor coverage.

In the image below, we chose to drive close to 2.6 km/h in high gear. No effort was made to adjust the liquid flow (i.e. change the nozzles) so there was too much spray volume here, but we can see the losses on the left (upwind) side, and the blow-through three rows over on the right (downwind) side. Leaving aside the excessive liquid volume, we could drive faster or reduce the fan gear to reduce the blow-through on the adjacent rows, but we may go too fast (or reduce the rate of air displacement) for the upper outlets to reach the target. We can already see the integrity of the upper-left outlet breaking down as it sprays into the wind.

Testing a travel speed. No effort was made to adjust liquid flow, which is excessive here. Cross wind was from the left to the right in the image. Photo by Corey Parker (Instagram: _parkerproductions)

Take home

An ideal travel speed for an airblast sprayer is more than just being productive. The spray must reach and penetrate the target. If this requires dangerously high speeds, or if you simply can’t move slowly enough, it suggests a problem with the spraying strategy. Changes will have to be made to the sprayer, the target canopy, or even the weather conditions you’re willing to spray in. Getting the job done quickly should not compromise the quality of the job. Use this method to re-evaluate your practices, or to assess the capabilities of candidate sprayers if you’re considering a new purchase. Be sure to confirm what this model is telling you using some coverage indicator, such as water sensitive paper.

Happy spraying.

Author

  • Jason Deveau (Spray Guy)

    Dr. Jason Deveau has been the OMAFA Application Technology Specialist since '08. He researches and teaches methods to improve the safe, effective and efficient application of agricultural sprays in specialty crops, field crops and controlled environments. He is the co-administrator of Sprayers101, co-author of the Airblast101 Textbook, a slow cyclist and an even slower runner.

    View all posts