Category: Rates and Calibration

For basics category

  • Methods for Testing Nozzle Flow Rate

    Methods for Testing Nozzle Flow Rate

    Calibration should be a regular practice for every operation that uses a sprayer. Part of that process is confirming that each nozzle is operating within the manufacturer’s specifications. This is a must for researchers that adhere to Good Laboratory Practices and for custom operators that sell their services. But we didn’t just fall off the turnip truck… we know nobody else does it. In fact, we’re surprised when we hear an operator HAS checked their nozzle flow.

    And we get it. It can be awkward and time consuming. A field sprayer with 72 nozzle bodies and three nozzles in each position has a whopping 216 nozzles. A tower-style or wrap-around airblast sprayer has fewer nozzles, but the operator needs a ladder to reach them all and they don’t point straight down, so a tube must be used to guide the spray into a collection vessel.

    And when pressed, any operator that does not regularly check their nozzles counters by saying “my tank empties in the same place every time, so why check them?” Even if the sprayer does start to go further on a tank, the operator can speed up or adjust the rate controller to drop the pressure a little.

    Fair enough. This isn’t a hill we choose to die on.

    But we will say that nozzles worn by even a few percent don’t only cause a change in flow rate, but may indicate a deteriorating spray quality and spray geometry. And, when one (or a few) nozzles are worn and others are not, it’s the same as when a single nozzle is plugged – the operator won’t be able to tell from the cab because the rate controller tends to mask the problem. And, if using PWM to apply a simultaneously reduced broadcast rate, perhaps the issue is amplified? All of this impacts coverage uniformity.

    We’ll get off our soapbox now.

    Over the years we’ve encountered many methods for determining a nozzle’s flow rate. We wanted to try each of them and characterize their accuracy, precision, time required, and ease of use. This is not a ranking where we wanted to find “The Best” method. The best method depends on your situation. If you’re a researcher, then accuracy and precision may trump time and expense. If you’re a custom applicator, then perhaps time is the critical factor. And if it’s your own operation, perhaps expense matters most. It’s up to you.

    Method

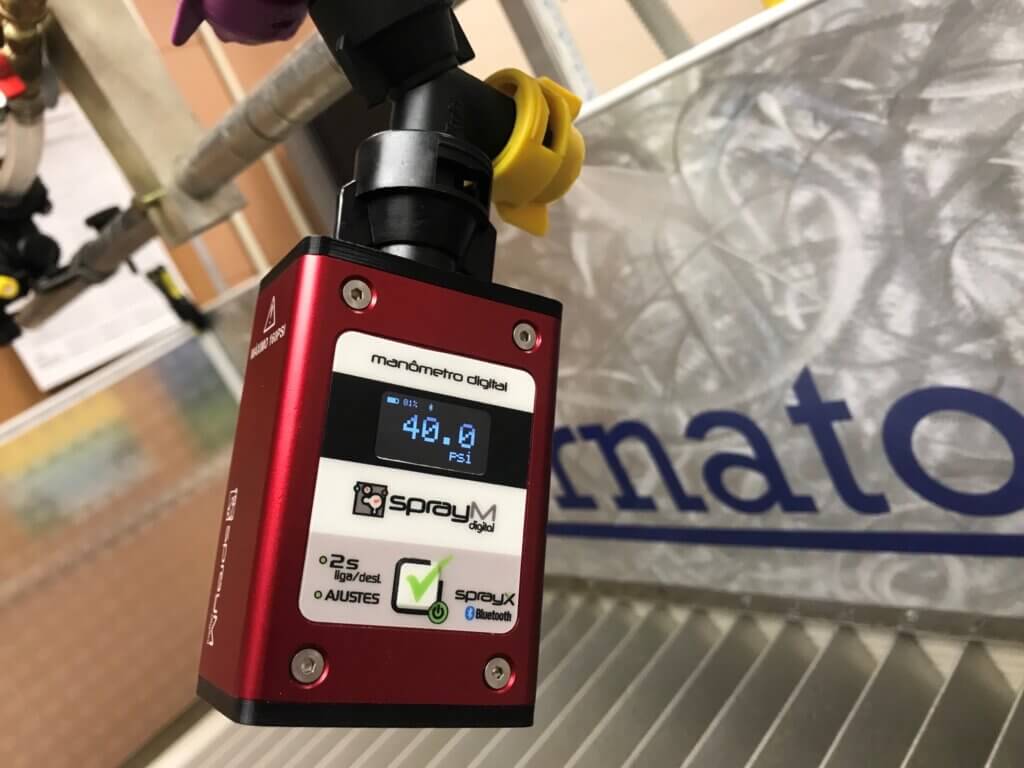
    The following tests were performed on a spray patternator table. A single nozzle was operated by a ShurFlo 2088-594-154 positive displacement pump. Pressure was set using a bypass regulator and an analog pressure gauge, confirmed by a SprayX digital manometer positioned under the nozzle body via a splitter. Room temperature water was used.
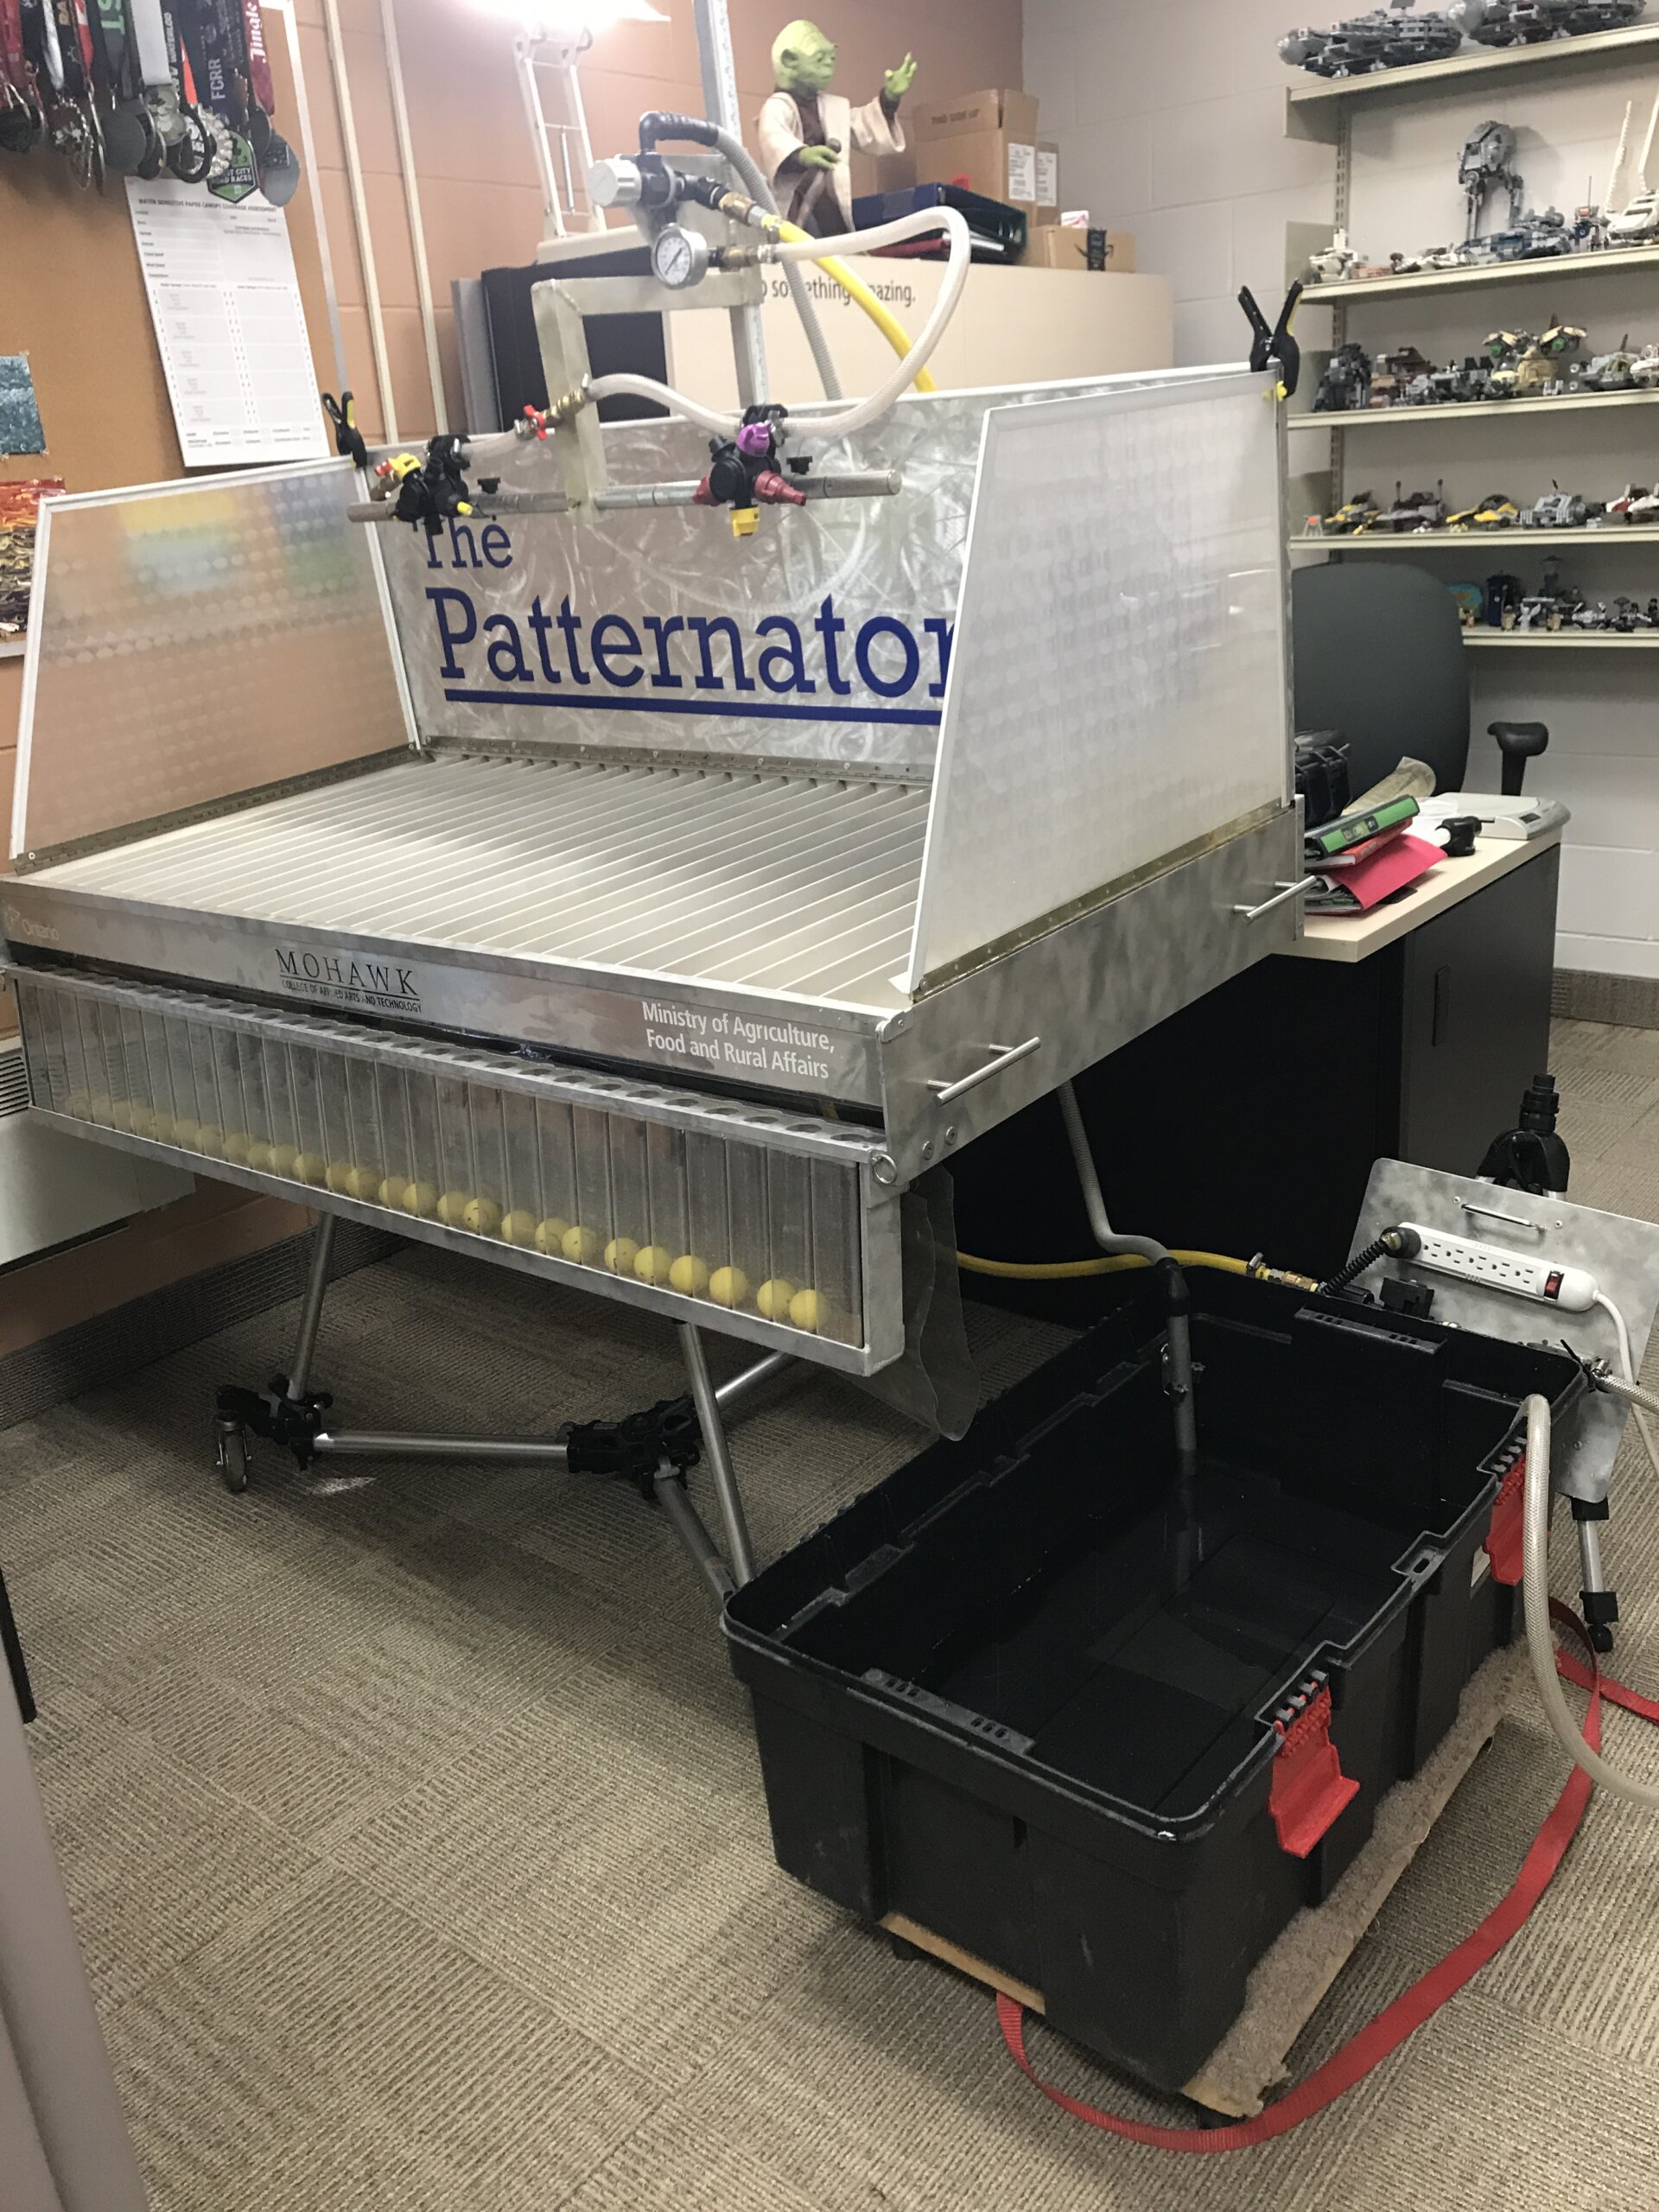
    “Patty” the spray patternator table. Designed and constructed by Mohawk College, Brantford, Ontario.
    Digital manometer on a splitter parallel with the test nozzle.

    We tested ten nozzle flow rate measurement systems. There are others out there, but we limited the selection to farmer-oriented systems and not those used in mandatory government inspections.
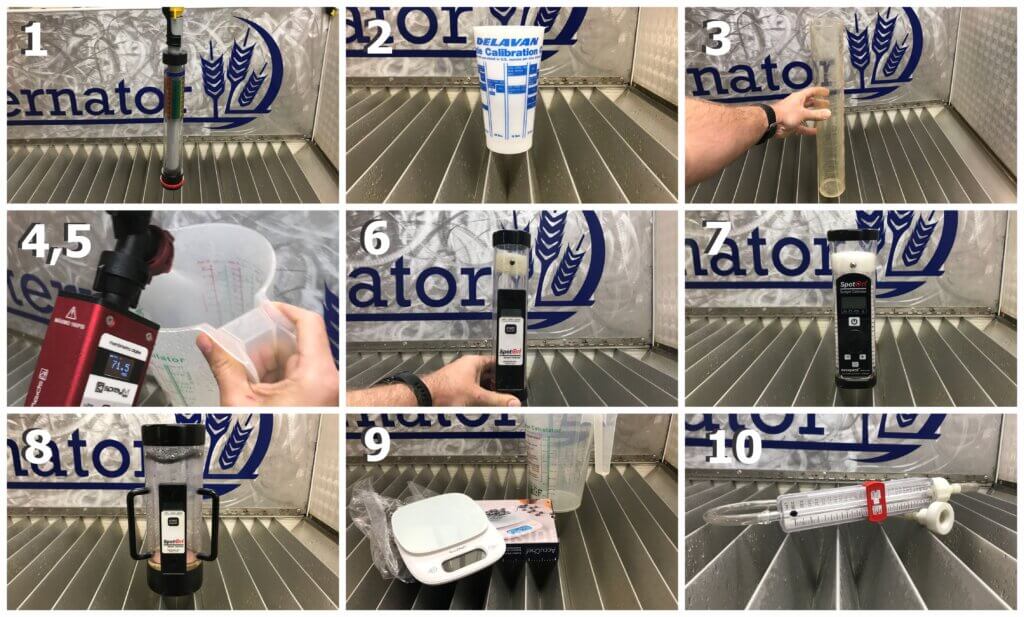
    1. Billericay Flowcheck
    2. Delavan Calibration Cup
    3. Graduated Cylinder
    4. Greenleaf Calibration Pitcher
    5. SprayX SprayFlow Turbo
    6. SpotOn SC-1
    7. SpotOn SC-2
    8. SpotOn SC-4
    9. Weighed Output
    10. Lurmark McKenzie Calibrator

    Three samples were taken from a new TeeJet XR8004 at ~40 psi and three samples taken from a new TeeJet AIXR11004 at ~70 psi. An exception was made for the Billericay Flowcheck which specified 43.5 psi (3 bar) for all sampling. All systems were emptied or dried as much as their design permitted between samples.

    All data was converted to gallons per minute and the flow measured was compared to the calculated flow for the nozzle and pressure used. For example, if the manometer read 38 psi for the 8004, then the formula 0.4 x (38 psi ÷ 40) 0.5 gives us a calculated flow of 0.39 gpm. If the method reported 0.41 gpm, then it would be off by +5.1%.

    Results

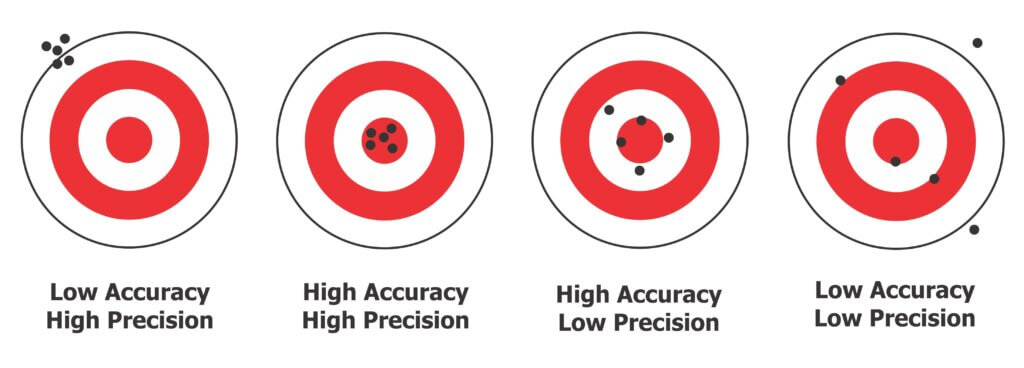
    Consider the accuracy and the precision of each system when you review the results. Remember that precision means you get the same result with very little variation while accuracy means that on average you get the correct result. And, for context, remember that most recommend changing a nozzle when it is 10% more than the ideal flow rate. We prefer 5%, and if three or more nozzles are off spec, replace them all as a batch because they’re likely all very close. Compared to most spraying costs, a set of nozzles is not worth quibbling about. Some operators just change them annually and don’t bother with testing at all.
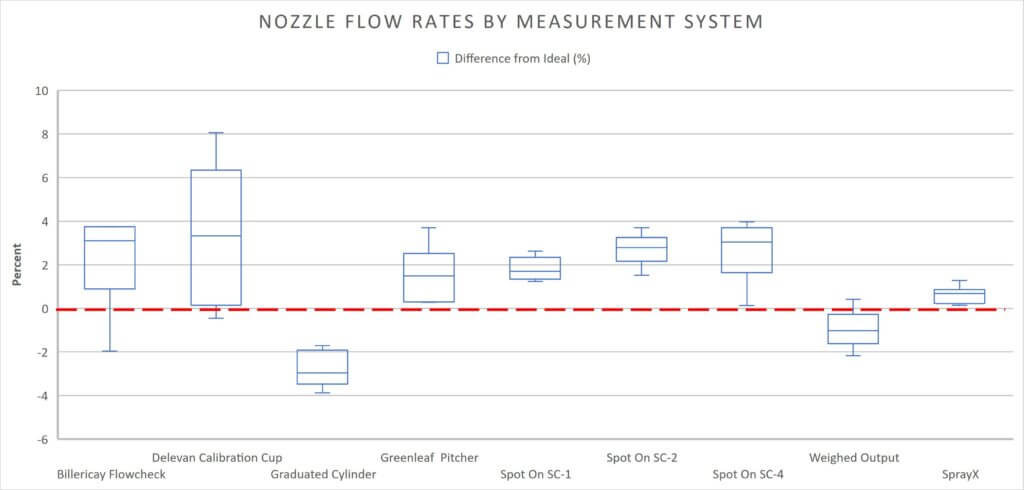
    Billericay Flowcheck: This is a passive measurement system. You must select the nozzle size on the bottom of the collector and suspend the unit from the nozzle body. It’s designed for a horizontal boom and you’d have trouble using it with any other sprayer. You also have to set the pressure to exactly 43.5 psi (3 bar). While fairly accurate, it spanned about +/-2.5% off ideal. You have to read from the right scale, which in this case was red and rather difficult to read because of the low contrast. It took about two minutes to reach equilibrium for each reading and a lot of liquid is lost during the process.
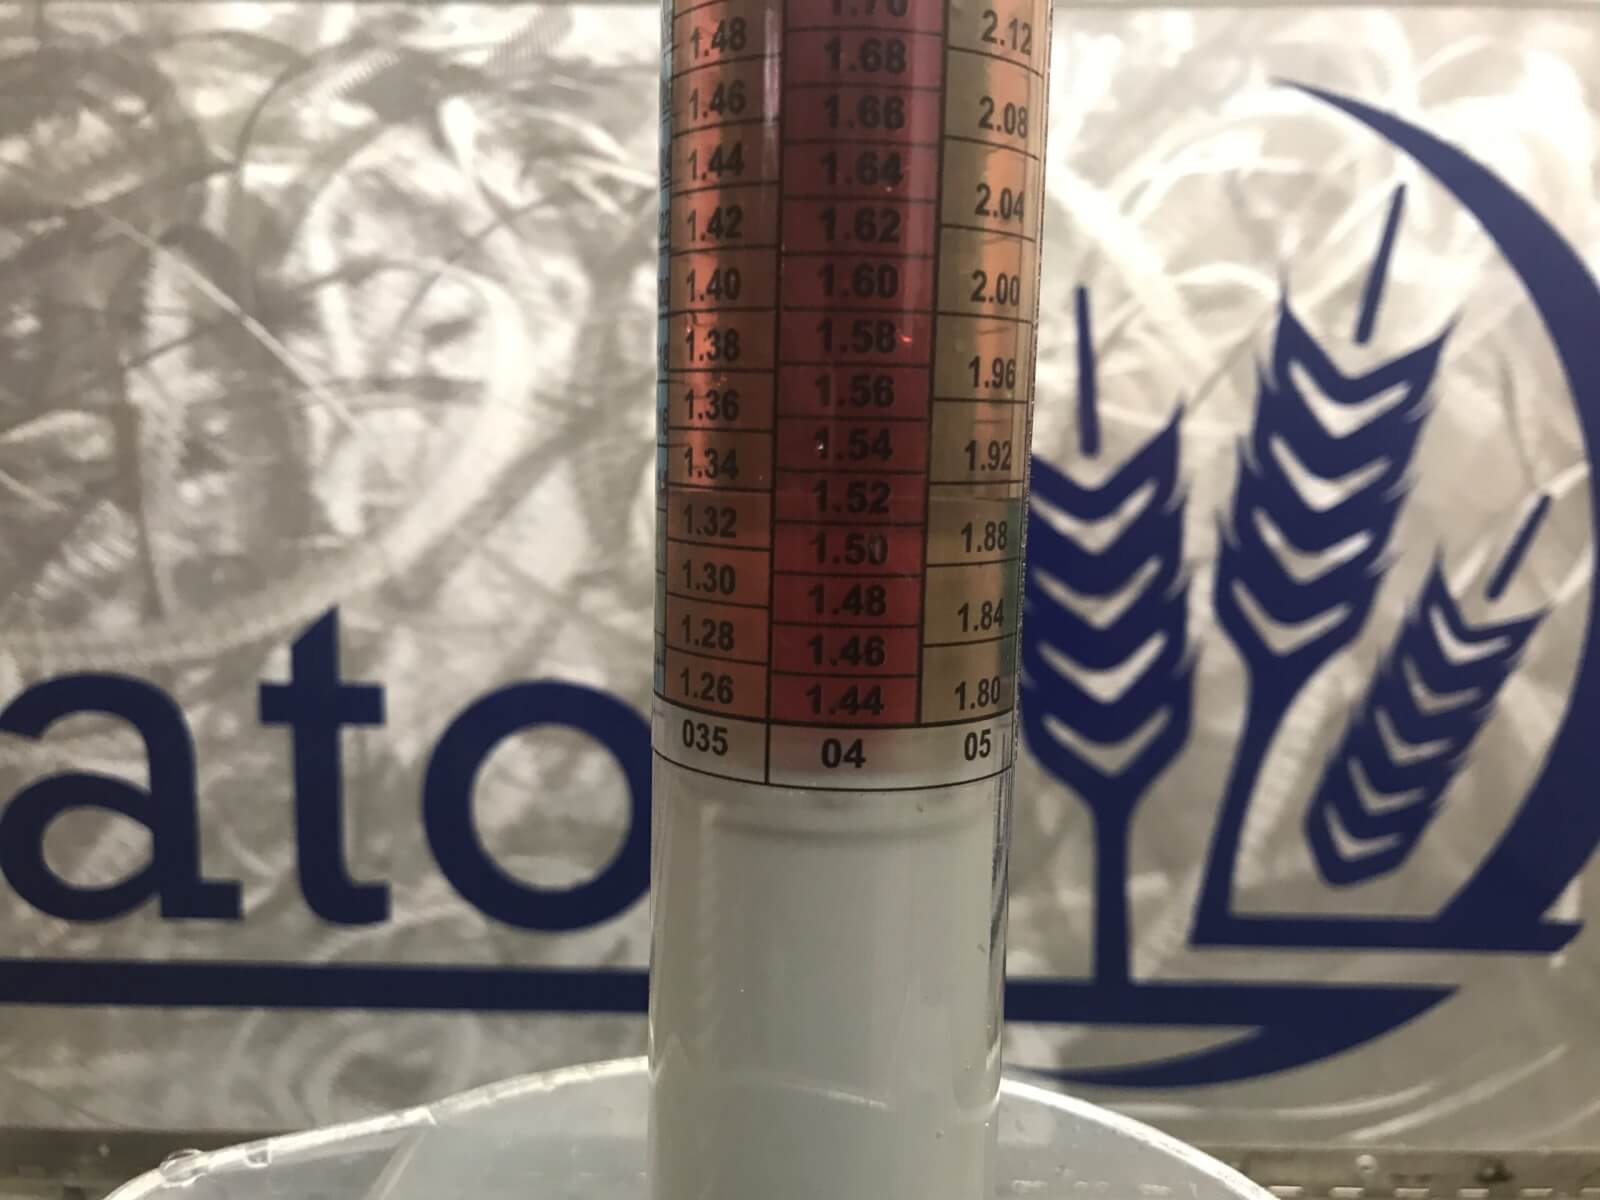
    We attempted to keep the unit plumb so the meniscus and scale aligned correctly. We found it difficult to read the ’04 scale because of low contrast. Pictured is 1.53 lpm.

    Delavan Calibration Cup: This small, one-handed plastic cup had a scale printed on the outside. We were limited to a 15 second collection because of how quickly it filled. Some spray was lost to mist and bounce and we used the “Fluid Oz” scale to get the highest resolution from the measurement. It took less than a minute to collect and read from the cup, but had the lowest precision and accuracy.

    Graduated Cylinder: There was little or no mist or bounce from escaping spray during collection. Our 1,000 ml graduated cylinder took 30 seconds at 40 psi and 20 seconds at 70 psi to fill making it roughly one minute per reading. A few light taps removed bubbles and once the liquid settled we could read the level. This must be performed on a level surface (in our case we used the digital level app on our iPhone). This was a very precise method, varying by less than 2%, but it wasn’t very accurate. We may have introduced error when reading the meniscus (always read from the centre) or perhaps the plastic distorted over time and affected accuracy. It may be difficult for most people to get a high quality, scientific-grade graduated cylinder.

    Greenleaf Calibration Pitcher: The pitcher had multiple scales but once again we used fluid ounces because it had the highest resolution. With the highest capacity, we were able to collect for an entire minute. Despite holding the vessel at different angles and distances, we lost a lot of spray to mist and bounce and the nozzle body was beaded with water at the end of each trial. After tapping the vessel to remove bubbles and reading on a level surface, it took about 1.5 minutes per sample and averaged an average 3% more than the calculated ideal flow rate.

    Innoquest Spot On Digital Calibrator: We’ll discuss all three Spot Ons together. The Spot Ons were a game-changer in North America when they first came out. You can read a peer-reviewed article about the SC-1 by Dr. Bob Wolf et al. published in 2015 in the Journal of Pesticide Safety here. The SC-2 is a new version of the SC-1 with added digital features that allow the user to calculate gallons per acre and it indicates tip wear based on the 10% industry standard . The most important improvements were a reduced sensitivity to foam and a thicker foam diffuser to reduce the chance of errors. The SC-4 works exactly like the SC-1, but has a larger capacity intended for high flow rate nozzles (e.g. hollow cones on an airblast sprayer). In each case, the Spot On will report in several units, and must be held steady under the nozzle flow (i.e. not moved during reading). The SC-1 and 2 took less than 12 seconds for each reading and the SC-4 took closer to 30. The SC-1 and SC-2 were relatively precise but read consistently higher than the calculated flow rate. This may be an artefact given that the units only read to 2 decimal places and this may have exaggerated any error. The SC-4 was the least accurate and precise of the three. The Spot Ons were the fastest and easiest to read of the methods used.

    Weighed Output: This method is based on the fact that 1 ml of water weighs one gram. Spray was collected for 30 seconds and weighed on a new, $25 CAD digital kitchen scale, which was tared (i.e. the weight of the vessel subtracted from the overall weight). While subject to errors from manual timing, it has the merit of removing the challenge of reading a meniscus and it’s relatively inexpensive. This method was precise and relatively accurate compared to the other methods used. It took about a minute per sample.

    SprayX SprayFlow Turbo: This was the most sophisticated method we used. The kit comes with a digital manometer, a flowmeter and a digital scale. It works though a smartphone app (screenshot below). You first have to set up a virtual sprayer, informing the app how many sections and nozzles will be tested. Then you must calibrate the flow sensor by taking three measurements versus a weighed output to eliminate possible variations caused by the nozzle, pressure, temperature, and the density of the liquid. The app walks the user through each step. This method took the most time to set up (easily 10 minutes). However, once it was set up, each nozzle could be tested in less than 30 seconds apiece. This method was the most accurate and precise, but the price may place it out of reach for the typical user.
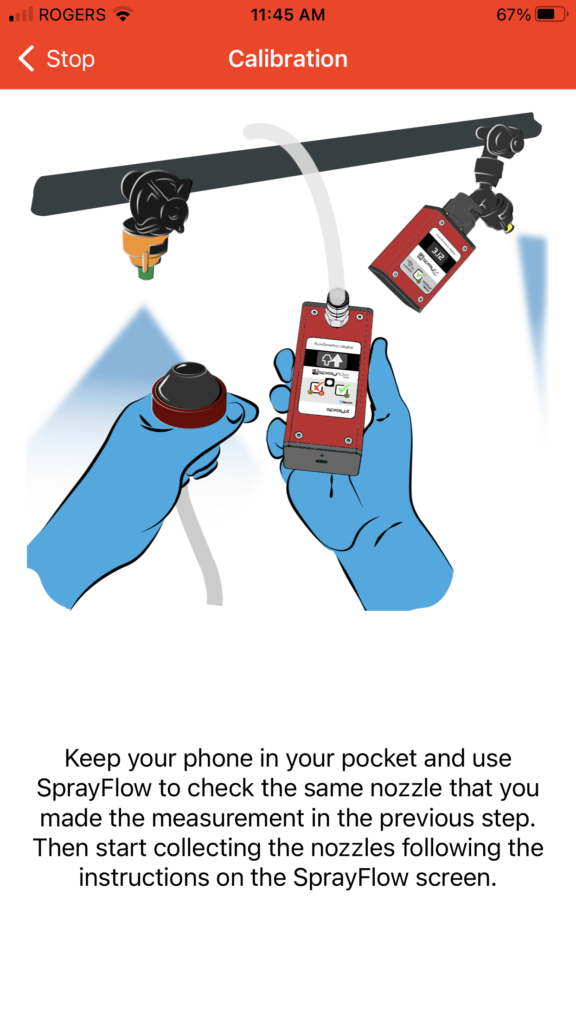
    Screenshot from the SprayX SprayFlow app.

    Lurmark McKenzie Calibrator: This method is not reported in the box-and-whisker plot because there were significant problems that prevented accurate readings. It was difficult to get a seal over the nozzle and the floater ball would either stick or fluctuate. After several attempts, this method was abandoned.

    Conclusion

    In order to test if a process, or a thing, is occurring or produced within acceptable limits, we need a detection system with a high enough resolution. In manufacturing (e.g. factory production) this is an essential requirement in quality assurance. Let’s consider a +10% deviation from the nozzle’s ideal flow rate to be our indication that a nozzle needs to be replaced. We need a measurement system with an appropriate scale and one with sufficient precision to ensure we don’t get a false reading. Based on our data, I would suggest all systems reviewed, save the measurement cup, are viable. Even if we elect to use a more stringent rejection threshold of 5%, some systems are more precise than others (i.e. less variability), but all but the cup should still be sufficient.

    What’s the penalty for not testing, assuming we’re not talking about significantly deviant nozzles? Let’s say, for example, we are not using a rate controller and we are applying 20 US gpa at 12 mph using 72 nozzles on 20″ centres. Our boom would have to spray 58.2 gpm, which means each nozzle would have to emit 0.81 gpm. If those nozzles sprayed 5% more than intended, we’d be spraying 21 gpa instead of 20 gpa. That means for a 1,200 gallon sprayer, you’d do 57 acres instead of 60. We would have the same result if we dropped from 12 mph to 11.45 mph, which is about 5% slower. Maybe that’s a big deal for your operation, or maybe not. For most, 5% is well within the typical error inherent to spraying. Then again, perhaps it’s more important to know that each nozzle is performing in a manner similar to its neighbours to ensure the highest degree of coverage uniformity.

    Ultimately, it is important to ensure you’re as efficient as possible, and that means understanding what your nozzles are doing so you can decide if-and-when it’s time to replace them. Pick whichever method makes it easiest for you to justify testing your nozzles and do it at least once a year when you take your sprayer out of long term storage.

    Thanks to all the companies that donated or loaned their calibrators to make this article possible.
  • Calibration – “The Fundamental Relationship”

    Calibration – “The Fundamental Relationship”

    The Fundamental Relationship, a concept by Professor D. Ken Giles (Emeritus), UC Davis Biological and Agricultural Engineering Department, is a way of talking about calibration without numbers and formulas. It is valuable for teaching concepts important to calibration. Since it is a relationship, it describes the variables needed and how they relate to each other.

    The Fundamental Relationship:

    Application Rate (gallons/acre) = Flow rate (gallons/minute) ÷ Land rate (acres/minute)

    We see here that land rate is inversely proportional to application rate. Thus, when land rate (either speed or swath width or both) are increased (and no other factors change), application rate is decreased. Likewise, flow rate is directly proportional to application rate. Thus, when flow rate is increased (and no other factors change), application rate is also increased. When flow rate is decreased (and no other factors change), application rate is also decreased.

    The Fundamental Relationship is also a good way to do the math of calibration because nothing needs to be memorized. As long as the units are checked, you can’t go wrong. The Fundamental Relationship works for any sprayer calibration, as long as the units are tracked correctly and the flow rate correlates to the land rate, i.e., the land rate used is the swath that the nozzles (flow rate) are covering.

    So, if the flow rate (GPM) used in the formula is for ½ of an airblast set up, the swath width in the land rate calculation would be ½ of the row width. If, for example, it is for a weed sprayer with 2 nozzles, the swath width would be the width the 2 nozzles are covering. Remember to think about this as what area is being covered by the spray:

    • Flow rate units are straight forward: gallons/minute.
    • Land rate can be a bit tricky because no one thinks in terms of acres covered per minute.
    • Land rate is tractor speed × swath width covered by the nozzles used to calculate flow rate.

    Land rate in the above needs to be calculated in the units “ac/min”. Since there are 43,560 ft2 in an acre, the easiest way to calculate is to use the swath width in feet, and the speed in ft/min. Multiplied, this then will give you land rate in ft2/min, which can then be converted to ac/min.

    Using MPH as Speed

    When you measure speed in the field, those who have a speedometer on their tractor will tell you their speed in MPH. To go from a land rate with speed as MPH to ac/min, the following unit conversion is used when multiplying the speed in MPH times the swath width in feet:

    1 mile/5,280 feet × 43,560 ft2/1 acre × 60 minutes/1 hour = 495
    Land rate (ac/min) = (Speed (mph) × swath width (ft)) ÷ 495

    Note: speed should always be measured and verified. Speedometers are notoriously incorrect!

    Calculating nozzle flow rate (GPM):

    You can also use the Fundamental Relationship to calculate the flow rate needed for a desired spray volume (application rate) when you have a set land rate (speed and swath width). This is necessary to help you choose your nozzles. Tractor speed is first determined by checking the coverage-using water sensitive paper or another coverage indicator like kaolin clay, and the fan (using ribbons in the canopy), to go as fast as safely possible while still getting adequate coverage. Swath width for any given field is set. What is left then is to calculate the GPM needed to achieve that application rate at that speed and swath width. This will allow you to select your nozzles based on individual nozzle GPM for a certain pressure.

    The Fundamental Relationship becomes:

    Flow rate (gallons/min) = Application rate (gallons/acre) × Land rate (acres/min)

    This is the flow rate for the ENTIRE sprayer (both sides, correlating to the swath width):

    GPM = GPA × Land rate

    OR if using MPH for speed:

    GPM = GPA × [(Miles/Hour × swath width (ft)) ÷ 495]

    To get the required GPM for one side of the sprayer, you multiply by ½:

    GPM (one side of sprayer) = GPA × [(Miles/Hour × swath width (ft)) ÷ 495] × 1/2

    GPM (one side of sprayer) = GPA × [(Miles/Hour × swath width (ft)) ÷ 495]

    I’ve seen some folks round up the 990 to 1,000, which makes the above formula easier to remember.

    Why I think the “495 formula” is bad for calibration

    In my experience of teaching calibration math, folks often want to fall back on the formula they have used instead of trying the Fundamental Relationship. The problem I have with the “495 or 990” formulae, is that with using ground speed in MPH, often the step of measuring speed, a critical step for optimizing spray coverage, is eliminated.

    Ground speed is assumed, the speedometer is assumed to be correct, and the entire step of measuring and setting speed is omitted-big mistake! Setting speed using flagging tape in the canopy and looking at the “Fan : Speed : Canopy” interaction is probably the most important step of calibration and optimizing coverage. So, if you must use the “495 formula”, please actually measure your ground speed!

    Measuring speed manually

    Typically, at least 100 feet are marked off to measure actual speed with a stopwatch. If you measure actual tractor travel time for a 100 foot length, you will likely find most common spraying speeds are timed in seconds. These can be converted to minutes, and then used in the formula for speed as ft/min which is then multiplied by the swath (or row) width in feet to obtain ft2/min, which can then be converted to ac/min.

    For example, at 3 MPH, you are travelling:

    3 mph × 5,280 ft/1 mile × 1 hour/60 minutes = 264 ft/min

    If swath width is 6 feet, the land rate (or area the nozzles are covering) is calculated as:

    264 ft/min × 6 ft = 1,584 ft2/min

    In acres covered per minute, we divide by 43,560 ft2/ac to obtain a land rate of 0.036 ac/min. To travel 100 feet at this speed, it takes 0.37 minutes or 22.7 seconds. So, it is not uncommon to time 100-foot tractor runs in 21-23 seconds (which is why you need a good stopwatch). These runs are best done on the type of terrain to be sprayed; and it’s always good to take several times and average.

    Remember that the speed is written as distance travelled/time. Sometimes when measuring speed, I’ve noticed that it will be written as time/distance travelled, which gives the wrong number. Track units!

  • Broadcast Boom Nozzle Spacing

    Broadcast Boom Nozzle Spacing

    North American built boom sprayers have nozzle spacings of 20” (50 cm in the rest of the world), but other spacings such as 15” (37 cm) and 10” (25 cm) also exist. What are the reasons for these alternative spacings and do they offer any inherent advantages?

    Why spacing matters

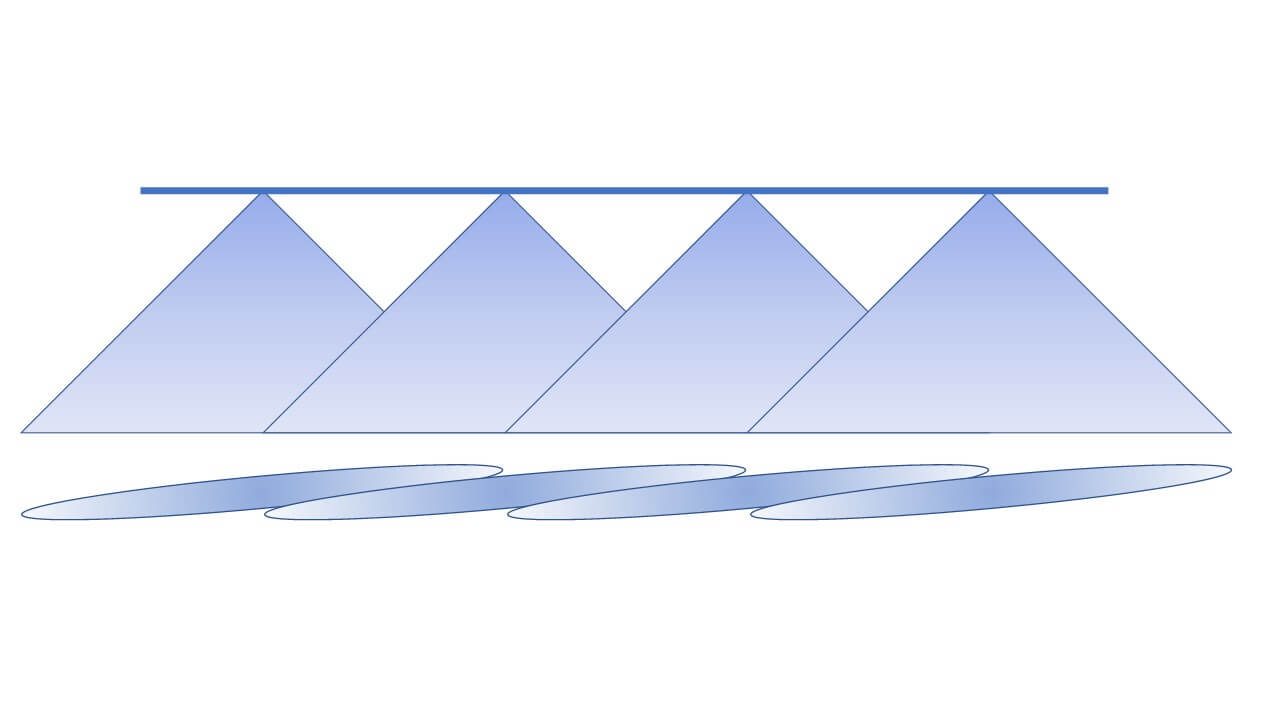
    Nozzles are spaced along a boom to allow their fans (patterns) to overlap sufficiently at the target. In broadcast spraying, a uniform distribution of spray volume gives us the best chance for consistent coverage along the boom. Since flat fan nozzles produce a tapered pattern (i.e. the volume is highest in the centre and diminishes towards the edges), approximately 100% overlap (i.e. 50% from each neighbour) will produce a uniform swath.

    Figure 1: Tapered flat fans that require some overlap are the default pattern type for agricultural boom nozzles. This is true of conventional and low-drift styles. Note that the flat fans are turned 15° to prevent the spray patterns from interfering with one another.

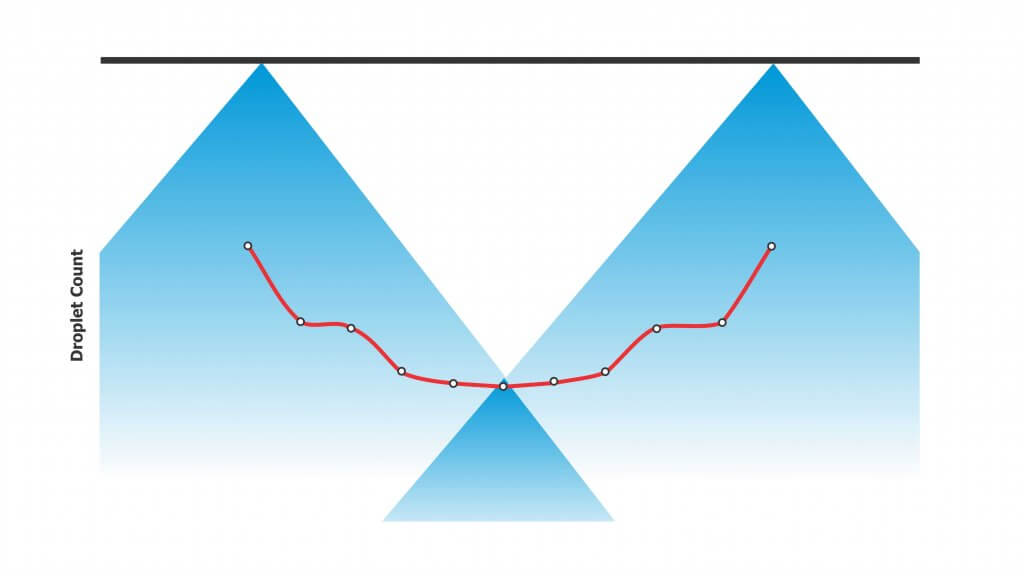
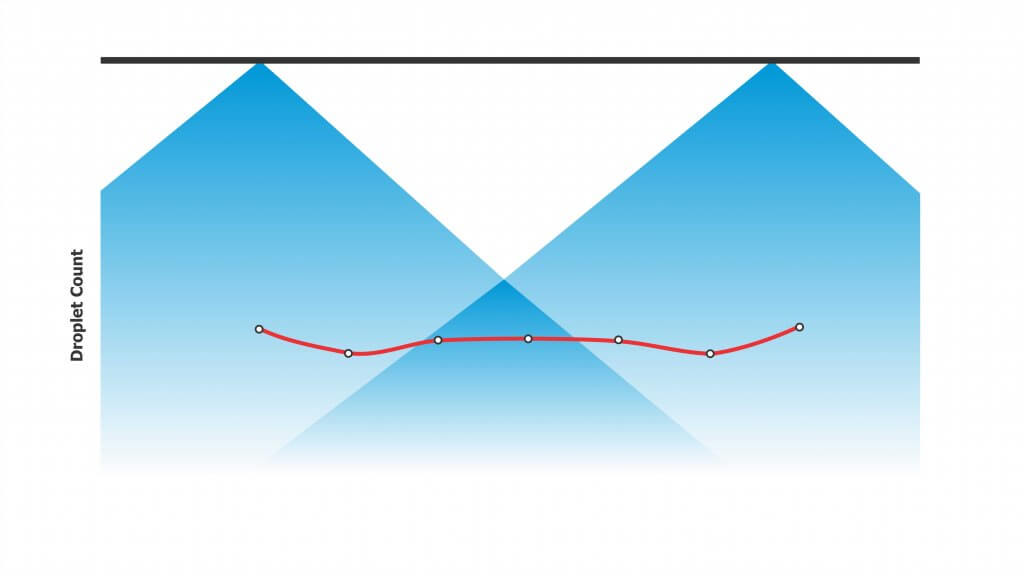
    The 100% overlap isn’t just for volumetric distribution. Flat fan spray patterns tend to have more and finer droplets in the centre and fewer and coarser droplets at the edges. All droplet sizes contribute to coverage in different ways, so the overlap ensures both number and sizes are evenly distributed along the entire boom.

    Figure 2: 30% overlap may achieve volumetric uniformity. But because the centre of the pattern contains the majority of the smaller droplets, low overlap may result in low coverage in the overlap regions, resulting in striping.
    Figure 3: Consistent droplet number distribution along the boom requires at minimum 100% overlap (50% from each neighbouring nozzle). This blends those regions of the patterns with high and low droplet densities.

    The generic 20” spacing arose from long-held conventions about boom height, fan angle, and travel speed. Specifically, this spacing required a boom height of 20” to obtain good overlap of the once-dominant 80° fan angle. Combined with 0.15 to 0.3 US gallon per minute (gpm) nozzles and travel speeds of 6 to 8 mph, operators were able to apply 5 to 15 US gallons per acre (gpa) volumes. Using nozzles with smaller flow rates would generally result in nozzle blockages.

    But what if we want to change any of those variables? How does this affect nozzle spacing? Figuring out the pros and cons of an alternate spacing requires a little math and some contingency management.

    Boom Height Math

    First the math. If the boom has 20” nozzle spacing and we need 100% overlap, the width of the spray pattern at target height must be two times the nozzle spacing, which is 40″. You must calculate the required fan angle and boom height to achieve this. Most nozzle catalogues have tables to help with this, or you can download a handy spreadsheet to calculate your own scenarios here.

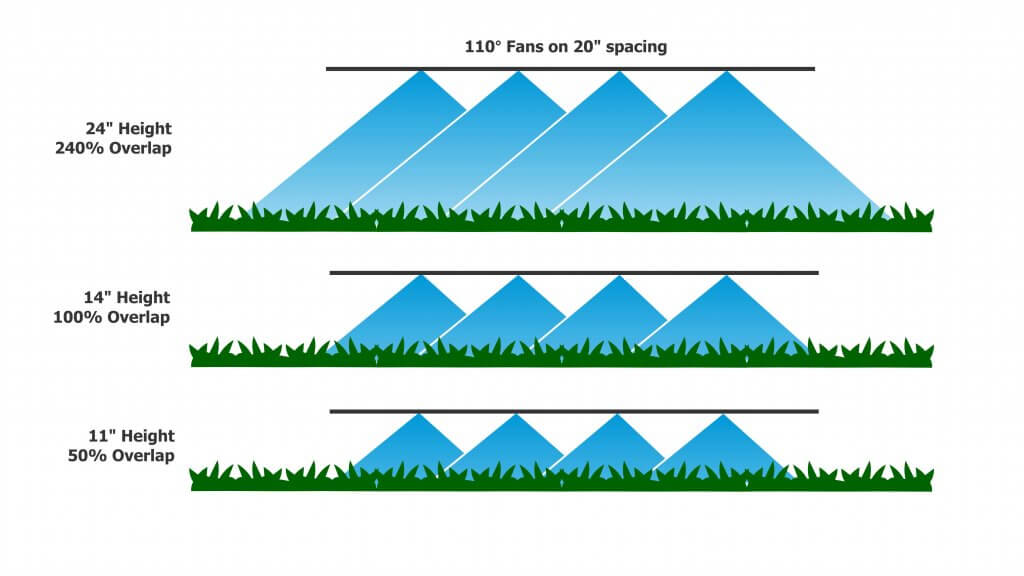
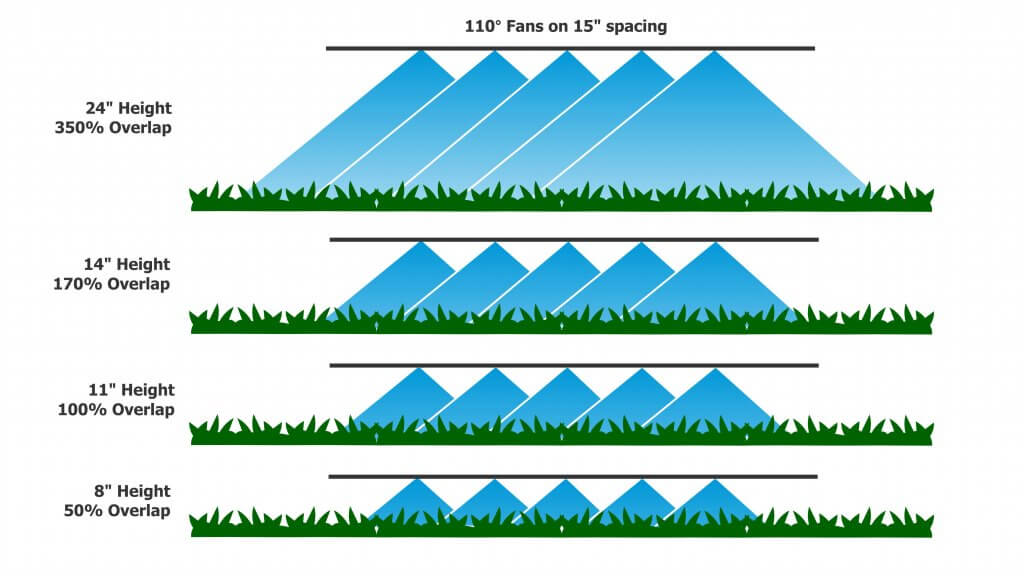
    For today’s standard 110° fans, a minimum boom height of 14” is needed to achieve 100% overlap. For 15” spacing, the height is reduced to 11”. For 10” spacing, we drop to a mere 7”. However, consider that most modern suspended booms are not operated at heights less than 24” to allow for sway. At that height, there’s plenty of overlap to go around for 20″ nozzle spacing. For those booms that are able to operate at a consistent height, narrower spacings permit lower heights that will reduce drift potential significantly. Every time we halve boom height, we also halve drift potential.

    Figure 4: Using 110° tips with 20″ spacing, the theoretical height at which we achieve 50% overlap is 11″ above target.

    By tilting the nozzles forward or backward from the vertical, we can reduce the boom height somewhat further and still get the same overlap. For example, for 20 and 15” spacings, angling nozzles forward or backwards by 30° allows us to drop the boom another 2” closer to the target.

    Contingencies

    A suspended boom hardly ever stays at a uniform height; It sways up and down with field conditions, topography, etc. This is why many operators set their booms above the minimum height – to prevent striping when the boom sways low. The penalty is that this increases the distance droplets need to travel, increasing drift potential and any turbulent displacement problems arising from the moving boom.

    Assuming a 110° flat fan at 24” boom height, each nozzle achieves a theoretical pattern width of about 70”, which is an overlap of 70÷20=3.4-fold or 240% on 20” nozzle spacing. Given a minimally-acceptable overlap of 50% (25% from each neighbouring nozzle), the boom could be as low as 11”. For 15” spacing, the minimum height for 50% overlap is 8”, and for 10” spacing it’s 5”. This means the narrower spray patterns gain 3” to 6” in allowed downward boom movement.

    Figure 5: Using 110° tips on 15″ spacing, the height for 50% overlap is 8″ above target.

    A second contingency is that spray patterns are rarely the exact value that the nozzle catalogues specify. A so-called 110° nozzle may operate at only 90°, or up to 150°, depending on the nozzle model, the spray pressure, and the tank mix. Learn more here and here. Patterns also don’t continue to grow at their rated fan angle, as droplets slow due to air-resistance and fall more vertically due to gravity. For that reason, a visual check is recommended to ensure the expected overlap is achieved.

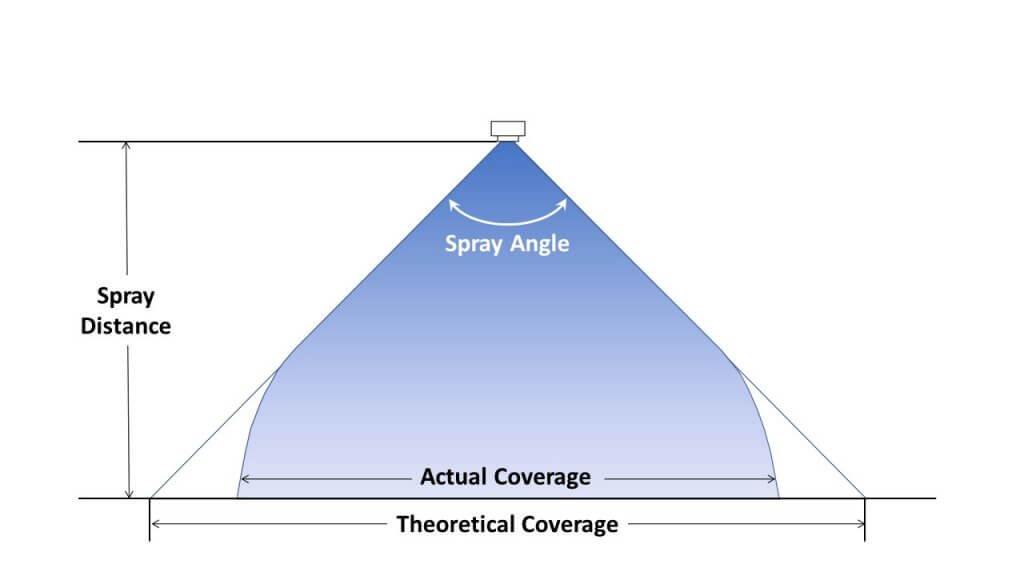
    Figure 6: Fan angles indicate initial trajectories of droplets at the edge. With distance, gravity pulls these droplets downward, narrowing the pattern width from that achieved theoretically (figure adapted from image in TeeJet catalogue).

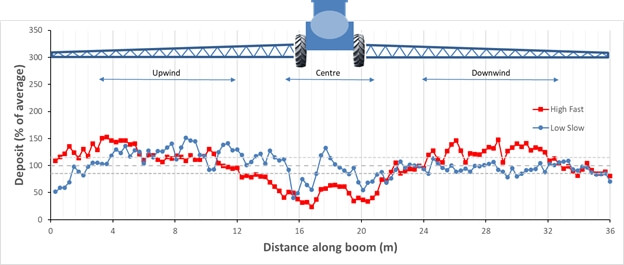
    A third issue to consider is less related to boom height but nonetheless affects spray distribution. Small droplets move with air currents, and the turbulence created by large, fast sprayers creates enough turbulence to move these droplets significantly. A perfect pattern under static conditions can look quite different at a fast travel speed with a modest side wind. Low booms may help prevent some of this displacement because droplets spend less time in flight, and their average velocity is faster.

    Figure 7: Spray deposition onto a 2 mm string to measure deposit uniformity for a fast travel speed and high boom and a slow speed, low boom configuration.

    Flow Rate Math

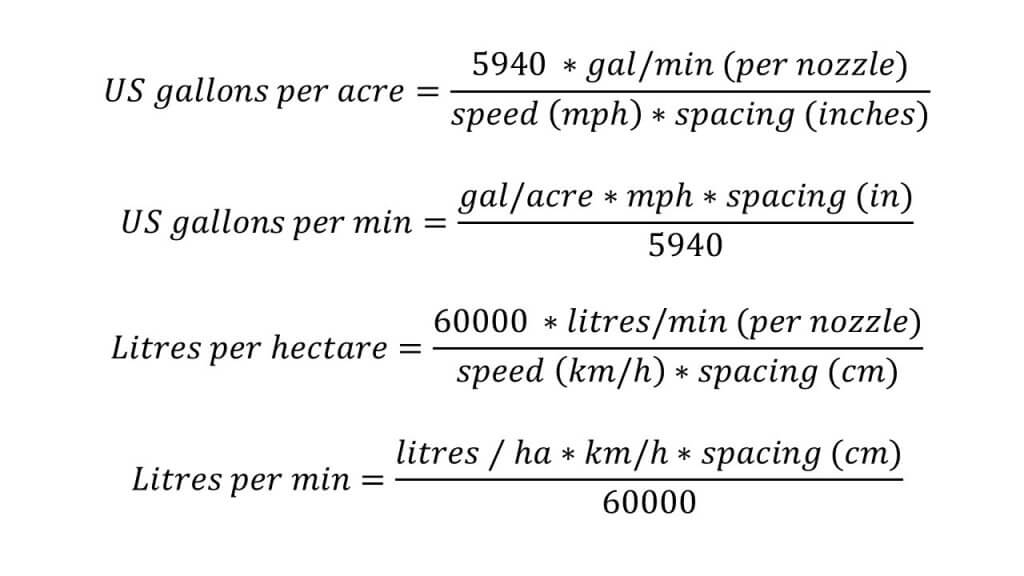
    Flow rate requirements per nozzle change whenever we equip a boom at an alternate spacing. The basic formulae are shown below.

    Moving from a 20″ to a 15″ spacing would require a nozzle with 0.75 of the flow rate, approximately from a 02 to 015 size, or 03 to a 025 size, or 04 to 03 size, etc.

    Pulse Width Modulation

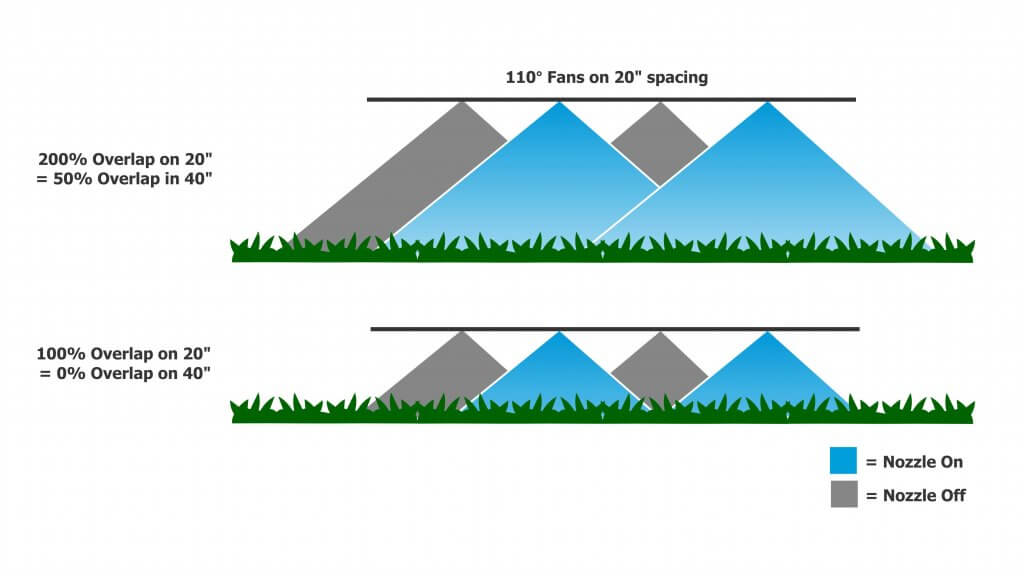
    The use of Pulse Width Modulation (PWM) has increased the overlap requirement. With PWM, alternate nozzles are on a 180° timing offset from their neighbours. This means that when running >50% duty cycle, when one nozzle is temporarily off, its neighbours are on. These neighbours’ patterns must now span the gap, and 100% overlap is the absolute minimum to achieve this. PWM users therefore select the wider pattern angles and some opt for >100% overlap.

    Figure 8: Pulse Width Modulated booms require 200% overlap so that the entire boom receives proper coverage when the alternate set of nozzles is off. For 110° fans at 20″ spacing, the minimum boom height would be 21″

    PWM Considerations

    • High flows (greater than 1 US gpm at the nozzle) that are common for fertilizer top-dressing may require higher-flow PWM valves.
    • Narrow spacings reduce the individual nozzle flow rates and can therefore support higher application rates before triggering a larger valve requirement.
    • PWM valves aren’t cheap and for example 15″ spacing compared to 20″ spacing adds 24 valves on a 120′ boom.

    Banding

    We noted that 20” nozzle spacing is a standard because it corresponds to what has traditionally been achievable with available boom heights and spray pattern angles. But things can change.

    Narrower spacings such as 15” originate with row crops and planter row spacings of 15” or 30”. These spacings exist so the spray pattern can be placed either over the top of a crop row, or in between the rows for banding. Using narrower fan angles and/or lower boom heights, together with “even” (as opposed to “tapered”) fans, banding sprays can be applied over the top of, or between crop rows. Or drop hoses can reach between the rows for top-dressing or directed sprays into the canopy.

    Canopy Penetration

    With narrower spacing, it can be argued that a greater proportion of the boom length has spray directed directly downward (corresponding to the centre of the pattern). Whether or not this translates into better penetration of a canopy is a fair question. In laboratory trials, use of 10” or 20” spacing did not improve penetration into a broadleaf canopy. But if the lower boom height afforded by the narrower spacing was utilized, some improvements in the deposit of angled sprays onto vertical targets was observed.

    Adjusting to Narrower Spacings

    As we showed earlier, use of 15” or 10” spacing booms for broadcast sprays requires a smaller nozzle size to achieve the same spray volumes as the 20” spacing. If boom height remains constant, narrower spacings result in greater pattern overlap which provides more latitude for sway. Alternately, lower boom heights can be used.

    Using smaller nozzles on narrower spacing presents some challenges. Generally, smaller nozzle size means finer spray quality. If an operator wants to retain the spray quality they had on a 20″ spacing, they may opt to use lower pressure (not advisable for non-PWM systems) or swap to different nozzle design that can produce the desired spray quality at the lower flow rate.

    Smaller nozzles are more prone to plugging, so that needs to be managed with filtration, filling practices and water sourcing. Be aware of the the product formulations and their requirements for filter mesh size. Most dry products specify a 50 mesh filter (or coarser). Also, check size options for nozzles. The smallest size for most nozzle models is 015, but certain PWM-specific nozzles are only available in 03 or larger.

    The marriage of narrow spacings with individual nozzle shutoff can result in a versatile system capable of producing high resolution banded sprays in narrow seeded crops. For example, consider a boom with a 10” nozzle spacing spacing that matches the seeder row spacing. The operator can shift from 10” to 20” or 30” from the cab if the valve control software allows it. With accurate guidance and good boom levelling, topdressing foliar products (e.g. nutrients, fungicides) can follow the crop row precisely.

    Spot Sprays

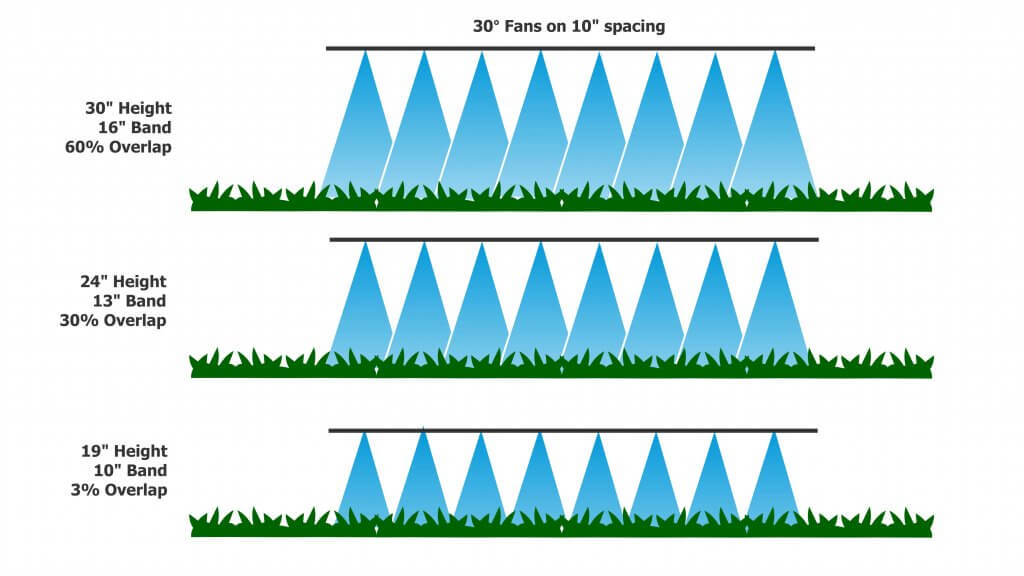
    Spot sprays present a situation where compromises are needed. Some, such as WEEDit, utilize narrower nozzle spacings to allow better treatment resolution and increase product savings. Any one nozzle or sets of adjacent nozzles may be triggered by the sensor. For single nozzle activation, to preserve the value of the better resolution a uniform, narrow band of spray needs to be created. This means a 30° or 40° fan angle from a banding nozzle will be necessary. For example, a 24” boom height will result in a 13” band with a 30° fan, and an 18” band with a 40° fan. In the latter case, the dose would be diluted by 80%, wasting much of the potential savings.

    Figure 10: Boom height is critical for banded sprays and for spot sprays. Too wide a pattern on a single nozzle reduces dose, too narrow creates misses.

    Frequently, a patch of weeds will trigger several adjacent nozzles. Now these individual bands need to work together to create a uniform swath. This will inevitably require some overlap to avoid gaps, but too much overlap will result in bands where twice the dose will be applied. A tapered fan may suit this situation better. As a result of these varying needs, tolerances for spot spray boom height are even more strict than for broadcast spraying. More thoughts on spot spray nozzle selection are here.

    Conclusions

    Narrower nozzle spacings on a broadcast boom allow somewhat lower boom heights and these can in turn reduce drift and improve deposition of sprays. Lower flow nozzles will be needed with narrower spacings, requiring management of plugging and potentially a more drift-prone spray quality. The value of narrower spacings depends on the availability of booms that control sway, allowing them to operate at uniform, low heights.

  • Nozzle Selection for Boom Sprayers

    Nozzle Selection for Boom Sprayers

    Picking the correct nozzle for a spray job can be a daunting task.  There is a lot of product selection, and a lot of different features.  We try to break the process down into four steps.

    1. Identify Your Needs

    Before making any assumptions about the right nozzle for you, review your needs and objectives. Are you trying to reduce drift? Do you want better coverage? Are you moving towards more fungicide application? Do you need a wide pressure range?

    It’s always a good idea to review your experience with your previous nozzle. What, if anything, would you like to change?

    2. Identify Flow Rates

    Most spray operations fall into one of three categories, (a) pre-seed burnoff (3 to 7 US gpa); (b) in-crop early post-emergence (7 to 10 US gpa); (c) late season application to mature canopies (10 – 20 US gpa).

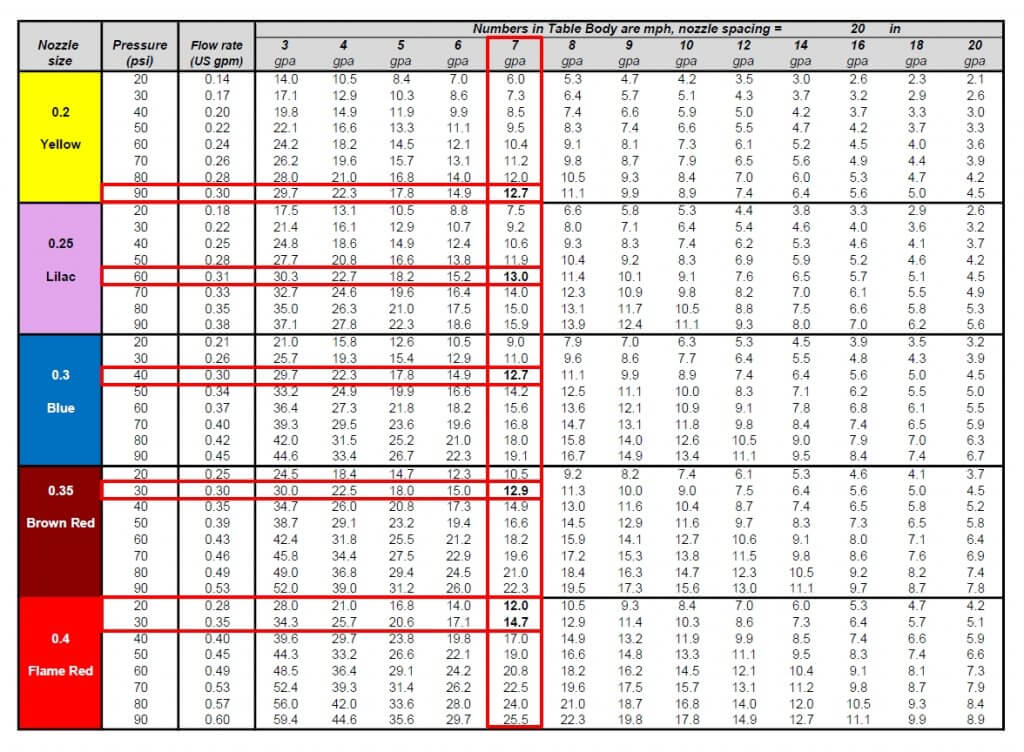
    To find the right nozzle size, you need to know the application volume, the travel speed, and the nozzle spacing. Most sprayers have 20” nozzle spacing, but some have 15” spacing. Use these metric or US units charts to find the right flow rate for common nozzle spacings. Various on-line calculators from Hypro, Greenleaf / Agrotop, Lechler, or Wilger or their apps, are also helpful.

    If you use our chart, the top row lists water volumes. The columns contain travel speeds. Travel speed is somewhat flexible and can change throughout the field.

    Let’s assume the water volume is 7 gpa, and the desired application speed is 13 mph. Move down the “7 gpa” column, searching for 13 mph. You will encounter 13 mph about 5 times: 02 nozzle @ >90 psi, 025 nozzle @ 60 psi, 03 nozzle @ 40 psi, and 035 nozzle @ 30 psi (the 035 size is only offered by some manufacturers) and the 04 nozzle at about 25 psi.

    Nozzle chart, in US units, solving for 7 gpa at 13 mph. Five nozzles can produce the required flow, each at different pressures.

    Note that for the smaller nozzle sizes, the spray pressure is perhaps too high, and for the larger sizes, it is too low. Select a size that allows optimum nozzle performance and travel speed flexibility. In this example, the 025 size is optimal, producing an expected pressure of about 60 psi. The column for the 025 nozzle can now be used to predict the travel speed range from 30 psi to 90 psi, about 9 to 16 mph. For the 03 nozzle, the minimum speed would be 11 mph, too fast for some.

    For Pulse Width Modulation (PWM), slightly different rules apply. See here for instructions.

    3. Select the Nozzle Model

    For general spraying, we recommend intermediate spray qualities ranging from Medium to Very Coarse.

    These intermediate spray qualities offer good coverage at reasonable water volumes and good drift control. Their spray quality can be tailored with pressure adjustments to suit specific needs. For images, see here. In alphabetical order:

    Air Induced:

    There is plenty of selection in this popular category, all manufacturers offering similar specs and performance.

    Pulse Width Modulation:

    PWM nozzle selection is improving, but some gaps in availability remain.

    All nozzles should be operated near the middle of their pressure range, for air-induction this is 50 to 60 psi or higher, a bit less for non air-induced types. This allows maximum flexibility when travel speeds change or when spray quality is adjusted with pressure.


    For fusarium headblight, consider a twin fan nozzle.

    Keep your booms no more than 15” to 25” above the heads for best results.

    Air Induced:

    There is an excellent selection of twin fans from most manufacturers.

    Pulse Width Modulation:

    Relatively poor selection, limited flow rate ranges or spray qualities available for some models.


    For finer sprays (lower water volumes), simply increase spray pressure or consider a non-air-induced design.

    There has always been a large selection of finer sprays on the market, remnants from a time when drift was less important. Very few offer flow rates above 06 or 08, decreasing utility for PWM systems.

    Notice that conventional flat fan tips and most pre-orifice tips are absent from these lists. These nozzles are not recommended for herbicides because they produce sprays that are too fine for acceptable environmental protection (ASABE Fine and Medium). The added coverage afforded by such sprays only has value with low water volumes, and in those instances is more than offset by their higher drift and evaporation. An exception is the use of insecticides with contact mode of action targetting small insects such as flea beetles or aphids. In thes cases, finer sprays (ASABE Fine or Medium) may be required to provide effective tragetting.

    Very high flows are sometimes needed (11010 and above, usually for PWM). When this occurs, conventional flat fans have merit because the higher flow rates of any nozzle usually create coarser sprays, and even conventional tips will create sufficient coarseness to prevent drift.


    For the best drift protection, consider these tips.

    The advent of the dicamba-resistant trait in soybeans has spawned interest in very low drift tips that comply with the label requirements for these products. Although superior for drift control, they are not well suited for low volume or low-pressure spraying, nor for contact herbicides or grassy weeds, as spray retention and coverage may be poor. But they are very valuable when drift control is paramount and when higher volumes can be used to maintain adequate coverage.

    The following advice is based on the rules at the time it was written. These may be suitable for 2,4-D application in Australia under the newest APVMA guidelines (check spray quality to be sure it is VC or coarser). Many are also suited for Dicamba in Canada (must be XC or coarser), or dicamba in the US (must be on approved lists such as this one for Xtendimax or this one for Engenia, but caution is advised, some low pressure limits make them impractical. Always check that spray quality can be achieved at pressures that offer travel speed flexibility.

    Air Induced:

    Excellent selection. This market has received much attention in recent years.

    Pulse Width Modulation

    Before making a selection, check the nozzle’s recommended pressure range and the spray qualities within that range from the manufacturer info. The target pressure for these tips may differ from your expectations.

    4. Tweak and Confirm

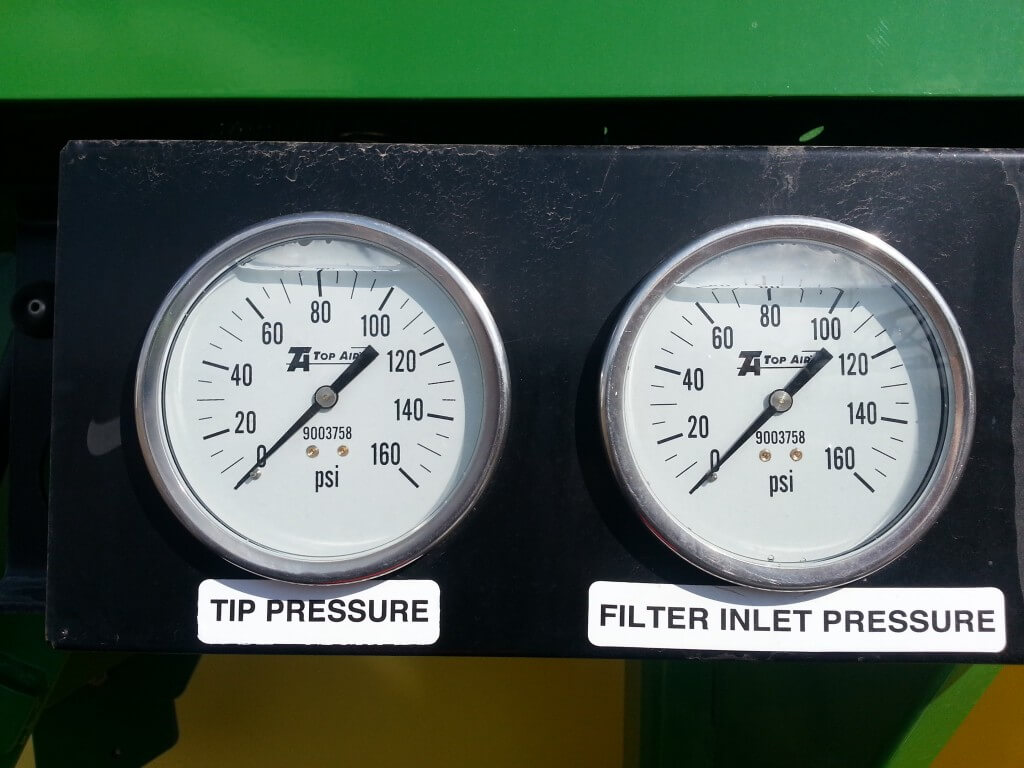
    Under field conditions, the spray pressures which produce the desired water volumes can vary from the charts. Make sure you trust your pressure gauge reading and know the pressure drop from the gauge signal to the nozzles, particularly with PWM, where the solenoid adds additional drop. Add the pressure drop to your target pressure reading. If using a rate controller, use the pressure gauge as your speedometer to ensure optimal nozzle performance. Adjust travel speed until the nozzle pressure meets with your spray quality and pattern goals. If that speed is too slow or fast…you have the wrong size nozzle and/or water volume.

    Spray pressure is more important than travel speed – make your pressure gauge your speedometer.

  • Rate Controllers on Air-Assist Sprayers

    Rate Controllers on Air-Assist Sprayers

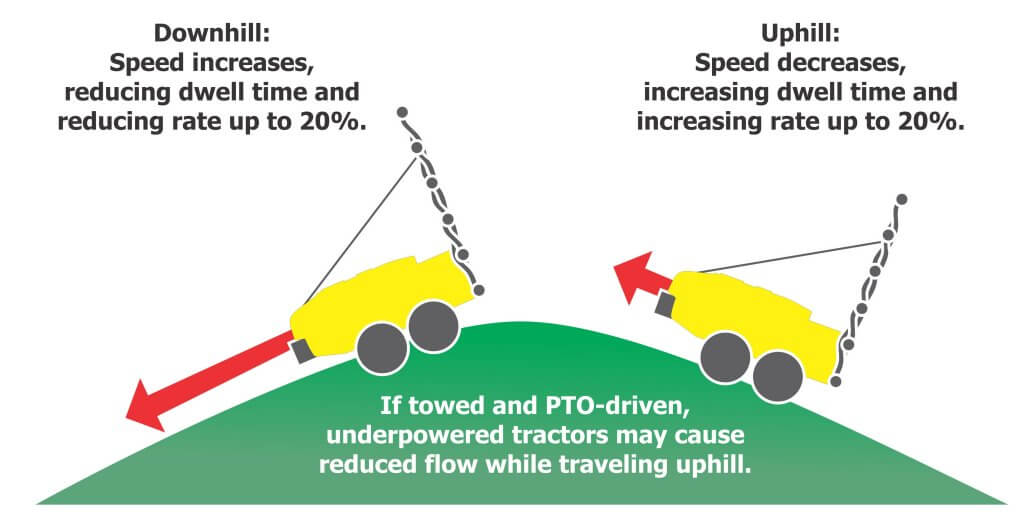
    There are many advantages to using rate controllers, but their primary role is to maintain a constant application rate. All sprayers change speed on hills, at row-ends, or in response to surface conditions. Since flow from an uncontrolled sprayer is constant, the application rate varies significantly (up to 40% in hilly conditions). Rate controllers compensate for changing speed by adjusting flow.

    Hilly operations create highly variable application rates. Changes in travel speed can translate to 40% variability in rate applied. Rate controllers adjust flow to compensate.

    Pesticide is not saved directly (since increased uphill rates already cancel out reduced downhill rates), but consider the pesticide label. Labels that list a range of rates are contingent on pest pressure and crop size, but also compensate for poor coverage from low-performing equipment. When coverage uniformity is improved, experience has shown that operators can safely spray at minimal rates.

    Experience has also demonstrated that when coverage uniformity is improved, pack-out benefits follow. Even a modest improvement represents a quick return on investment. Equally important, a more consistent application reduces the risk of higher residue levels on the uphill and improves crop protection on the downhill.

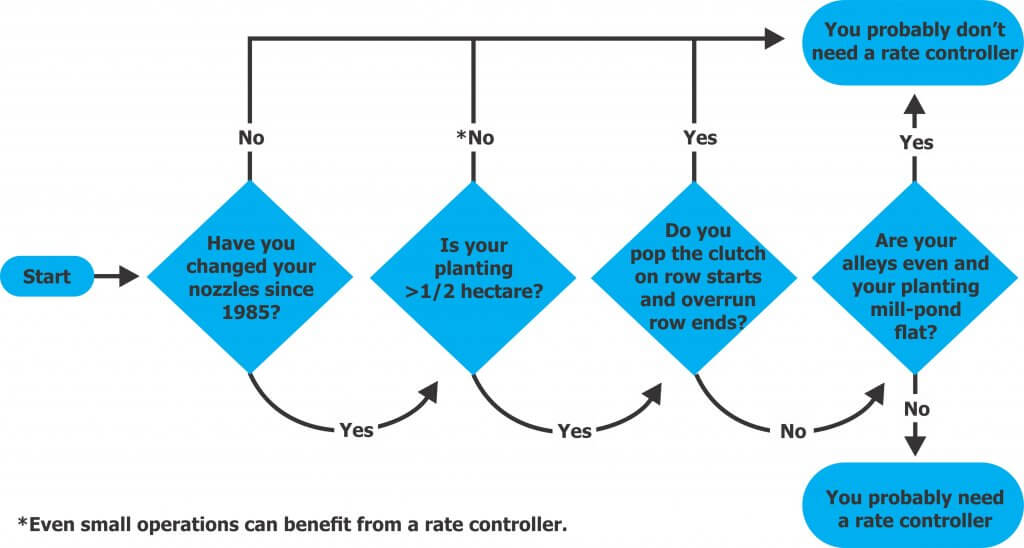
    Now, if you are wondering if a rate controller is right for your operation, or if you should just stop reading now, consult this handy decision support matrix:

    This decision support matrix will help you decide if a rate controller is right for your operation. Spoiler alert: It probably is.

    Rate controller categories

    The following table categorizes controllers based on how they control flow. The categories are successively more expensive and complicated, but there’s commensurate value. For example, while not specified here, high-end rate controllers offer value-added features such as as-applied mapping (a powerful management tool).

    DescriptionProsCons
    Good:
    Monitors and adjusts pressure. Uses math to assume flow.
    -Fewest moving parts.
    -Simple interface.
    -Lowest cost.
    System monitors pressure, but does not register flow. For example, if nozzle flow is restricted, back pressure increases. The controller will compensate to correct pressure, implicitly reducing flow, but the operator is not alerted to the actual problem.
    Better:
    Monitors and adjusts flow, not pressure.
    Alerts operator to changes in flow. Operator usually sets the percent error threshold a little high to ignore transient changes.System will not register pressure deviations. At threshold speed, pressure may drop too low. This can cause inconsistent check valve operation and spray pattern collapse. With tall booms, the top nozzles may close completely.
    Best:
    Monitors flow and pressure and adjusts flow.
    -Best likelihood of a consistent application.
    -Alarms or automatic compensation of flow and pressure (user sets hard stops).
    -Provides a low tank level warning.
    -Stores preset calibrations to quickly switch between blocks.
    -Highest cost.
    -Steepest learning curve.
    -More “wire-wiggling”.
    -Operators often choose to over-apply at low speeds as a tradeoff for uniform output and consistent atomizer performance.

    Rate controller adoption and components

    As we write this, less than 10% of air-assist sprayers have rate controllers. In the dark old days of the 1980’s, air-assist operators were ill-advised to install high flow, low pressure field sprayer controllers. That history of mismatched components and subsequent bad experiences continues to hinder widespread adoption.

    Today’s components, however, are specific to air-assist sprayers and have made installations easier and more successful. Do your homework and speak with the manufacturer (not necessarily the local dealer) to ensure the controller, and all its components, meet your needs. Let’s describe the components so you’re prepared to have the conversation:

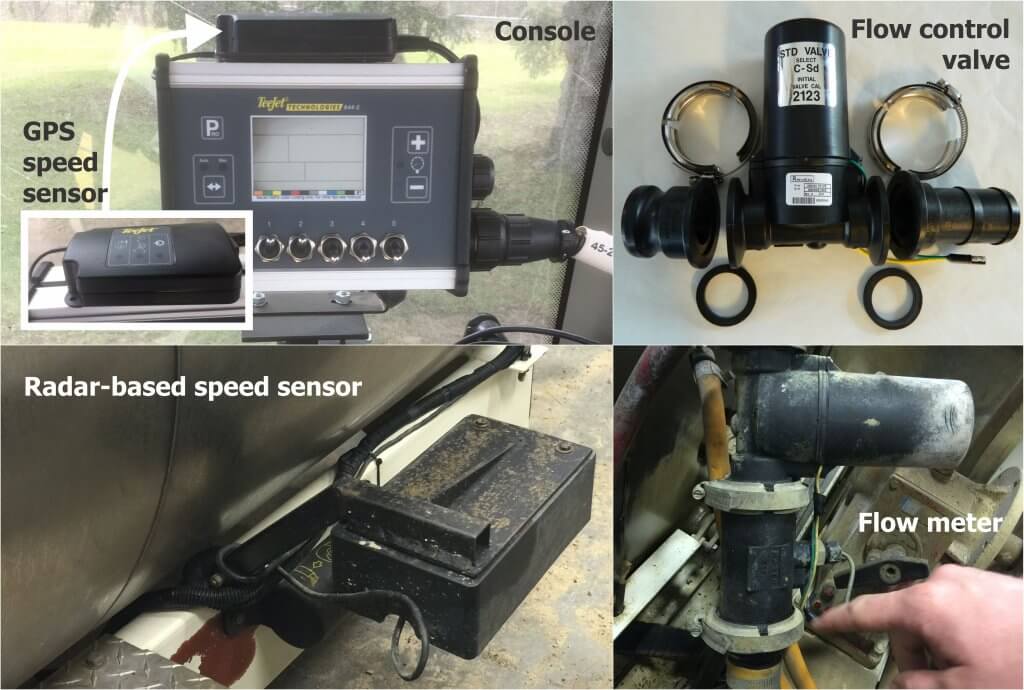
    • Console
    • Flow meter(s)
    • Flow control valve (including electric boom shut-offs)
    • Speed sensor
    • Wire harness
    Examples of rate controller components.

    Console

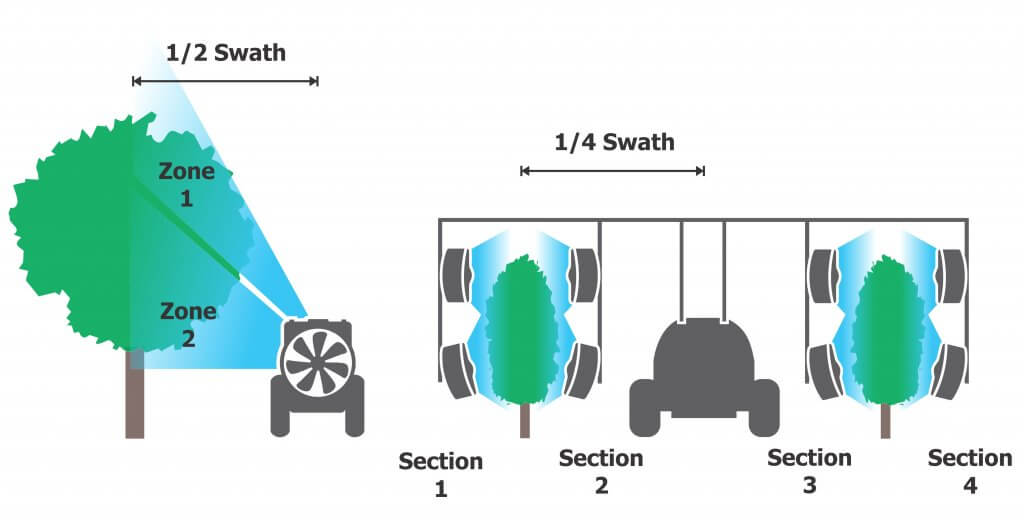
    The console is the interface. The user enters criteria about the sprayer, the planting, and calibration data and receives information about sprayer performance. Select a console designed for air-assist sprayers and not field sprayers. Controllers intended for horizontal booms perceive swath in two dimensions, but air-assist controllers account for multiple vertical booms or boom sections in the swath (see the following figure).

    Field sprayer rate controllers used in vertical crops must be “tricked” when programming swath. Leading air-assist rate controllers can assign flow to zones on a single vertical section (left) and adjust swath (sometimes called width) for multiple booms (right).

    Flow meter

    With rate controllers, flow is detected by one or more flow meters positioned pre-manifold. The relief valve becomes more of a safety device, defining the high pressure limit and bypassing flow if required. Most rate controllers use a flowmeter with no ability to monitor pressure. While still effective, adding a pressure sensor ensures nozzles are operating in the desired pressure range.

    Turbine or paddle meters are inexpensive and acceptably accurate. They require periodic cleaning because some chemistry can accumulate and interfere with their moving parts. Filtration helps to minimize this issue. Magnetic or ultrasonic meters have no moving parts, higher resolution, wider metering ranges and aren’t affected by the viscosity of the spraying solution or entrained foam. However, they are considerably more expensive than mechanical meters.

    Flow control valve

    Unlike boom control valves that are open or closed, flow control valves are capable of a range of adjustments. Valve actuation is controlled by 12 volt servomotors. The level of precision depends on the style of valve.

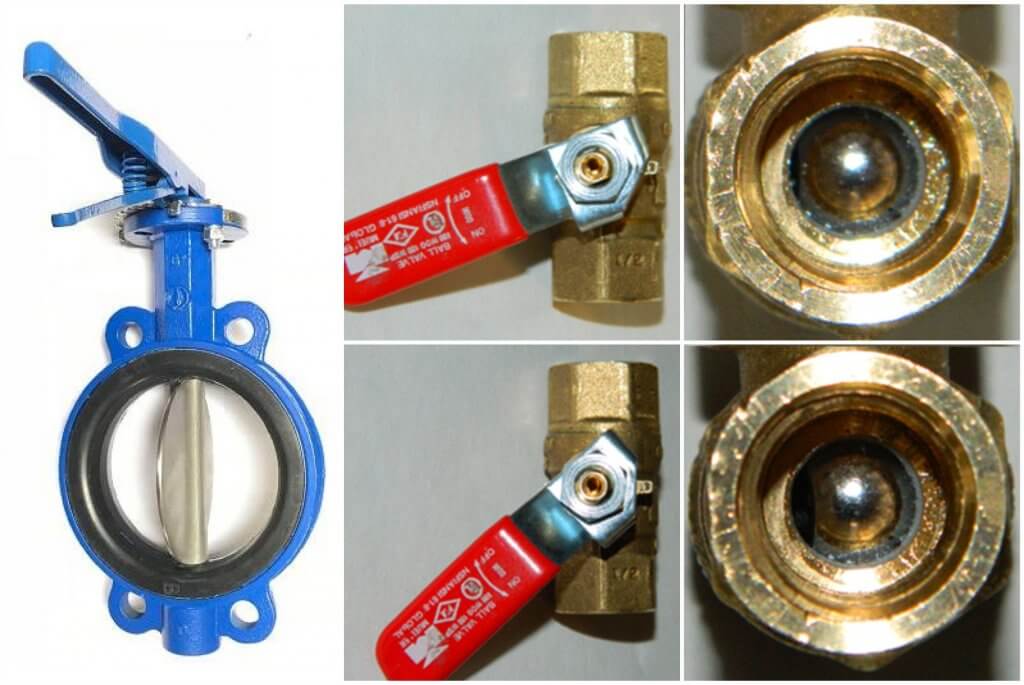
    • Butterfly valves: Simple, inexpensive, and typically for pressures <10bar (150psi). Some have minor leak-by when closed. Control is less precise as the valve opens because the orifice gets geometrically larger. This gives a narrow metering range.
    • Calibrated ball valves: Versions available for all pressures. May be simple flow through balls with similar metering limits to a butterfly. A better ball design is also available that offers a linear flow rate through the entire adjustment range, offering more stable rate control over the entire flow range. Several manufacturers offer these. All ball valves offer zero flow when closed.
    Left- A butterfly valve. Right- A ball valve. Notice how a small change in the opening angle translates into a large change in the orifice size; this is difficult to control manually. Servomotors not pictured.

    Compared to field sprayers, air-assist sprayers travel slower and use lower flow rates. It is a mistake to employ valves intended for high-flow, high-speed sprayers.

    • Speed: Valves are rated by connection size (½”, ¾”, etc.) and opening time (e.g. 1-14 seconds are common). Many rate controllers can be programmed to optimize adjustments for the speed and size of the valve.
    • Precision: As control valves open over their 90° range, the ability to control flow is less precise. Slower valves give less precision, but greater stability.
    • Size: Valve size should accommodate maximum flow and no more. If the valve is too large, it can only meter flow over the first few degrees of opening. For example, let’s say a valve capable of 200 L/min (50 gpm) and rated 1 second is used. Your sprayer meters 0-20 L/min (0-5 gpm). This means the whole metering range happens in the first tenth of a second. Even lightning-fast consoles will give unstable readings (aka hunting) as the computer overshoots the target in an effort to comply.

    Control valves are “service parts”. Seals, moving parts and abrasive liquids mean they will require regular care and eventual replacement. It’s a wise precaution to make them accessible and easily removable. We suggest installing them with quick-connects (see top-right of the previous collage of rate controller components above) to make field-maintenance fast and easy.

    Speed sensor

    Speed can be based on GPS, engine tachometer readings, radar, or wheel rotations. Newer rate controllers may even take the speed directly from the tractor’s data feed. Price, reliability and crop conditions are all factors you should consider in the choice.

    • GPS: Easiest to deploy, very accurate (especially RTK-GPS) and reasonably priced. However, overhead canopy can block satellite signals. Some controllers compensate for the GPS losses with sophisticated internal kinematic devices that measure the inertia of the sprayer and calculate speed when the GPS is not reliable.
    • Wheel rotation speed sensors:  An entry-level sensor, it’s typically a reed switch or Hall effect sensor that detects either the lug nuts or magnets installed on the rotating wheel. More magnets improve accuracy. Its exposure makes it prone to physical damage, and readings change with tire radius (which changes as the tank empties, on soft ground and with temperature). This is why wheel sensors are calibrated in the alley, with the tank half full and both tires at the same pressure.
    • Radar speed sensors: Employing the Doppler effect to measure speed, radar is the most accurate sensor. They are unaffected by terrain, slope or tank volume. They can be mounted anywhere in sight of the ground. They are, however, the most expensive and are typically not repairable if they fail.
    • Tachometer speed sensors: Largely obsolete, they measure the tractor’s tachometer speed and convert it to travel speed. Difficult to install and prone to the same inaccuracy as wheel sensors.
    • Interface sensors: Relatively new, some rate controllers interface with tractor electronics to receive speed data. ISOBUS, the standard interface language that agricultural electronics are increasingly adopting, makes this data exchange more common.

    Wire harness

    It may seem we’re drilling deep to mention wires, but standards are changing. Many controllers employ traditional analog wiring, but they are being made obsolete by the newer ISOBUS option.

    • Traditional Analog: Simple wires with automotive or custom plugs designed to match components. Relatively inexpensive and sometimes field repairable, analog wiring carries signal voltage (and power) to and from the controller to drive valves and receive analog sensor data. Communication is one-way: Sensor to controller, controller to valves.
    • Modern ISOBUS: Bus systems are more like a computer network, where digital signals travel back and forth between the controller and each component. Components that require power are wired directly to a battery. This results in a greatly simplified harness. The controller’s single ISOBUS wire “daisy chains” all components to relay commands and receive status, which makes system monitoring and diagnosis easier and more effective.

    Conclusion

    Rate controllers are a worthy consideration for your existing or future air-assist sprayer. Assess your needs and work with a knowledgeable dealer or manufacturer that can assemble and install a system appropriate for your operation.