Category: Rates and Calibration

For basics category

  • Diagnosing Airblast Coverage

    Diagnosing Airblast Coverage

    Assuming there are no mechanical or maintenance problems, water-sensitive paper can be used to diagnose sprayer performance. Go here to read more about water-sensitive paper. Interpreting the results and knowing what changes to make is the critical part of the process. Observing no coverage, or a sodden paper, make for obvious conclusions… but what about everything in between? Here are the ground rules:

    First: Only ever test coverage in environmental conditions you would normally spray in. Temperature, humidity and wind speed can make or break an airblast calibration.

    Second: When altering sprayer settings, only make one change at a time for each test pass so you can isolate what’s wrong.

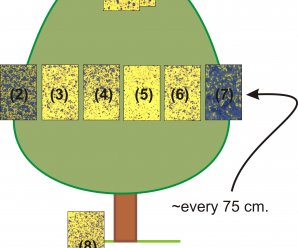
    Third: Each pass requires a new set of papers located in the same place, oriented the same way, distributed throughout the canopy. Mark their locations with bright flagging tape and write the pass number and canopy position on the back of paper prior to placement. This helps you to compare the passes later on. Don’t collect papers until they’ve had an opportunity to dry a little, or they will smear and stick together.

    Fourth: Pass down one alley first. Have a look at the papers without removing them. Then, spray the target canopy from the other side. Now the papers can be removed for analysis. This order is important because it reveals the impact of wind direction and the cumulative effect of spraying from both sides. In some cases, the sprayer operator may wish to travel an additional upwind alley to reflect the cumulative coverage on a typical spray day. Alternate row applications are not recommended.
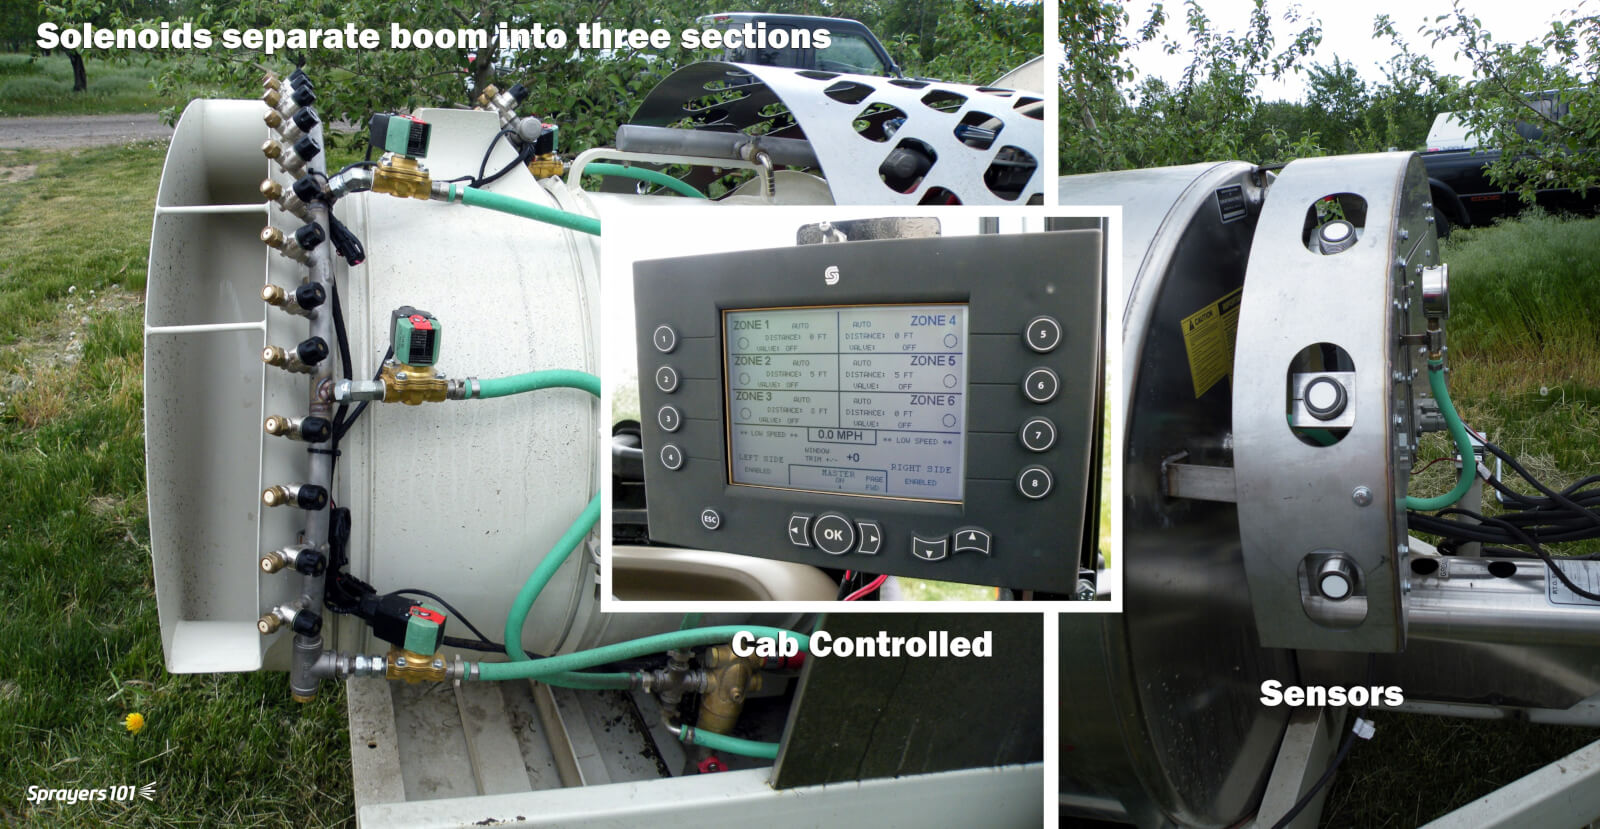
    This Turbomist has been outfitted with sensors that detect the presence of a canopy. Each eye corresponds to a boom section, turning the section on and off as required and improving efficiency. If it’s not there, why spray it?
    This Turbomist has been outfitted with Gillison’s Sonic Spray sensors that detect the presence of a canopy. Each eye corresponds to a boom section, turning the section on and off as required and improving efficiency. If it’s not there, why spray it?

    Once the papers are retrieved, it’s time to diagnose the coverage. The following situations are typical in calibrations, and possible fixes are suggested. Remember, this is a process that takes time. Several passes may be required before satisfactory coverage is obtained. Once the correct settings are determined for the block, continue to use them until there is a significant change in the crop staging or weather. At that point, repeat the process.

    Seven Situations

    Situation One:

    <15% coverage and <85 Fine/Medium droplets/cm2 at top of target (e.g. tall targets such as hops or trees). Suggested Fixes:

    • Wind might be stealing fine droplets. Try Coarser droplets (e.g. using air induction nozzles). Be aware that you may have to increase volume to compensate for reduced droplet counts and that they may fall out of the airstream before reaching distant targets.
    • Deflectors may not be channelling air and spray correctly – extrapolate air direction using ribbons on deflectors.
    • Fan may have to be set to higher gear, or if using GUTD, return to 540 rpm to increase fan speed. If still insufficient, you may need a sprayer with higher air capacity.

    Situation Two:

    <15% coverage and <85 Fine/Medium droplets/cm2 deep in canopy – sometimes papers on outside of canopy are visibly wet. Suggested Fixes:

    • Ground speed may be too high. Use flagging tape indicator on far side of target and see if air is getting through.
    • Canopy maintenance may be required (e.g. pruning, hedging, leaf stripping, etc.). No sprayer can consistently penetrate really dense canopies.
    • Fan may have to be set to higher gear, or if using GUTD, return to 540 rpm to increase fan speed. If still insufficient, you may need a sprayer with higher air capacity.
    • Increase carrier volume.

    Situation Three:

    Papers are drenched, dripping or show channels of running liquid. Suggested Fixes:

    • Reduce spray volume, either overall or in key locations on the boom corresponding to the drenched papers.
    • Ground speed may be too low. Use flagging tape indicator on far side of target and see if too much air is getting through. If so, increase ground speed.

    Situation Four:

    Considerable overspray beyond target row. Suggested Fixes:

    • Turn off upper nozzles until spray JUST clears target.
    • Deflectors may not be channelling air and spray correctly – extrapolate air direction using ribbons on deflectors.

    Situation Four:

    Considerable blow-through beyond target row. Suggested Fixes:

    • Slow the fan speed by shifting to low gear, or using GUTD method
    • Ground speed may be increased as long as coverage is not compromised. Use flagging tape indicator on far side of target and see if air is getting through.

    Situation Five:

    Ground under target row is drenched. Suggested Fixes:

    • Rotate lower nozzles slightly upward, but do not shut them off. If ground remains drenched, turn them off entirely. Each hollow cone produces up to an 80º spray angle, so the next higher nozzle often compensates by spraying lower than expected.
    • Deflectors may not be channelling air and spray correctly – extrapolate air direction using ribbons on deflectors.

    Situation Six:

    <15% coverage and <85 Fine/Medium droplets/cm2. Remember that this coverage threshold is only a point of reference, not a hard fact. It does not apply when using Coarser droplets. Suggested Fixes:

    • Increase spray volume, either overall or in key locations on the boom corresponding to the under-sprayed papers.
    • Wind might be stealing fine droplets. Try coarser droplets (e.g. using air induction nozzles). Be aware that you may have to increase volume to compensate for reduced droplet counts.
    • Ground speed may be too high. Use flagging tape indicator on far side of target and see if enough air is getting through. If not, decrease ground speed.
    • Canopy maintenance may be required (e.g. pruning, hedging, leaf stripping, etc.). No sprayer can consistently penetrate really dense canopies.

    Situation Seven:

    Inconsistent coverage on outer edge of canopy (e.g. one spot never seems to get spray.) Suggested Fixes:

    • Nozzle spray angle may be too acute (e.g. full cones), and spray is not overlapping before reaching target. Try wider spray angles.
    • Some tower sprayers have ‘dead spots’ in their air. Check for limp or flagging ribbons tied to nozzle bodies and/or deflectors. Deflectors may need to be adjusted, or adjacent nozzle body angles repositioned to compensate. Try an air induction nozzle in the dead zone.
    • Canopy may be brushing against nozzles as the sprayer passes, temporarily blocking them. Canopy management required.
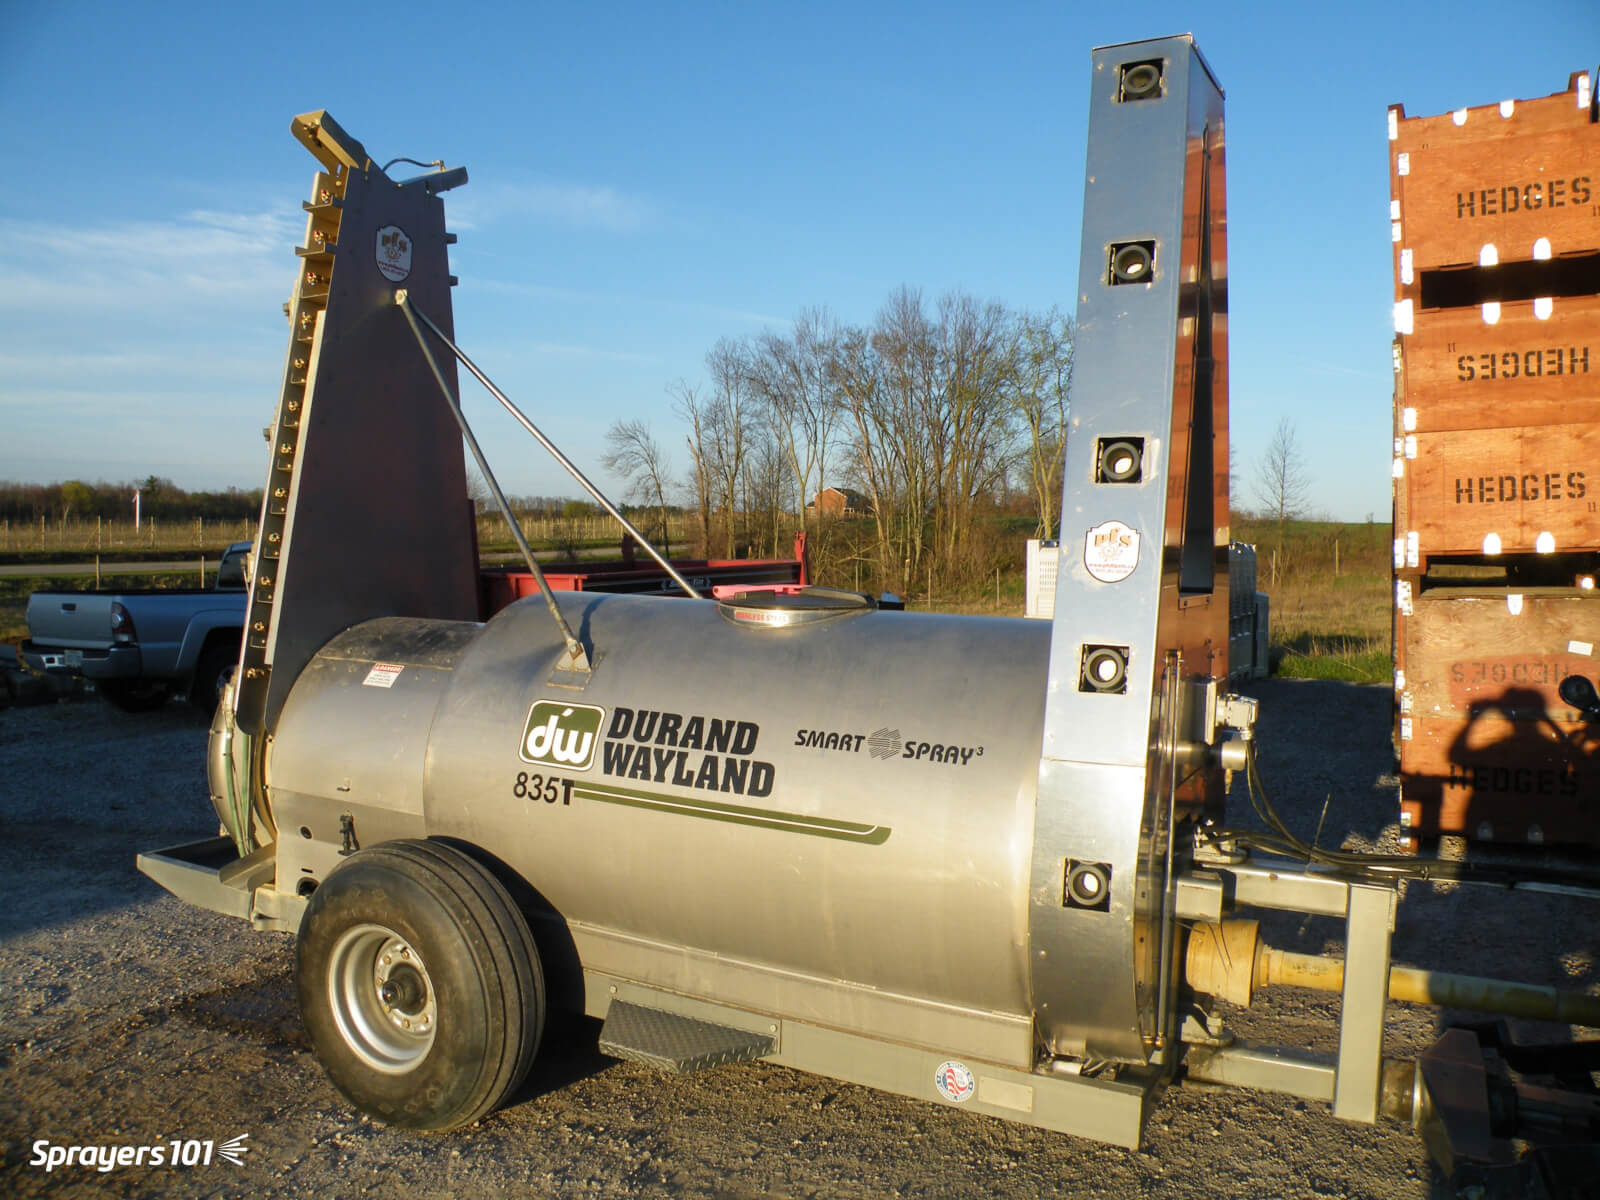
    Some sprayers, such as Rears, Turbomist, FMC or this Durand Wayland have an option for electronic ‘eyes’ that detect spray targets. The boom will shut off completely if there is a gap in the planting. This can save a great deal of wasted spray. It is less applicable in trellised plantings where it has been known to be “fooled” by wires and posts.
    Some sprayers, such as Rears, Turbomist, FMC or this Durand Wayland have an option for electronic ‘eyes’ that detect spray targets. The boom will shut off completely if there is a gap in the planting. This can save a great deal of wasted spray. It is less applicable in trellised plantings where it has been known to be “fooled” by wires and posts.

    If you still are unable to achieve satisfactory coverage, you may have to consider more extreme solutions. You may have an under- or over-powered sprayer. You may have to perform significant canopy management. Or, you may be trying to spray in poor weather conditions.
  • Nozzle Sizing and Calibration Charts

    Nozzle Sizing and Calibration Charts

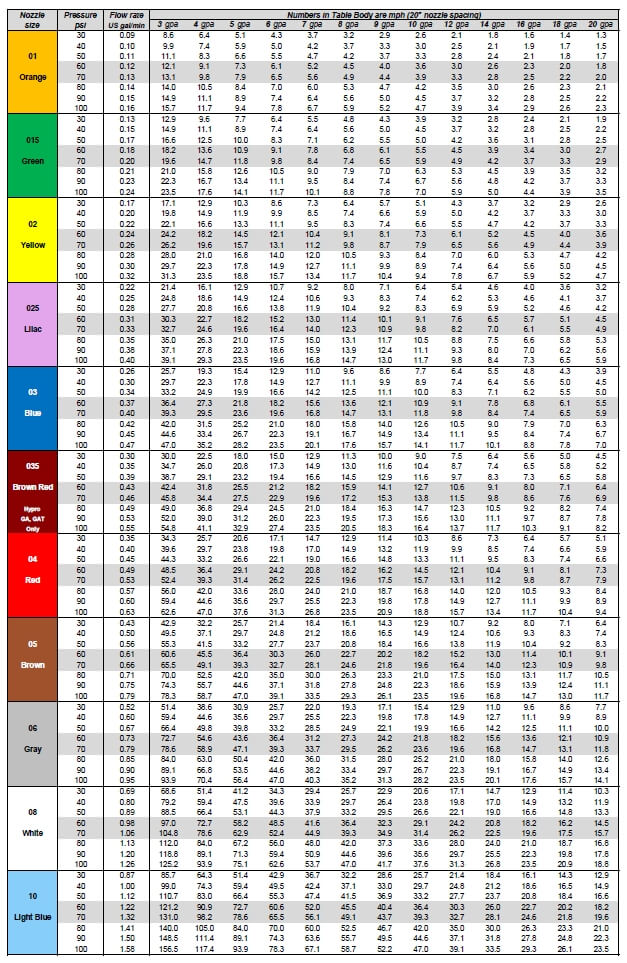
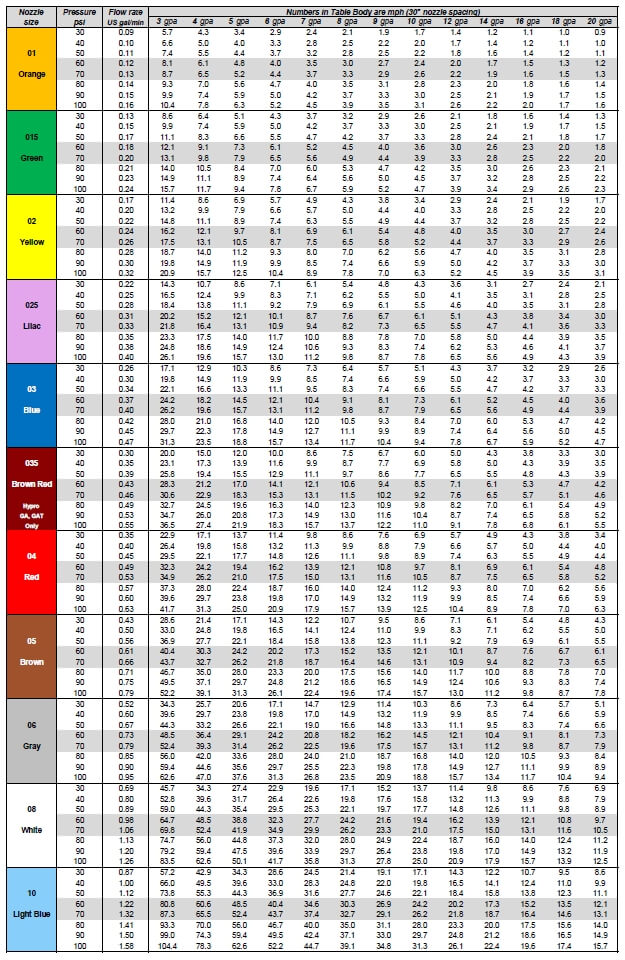
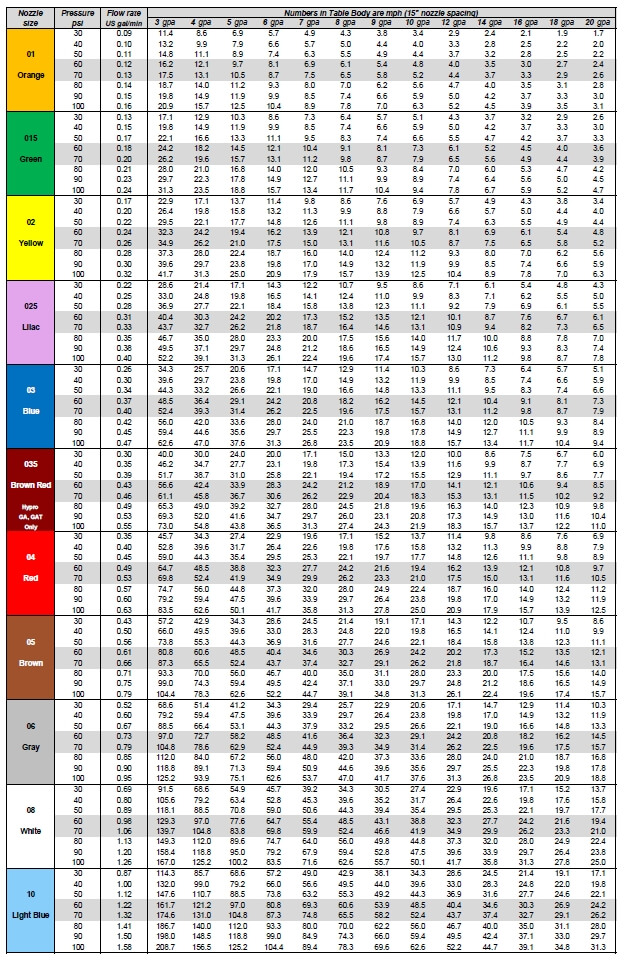
    Need to find the right nozzle size for your application?  Sometimes a simple chart is the easiest way to figure things out.  Print it and place it in your sprayer cab.

    In this chart, identify your water volume along the top row, and follow the column until you encounter the travel speeds you’re interested in.

    Once you’ve encountered your travel speed, move along the row to the left to identify the nozzle size and spray pressure.

    Make sure that your travel speeds are achieved at a pressure that’s right for the nozzle you’re using. For most air-induced nozzles, this will be about 60 to 70 psi (highlighted).

    Once you’ve decided on a nozzle size, the travel speed column for that size becomes the travel speed range at various pressures. Avoid operating a low-drift spray below 30 psi – its pattern will be too narrow and likely its spray quality will be too coarse for good results.

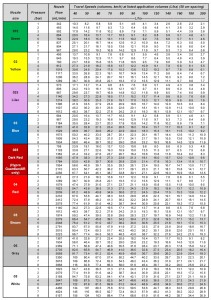
    Click on the images or text below to download a high quality pdf version of each chart, starting from the top with US, 15″ spacing, then US, 20″, then US 30″, then metric, 50 cm. Print, laminate, and place them in your sprayer cab.

    Calibration Chart (US, 15 in)

    Download Application Chart (US units, 15″ spacing)

    Calibration Chart (US, 20 in)

    Download Application Chart (US units, 20″ spacing)

    Calibration Chart (US, 30 in)

    Download Application Chart (US units, 30″ spacing)

    Application Chart 2015 (metric)

    Download Application Chart (metric, 50 cm spacing)

    Make your own chart using this Excel Template.

  • Spray Quality and Volume Matrix

    Spray Quality and Volume Matrix

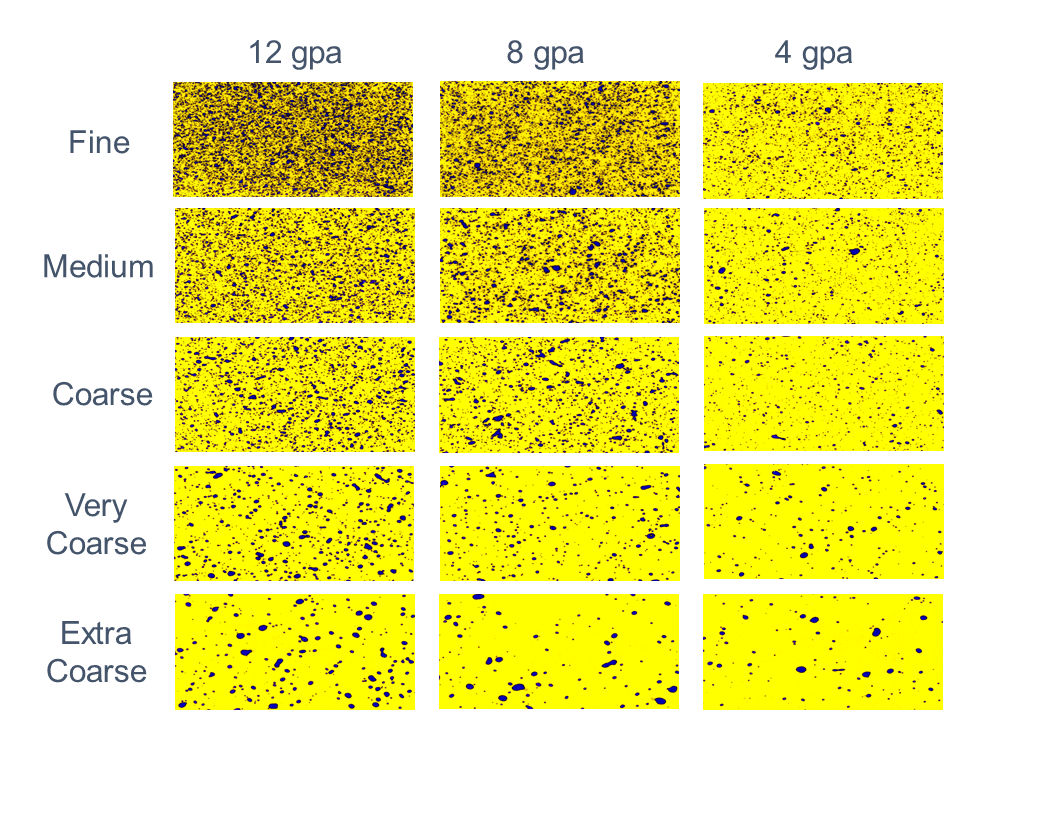
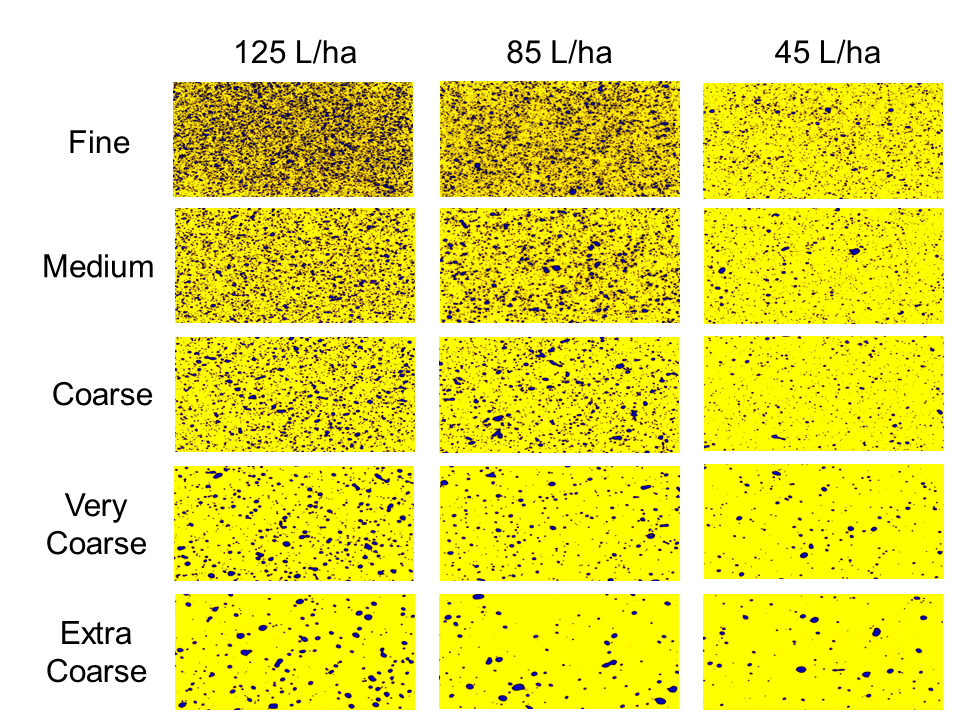
    We often write about how valuable water sensitive paper can be to visualize and assess the coverage we’re getting from a specific application method.  A handy reference is this matrix that combines both factors.  Print it and use it in the field to compare what your application method is doing to these relative standards.  On average, you will want to see deposits similar to those in the middle of the matrix.

    Spray Quality Matrix (US)


    Download US units Matrix here (pdf)

    Spray Quality Matrix (metric)


    Download Metric Matrix here (pdf)


  • How to Use a Nozzle Flow Chart, With a Surprising Twist

    How to Use a Nozzle Flow Chart, With a Surprising Twist

    Undoubtedly, the number one question we get from operators is: “Which nozzle should I get”? Luckily there’s no simple answer, or we wouldn’t have jobs! The reason it’s not simple is because selecting the “right” nozzle for a sprayer is a process. It can be broken down into two steps:

    • identifying the right flow rate (aka nozzle size)
    • choosing a specific nozzle model (i.e. brand, spray pattern type, spray quality, etc.)

    It’s a big question, so let’s tackle just the first bullet: identifying the right flow rate.

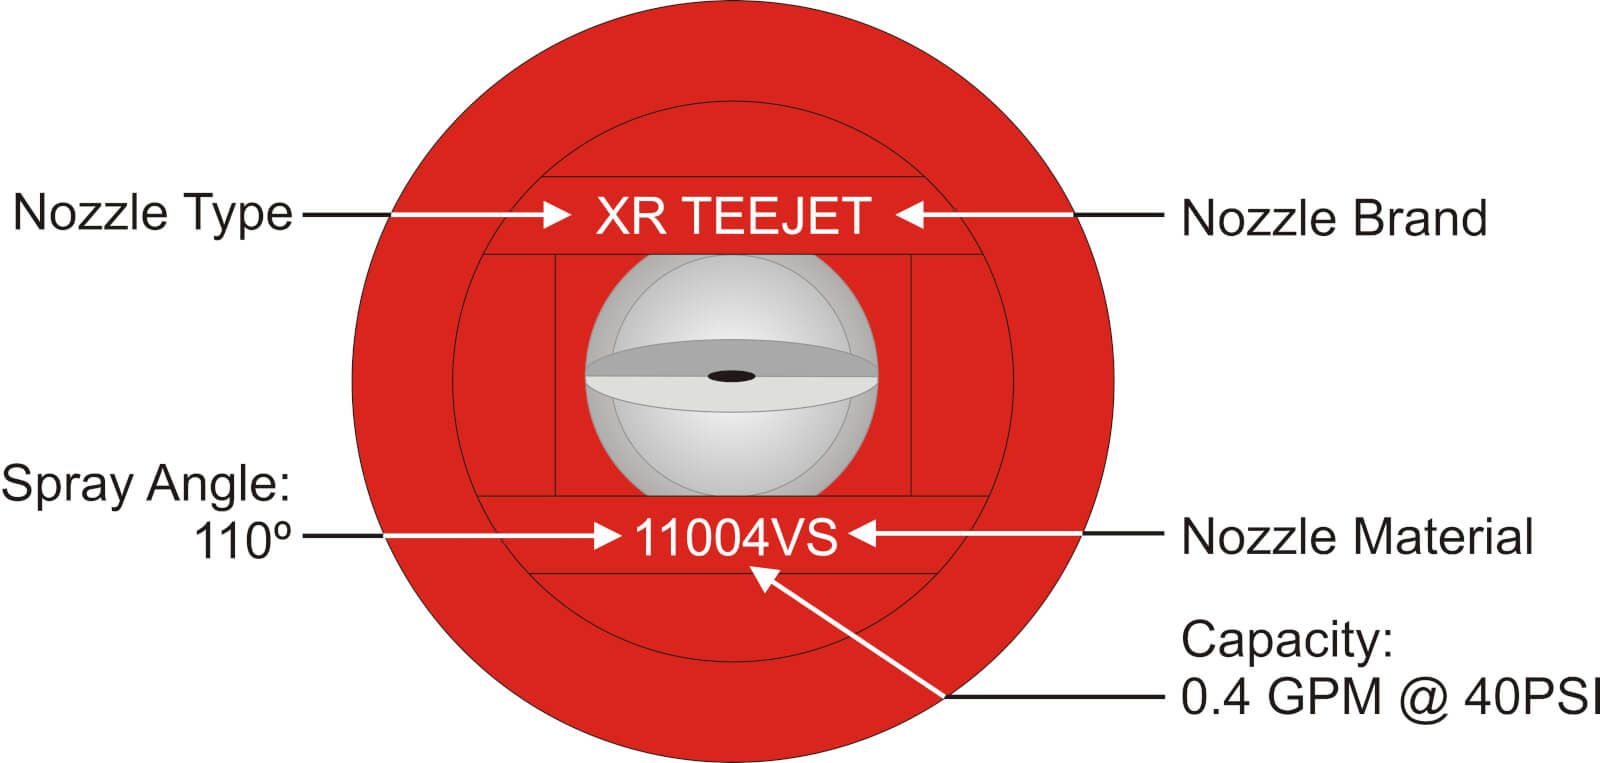
    All sprayer nozzles come in standardized (ISO) sizes, and these sizes are usually identified by numbers stamped on the nozzle as well as the colour of the nozzle itself. The nozzle’s key characteristics (i.e. the fan angle and nominal flow rate), are identified in a format that looks like some version of this (Fig. 1):

    2013_Nozzle_Nomenclature
    Fig. 1: Typical information printed on modern nozzles.

    The 110 refers to the fan angle (110°) and the 04 refers to the flow rate. 04 means 0.4 US gallons of water per minute (gpm) at 40 psi. Each nozzle brand has a slightly different convention, but no matter how the information is presented it ought to be on the nozzle somewhere.

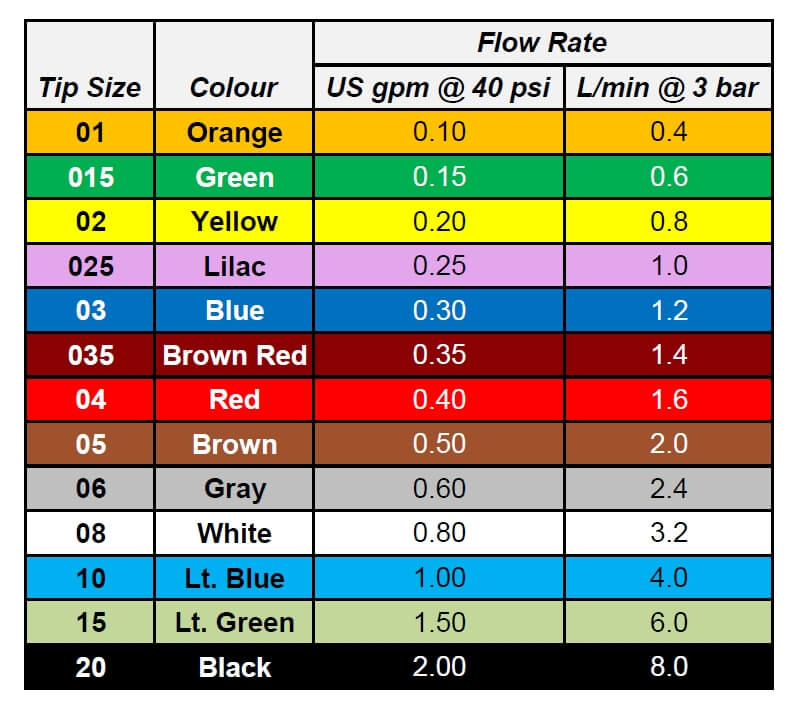
    Nozzle colour has an ISO standard across fan-style nozzles, and we have this table to match the nozzle colour to the flow rate:

    Fig 3: ISO nozzle colours and flow rates

    You’ll note that the nozzle we pictured earlier was “flame red”, matching the 0.4 gpm on the table. So how do we use the table to pick the right size nozzle?

    Application rate (i.e. gallons per acre or L/ha) is a function of travel speed, nozzle spacing along the boom, and nozzle flow rate. Traditionally, this has been expressed as the following formula in US units:

    US Calibration Formula

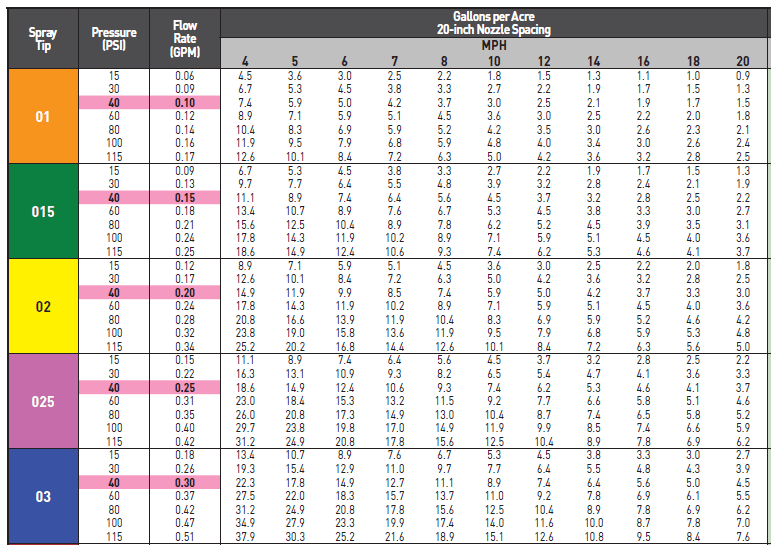
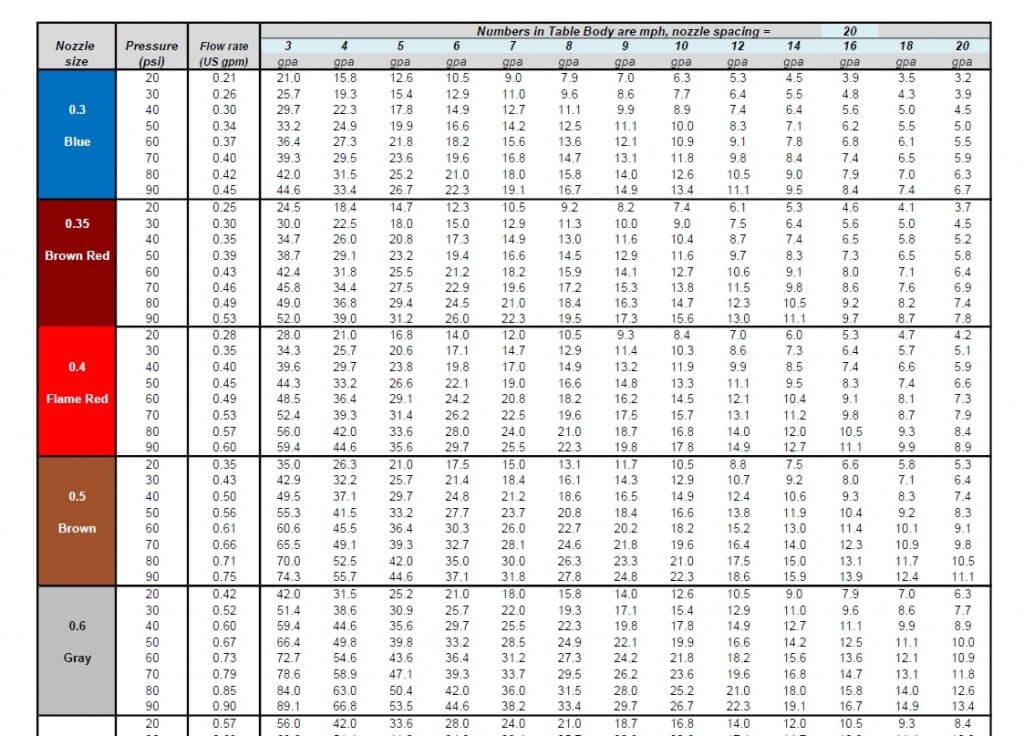
    This formula is famously represented in nozzle charts found in all sprayer catalogues (Fig 4). Along the left side are nozzle sizes and pressures. Along the top is sprayer speed. The body of the table contains application volume. Pick your speed, and look for your application volume in the columns. If you want to apply five gpa, you need to look for the number 5 (or as close as you can get to it), among these numbers.

    Hypro Calibration Chart
    Fig 4: Typical nozzle flow rate chart, with speed at top and volumes in body. Ugh.

    The format of the chart can be confusing because it doesn’t follow a modern sprayer operator’s priorities. Usually, an operator decides on an application volume first, and this decision is not very flexible. Travel speed, decided second, has more flexibility.

    We’ve therefore re-worked the table to make more sense (Fig. 5). Along the top are common water volumes. The body of the table are travel speeds. Pick a water volume at the top and follow the column underneath this value to find a speed range you’re comfortable with. To the left, the nozzle size and corresponding operating pressures are now visible.

    Fig. 5: Nozzle flow rate chart with volumes at top makes it user friendly.

    Try to operate at a spray pressure that’s in the middle of the nozzle’s operating range. For an air-induced nozzle, the range is usually from 30 to 90 psi, so the middle is 60 to 70 psi. That should be the target pressure. Look for a nozzle size that delivers this pressure at your expected travel speed.

    These columns can be used to work out a nozzle’s travel speed range. If a nozzle can be operated between 30 and 90 psi, for example, the corresponding speeds are listed in the same rows in the volume column.

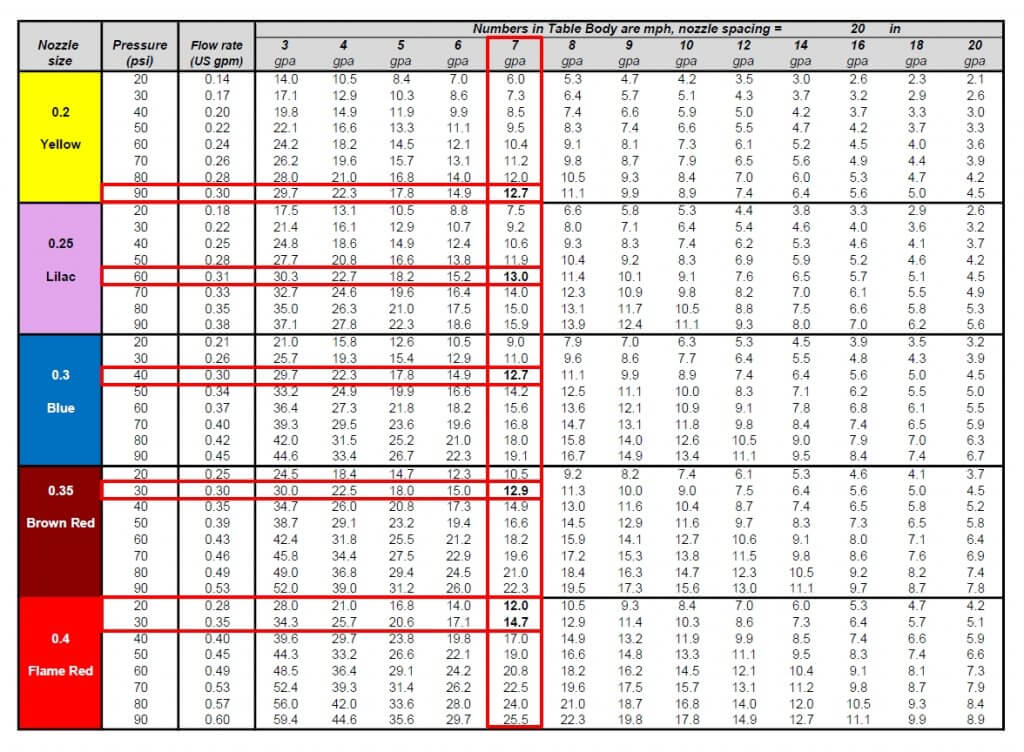
    For example, say you want to apply seven gpa and think that 13 mph would be a good average travel speed.

    Fig 6: Five solutions for the question, “which nozzle to apply 7 gpa at 13 mph?”

    Move down the seven gpa column, and you’ll encounter a value close to 13 mph five times – the yellow nozzle at 90 psi, the lilac nozzle at 60 psi, the blue nozzle at 40 psi, the dark red at 30 psi, and the red at about 25 psi. Now use the columns to see which of these three best matches your expected travel speed range.

    The yellow nozzle would allow between seven and 12.5 mph from 30 and 90 psi, the lilac nozzle nine to 16 mph, the blue nozzle 11 to 19 mph, the dark red 13 to 22 mph, and the red 15 to 26 mph.

    The best choice for a typical air-induced tip would be the lilac 025 size, since it would meet the target speed of 13 mph at a perfect 60 psi, about right for nozzles of that size, and allowing some travel speed flex on the slower side.

    Some operators try to extend that range, but dropping below 30 psi will likely result in too narrow a pattern, or too coarse a spray quality, so it’s not advised.

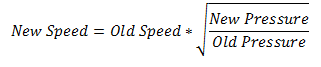
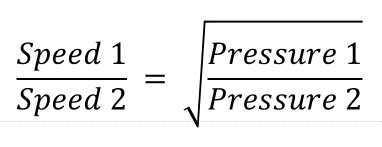
    Note that the three-fold change in pressure from 30 to 90 psi translates to only a 1.73-fold change in travel speed. That’s due to the square-root nature of the relationship, as illustrated by this formula:

    Pressure Formula

    This exercise applies to sprayers with rate controllers that adjust pressure to regulate flow rates. However, if you use pulse-width modulation (e.g. Case AIM Command, Capstan Sharpshooter, Raven Hawkeye, or TeeJet DynaJet) check out this article describing these systems.

    There are a number of apps and websites, usually developed by nozzle manufacturers, which provide similar answers. These are also very useful, and all of them rely on the same formulas used in our new, simplified table. You can go here to download a high resolution version, suitable for framing, in both US and metric units.

  • Rate Controllers and Spray Pressure

    Rate Controllers and Spray Pressure

    Automatic rate controllers are standard equipment on almost all new sprayers. They ensure consistent application volumes, but they don’t do all the thinking for you.  We explore how to make them work properly.

    A rate controller needs to know the boom width (entered by the user), the total spray liquid flow rate (from a flow meter), and the sprayer speed (gps, radar).  It controls the spray liquid pressure by opening or closing a bypass valve. More pressure equals more flow to the boom.

    The rate controller allows the applicator to enter a desired application volume and the controller sets the spray pressure that gives the necessary flow for the application volume and sprayer travel speed being used. In practice, this means that higher travel speeds result in higher spray pressure, and vice versa.

    But it’s not that simple. Rate controllers aren’t smart enough to know how pressure affects nozzle performance. Some nozzles don’t work well at low pressures. Others do a poor job at high pressures. Some sprayer pumps may even have a problem generating some of the higher pressures a rate controller calls for. What does that mean for the available travel speed range that’s possible with any given nozzle? To answer that question, we first have to have a closer look at how pressure affects nozzle performance.

    Spray Pressure and Nozzle Performance

    Nozzle performance depends on a number of factors. Of these, the most critical is spray pressure. Pressure affects the flow rate of the nozzle, the spray pattern (fan angle) and the spray quality (droplet size range). The last two of these affect coverage, overlap, and spray drift, so it’s important to get them right. Each nozzle model has a unique spray pressure range and unique spray qualities within that range, so one must obtain information that is specific to the nozzles on the spray boom from the nozzle manufacturer.

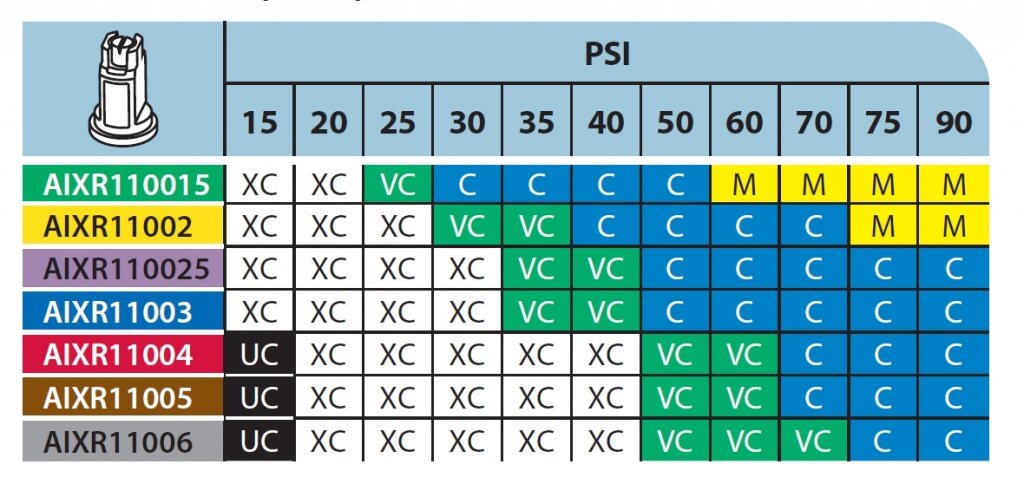
    ASABE spray quality for the TeeJet AIXR nozzle.

     Catalogues Contain Important Information

    Nozzle manufacturer catalogues identify the pressure range over which the nozzle should be operated. At low pressures, engineers look for a uniform pattern that meets the advertised fan angle. The upper pressure limits are kept low enough to prevent the formation of excessively fine sprays. Manufacturers now publish tables containing “Spray Quality”, a broad categorization of droplet size, for their various nozzles and spray pressures in their product line. Common spray qualities for agricultural nozzles are Fine (orange), Medium (yellow), Coarse (blue), Very Coarse (green), and Extremely Coarse (white). An example table from a catalogue is shown in Figure 1. Note that for any given nozzle flow rate (left column), the spray quality changes with spray pressure. For example, the TT110025 nozzle can produce a Very Coarse or a Fine spray, depending on the pressure. Also note that for any given pressure, higher flow rate nozzles produce coarser sprays. At 40 psi, the TT nozzle can produce a Medium, Coarse, or Very Coarse spray, depending on its nominal flow. Both of these relationships depend on the nozzle model and manufacturer.

    Speed-Pressure-Spray Quality Relationship

    As we increase spray pressure, flow rate increases with a square-root relationship.

    Speed-Pressure resize
    The square root relationship between travel speed (or flow rate) and spray pressure for hydraulic nozzles

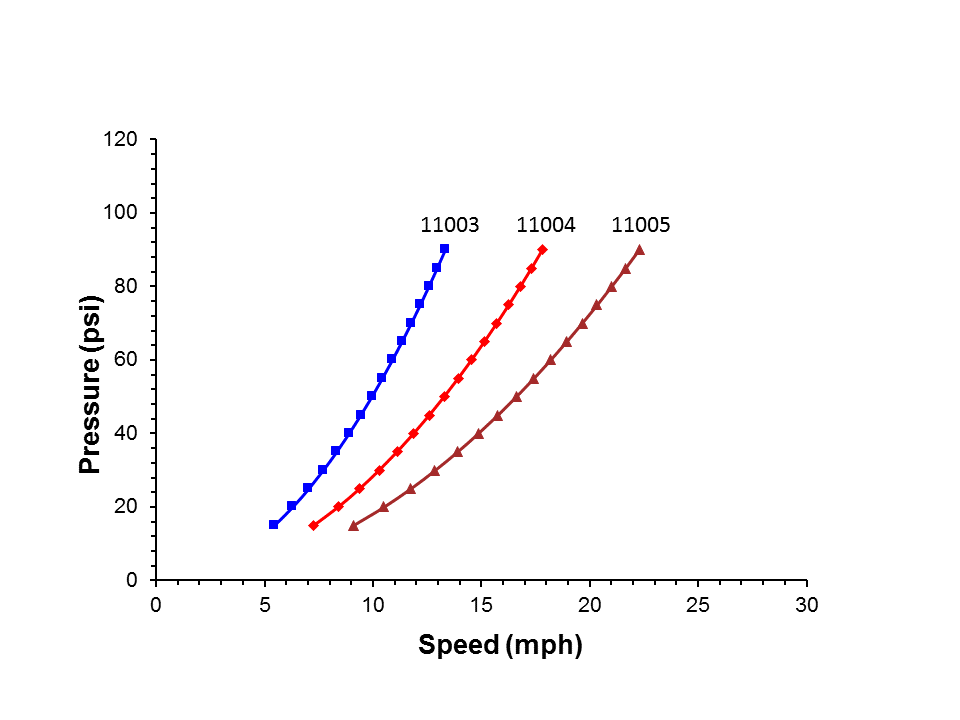
    This means that in order to double the flow rate, we need to increase spray pressure by a factor of four. Figure 2 shows three different flow rate tips, each applying 10 US gpa at a range of travel speeds. Assume the operator uses a AIXR11004 to apply 10 US gpa at 12 mph. The nozzle would operate at about 40 psi, producing an Extremely Coarse spray quality. If the sprayer slows down to 7 mph to initiate a turn, spray pressure will drop to 15 psi, producing an Ultra Coarse spray. The spray pattern would likely become noticeably narrower, and poor pest control performance is likely in this situation due to the coarseness of the spray.

    Relationship between travel speed and spray pressure for three nozzles applying 10 US gpa

    It would have been better to use the AIXR11003 nozzle.  At 12 mph, this nozzle would have operated at about 70 psi, producing a Coarse spray.  Slowing down to 7 mph would drop the pressure to 25 psi, producing an Extremely Coarse spray.  If the pesticide being used is sensitive to spray quality, then perhaps such slow speeds should be avoided in order to maintain a higher pressure and finer spray.

    The lesson from this exercise is three-fold: (a) size the nozzle to operate at a higher pressure at your target speed to avoid dropping the pressure too low when you slow down, (b) avoid going as slow as 7 mph to prevent the pressure from dropping too low (c) compromise by setting a minimum spray pressure on the rate controller, in which case you’d over-apply product somewhat when their speed dropped too low.

    Spray Pattern Overlap

    Flat fan nozzle patterns need the correct overlap in order to achieve a uniform spray pattern under the boom. Research has shown that the amount of overlap for low-drift nozzles needs to be at least 100% to achieve optimum nozzle performance. In other words, the edge of a fan should reach into the centre of the adjacent fan (Figure 3), with each fan covering twice the nozzle spacing at target height. This amount of overlap assures that not only the spray volume is uniformly distributed, but that the droplet density is equally uniform. Less overlap may result in fewer droplets depositing in the overlap region, resulting in poor coverage and reduced pesticide performance.

    Nozzle Pattern Overlap
    100% overlap means that all areas under the boom receive spray from two adjacent nozzles.

    Adjust the boom height so that at the lowest expected spray pressure (slowest planned travel speed), the nozzles still achieve 100% overlap. There is no disadvantage with greater than 100% overlap, but higher booms will lead to greater drift. When a choice exists, choose 110º fan angle nozzles. Most air-induced nozzles are produced at one (usually wide) fan angle only, but actual angles often differ from those advertised. It is important to visually check the overlap before spraying.

    Recommendations

    What does this mean in practice? Spray operators need to know the right spray quality for the job, and should consult with the pesticide product manufacturer. They also need to use nozzle manufacturers’ charts to identify the spray quality their nozzle will likely produce at their expected application volume and travel speed. If it’s a poor match, a different nozzle may need to be found. Here are some rules of thumb:

    1. Choose a nozzle that produces a Coarse spray over most of the operating pressures you expect to use. Although Very Coarse sprays can work in most situations, avoid them when using lower water volumes, controlling grassy weeds, or using contact modes of action.
    2. Minimize spray drift by avoiding nozzles or pressures that produce Medium or Fine spray qualities.
    3. Make your pressure gauge your speedometer. First, choose a pressure that is in the middle of the nozzle’s recommended operating range. If the range is 15 to 90 psi, select 50 psi. If it’s 40 to 100 psi, select 70 psi. This allows you slow down or speed up somewhat without breaching the nozzle’s capabilities.
    4. Identify the travel speeds that are possible without creating spray qualities that could compromise your application goals.
    5. Visually inspect the spray pattern at the pressure extremes you expect to spray at. At the lowest pressure, your nozzle should still produce 100% overlap (the edge of the spray fan should come to the middle of the next nozzle at target height). If it doesn’t, choose a wider fan angle nozzle, increase spray pressure or elevate the boom.
    6. Make sure your pump can produce the higher spray pressures you expect to need. Pressure limitations are greatest at high flow rates (fast travel speeds applying large water volumes).
    7. Be prepared to compromise. It’s rarely possible to travel at the exact speed, obtain the perfect pressure, and apply the desired water volume that’s been worked out in the office or using manufacturer’s charts. If in doubt, choose slower speeds or higher water volumes to make things work out.

    Nozzle manufacturers are getting much better at producing information that helps applicators produce good spraying outcomes. Learning how to use this information is the first step.