This research was performed in 2012 and since then there have been considerable advances in application technology for asparagus in fern that should be considered. Be sure to read the epilogue at the end of this article.
Introduction
Diseases such as purple spot can have major economic impacts for asparagus growers, and the best line of defence is spraying the appropriate control products. The good news is that asparagus growers know this. The bad news is that there are few things harder to spray than asparagus in fern.
Asparagus infected with purple spot.
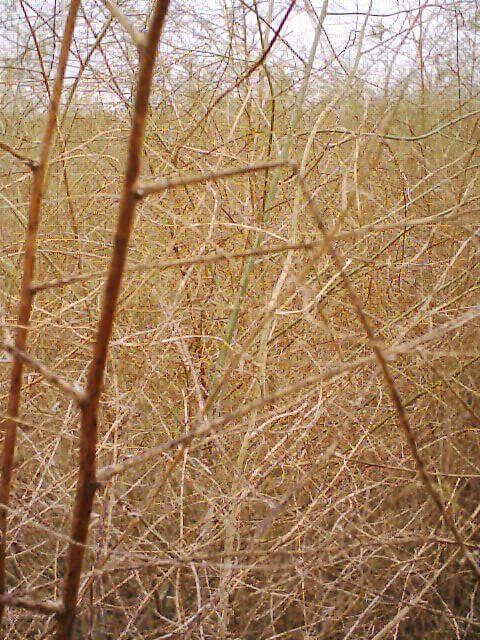
Asparagus in fern can stand 1.5 m (5 ft) high by 1.0 m (3 ft) diameter and is typically planted on 1.2 m (4 ft) centres. Asparagus in fern has a very dense canopy full of needle-shaped leaves. This dense canopy slows air movement, making conditions still, humid and very difficult for a spray droplet to penetrate.
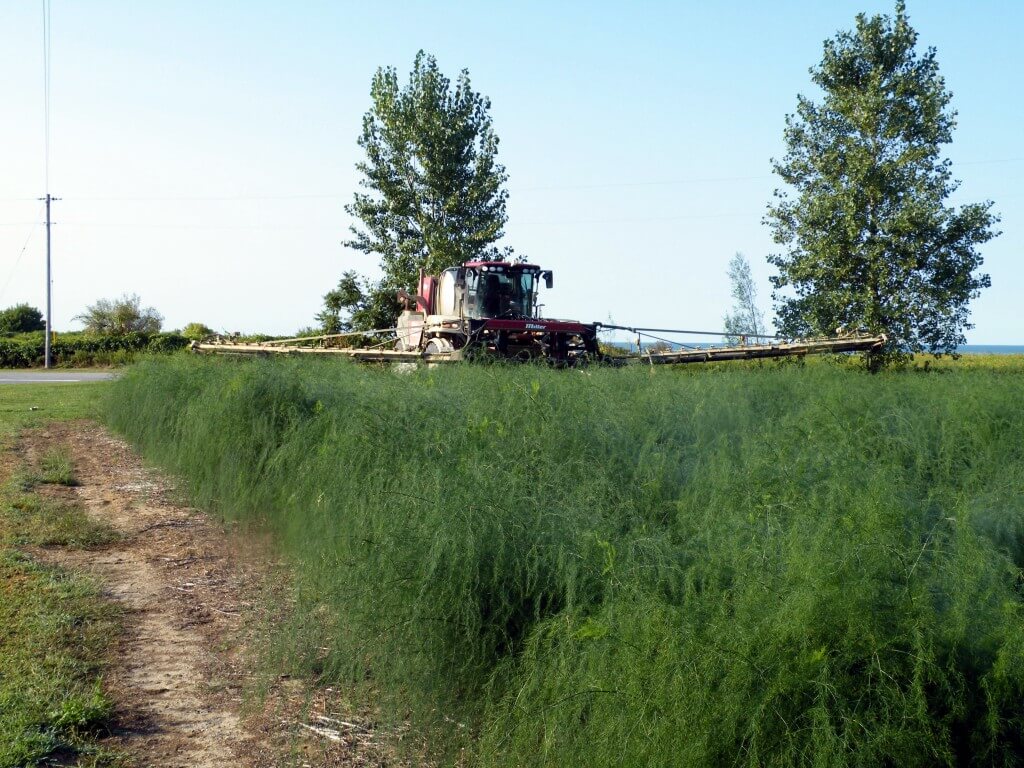
Spraying asparagus in fern.
Spray coverage is a combination of two factors: the area of the target contacted by spray droplets, and the distribution of spray droplets over that target. For most insecticide and fungicide applications, reasonable coverage is reflected by 10-15% surface area covered paired with an even distribution of approximately 85 medium sized droplets per square centimeter. This is not a rule, but a guideline.
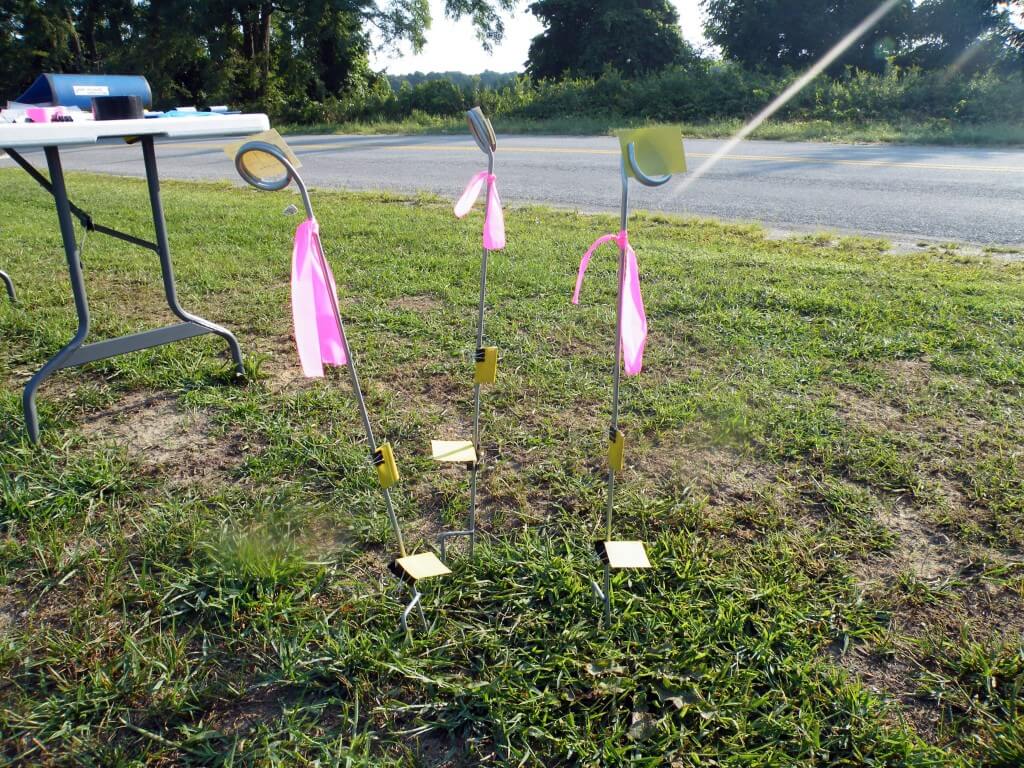
In order to determine the best way to spray, we have to be able to compare the coverage achieved. To do this, we used water sensitive paper, which is yellow until contact with spray turns it blue. Three sets of three targets were placed in approximately the same location for each pass.
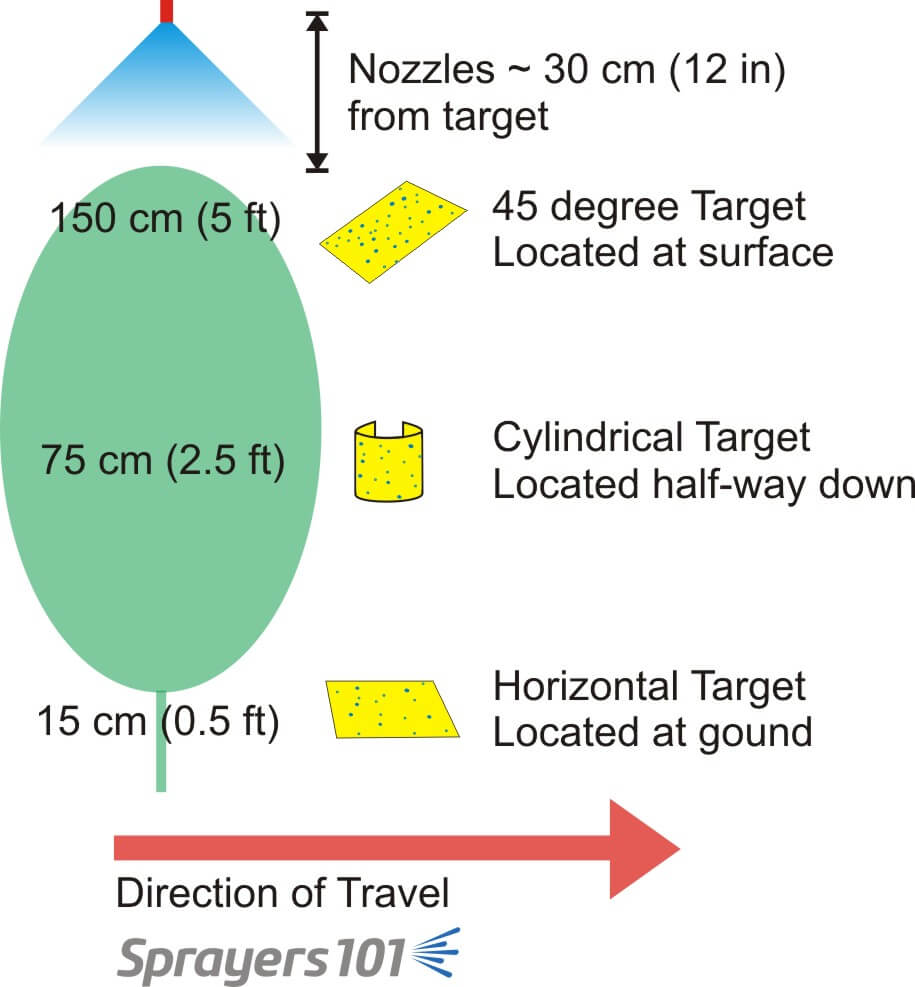
Water sensitive paper arranged on stands, ready to be placed in the fern.Water sensitive paper orientation and location in asparagus canopy relative to sprayer direction.
We tested five popular nozzle types, at two ground speeds using three carrier volumes to answer three questions:
Does spray volume impact spray coverage?
Which nozzle style gives the best coverage?
Does travel speed impact spray coverage?
Does spray volume impact spray coverage?
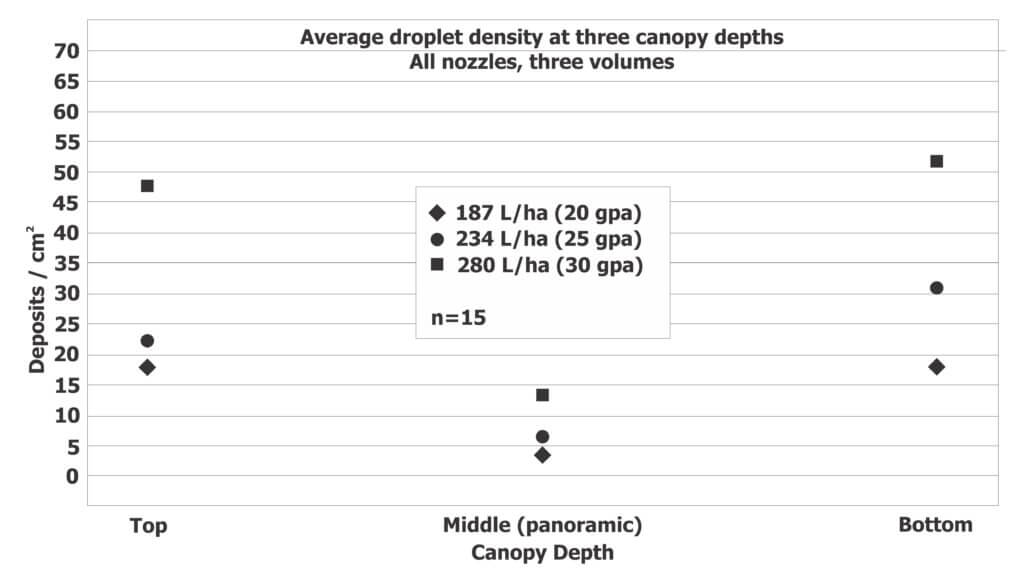
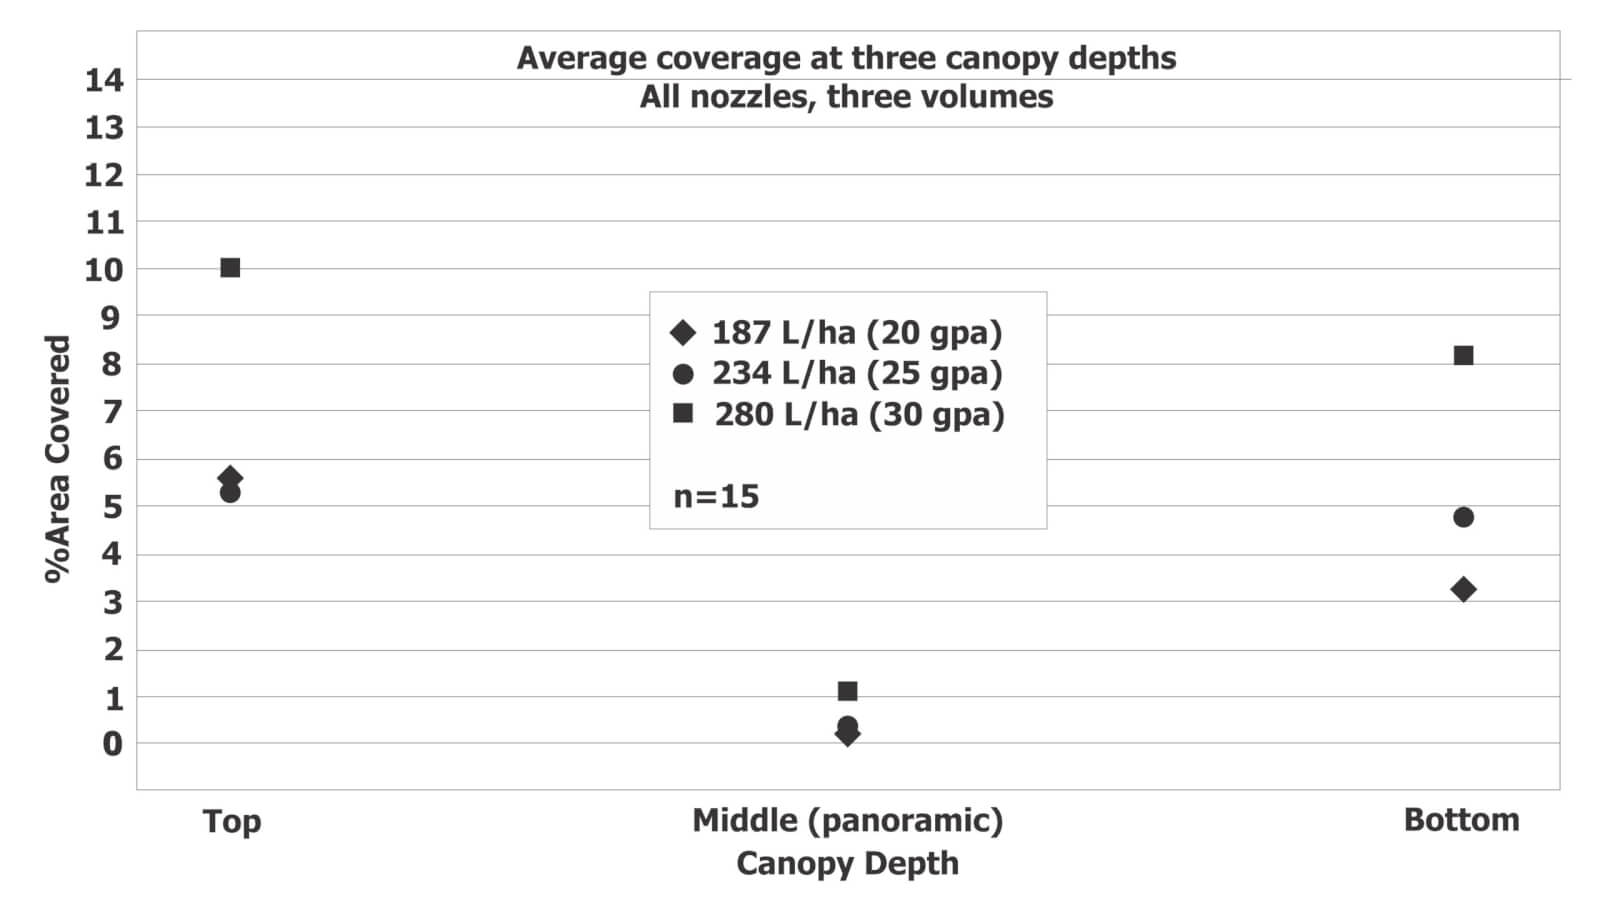
Five different nozzle types were used to spray three volumes onto the targets at 16 kmh (10 mph). This was repeated three times and target coverage was determined both as droplet deposits per cm2 (see Figure 1) and total % covered (see Figure 2).
Figure 1. Average deposits per cm^2 for five different nozzle types at 187 L/ha (20 US gpa), 234 L/ha (25 US gpa) and 280 L/ha (30 US gpa) at a ground speed of 16 kmh (10 mph).Figure 2. Combined average percent coverage for five different nozzle types at 187 L/ha (20 US gpa), 234 L/ha (25 US gpa) and 280 L/ha (30 US gpa) at a ground speed of 16 kmh (10 mph).
Cards in each position consistently received a significantly higher average deposit per cm2 and significantly higher average percent coverage at higher spray volumes. The relatively low coverage in the middle position was anticipated given the orientation of the targets to the sprayer.
Therefore, it would appear higher volumes result in better coverage, at least up to 280 L/ha (30 gpa). Generally, there is a threshold where exceeding a given carrier volume results in a diminishing return.
Which nozzle gives the best coverage?
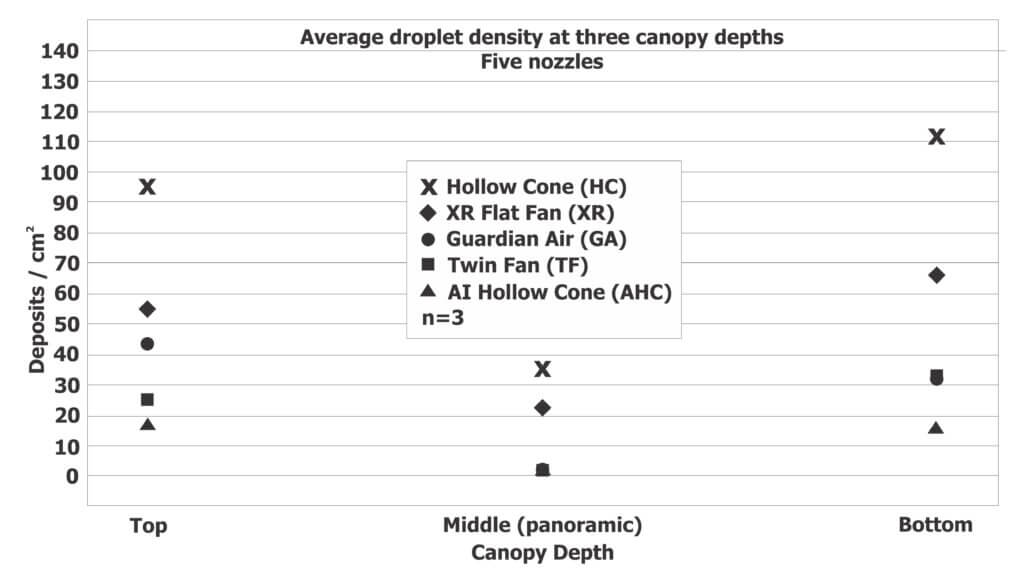
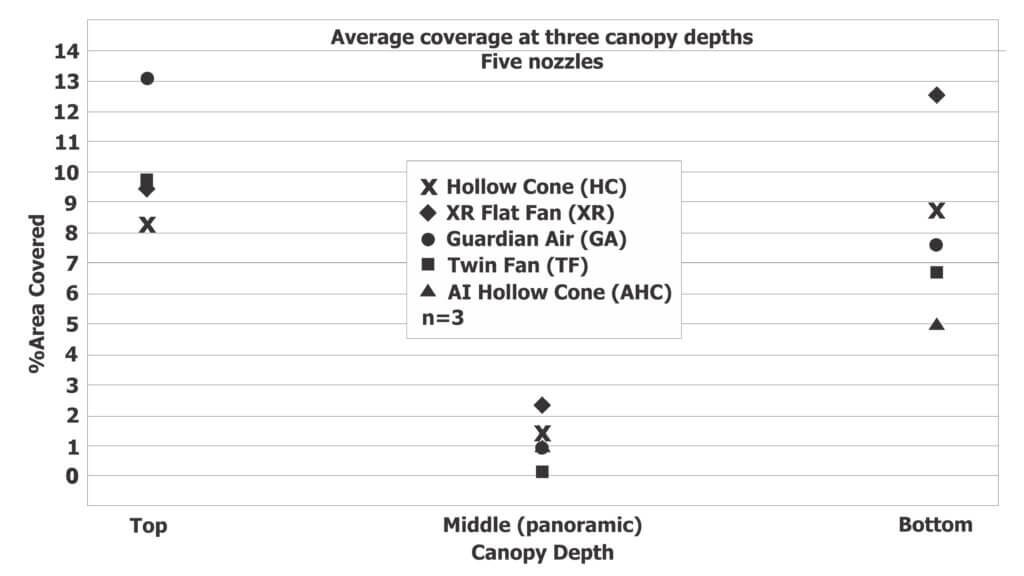
Coverage from five different nozzles was compared: the Hollow cone, Flat fan, Dual flat fan, Guardian Air and Air-induced hollow cone. Given that 280 L/ha (30 gpa) resulted in the best coverage, the following figures illustrate droplet deposits per cm2 (see Figure 3) and total % covered (see Figure 4) at 280 L/ha (30 gpa).
Figure 3. Average deposits per cm^2 for five different nozzle types at 280 L/ha (30 US gpa) and 16 kmh (10 mph).Figure 4. Average percent coverage for five different nozzle types at 280 L/ha (30 US gpa) and 16 kmh (10 mph).
The graphs show that each nozzle followed a similar trend, with more droplets at the top of the canopy, less or par at the bottom of the canopy, and considerably less in the middle of the canopy (which is not surprising given the orientation of the target around the stem).
The trend in droplet density from highest to least coverage is:
Hollow Cone
XR flat Fan
Guardian Air
Dual Flat Fan
Air Induced Hollow Cone
The percent coverage data was less clear. The top two nozzles for each position were:
Top Target:
Guardian Air
All other nozzles approximately the same
Middle Target (around the stem):
XR flat Fan
Hollow Cone
Bottom Target:
XR flat Fan
Hollow Cone
It can be argued that the target at the top of the canopy is easiest to spray, and therefore does not have as much importance as the middle and bottom targets. As such, it would appear that the XR flat fan and Hollow cone nozzles give the best overall coverage. It is debatable whether the higher droplet count from the Hollow cone is more important than the higher percent coverage of the XR flat fan.
Does travel speed impact spray coverage?
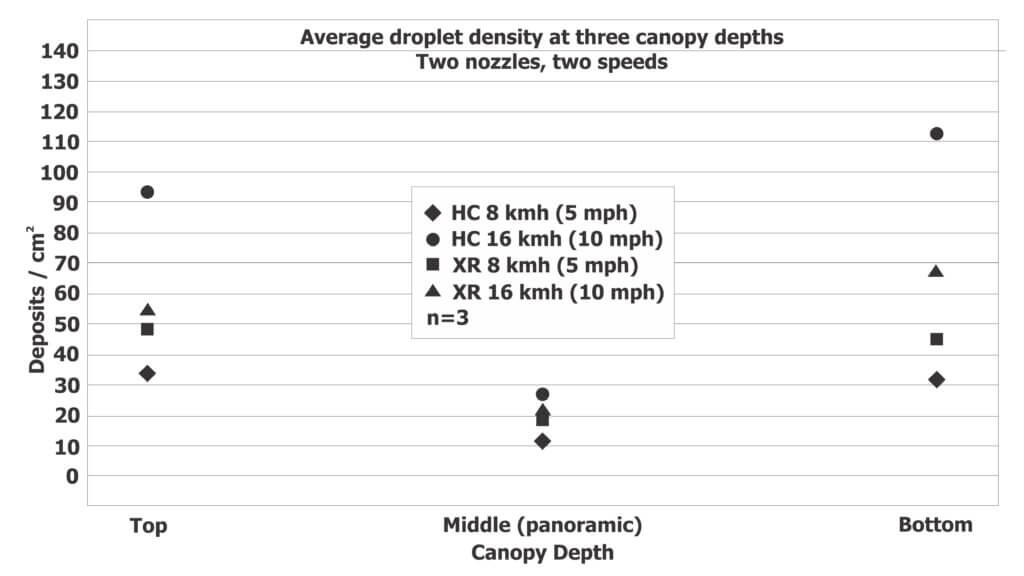
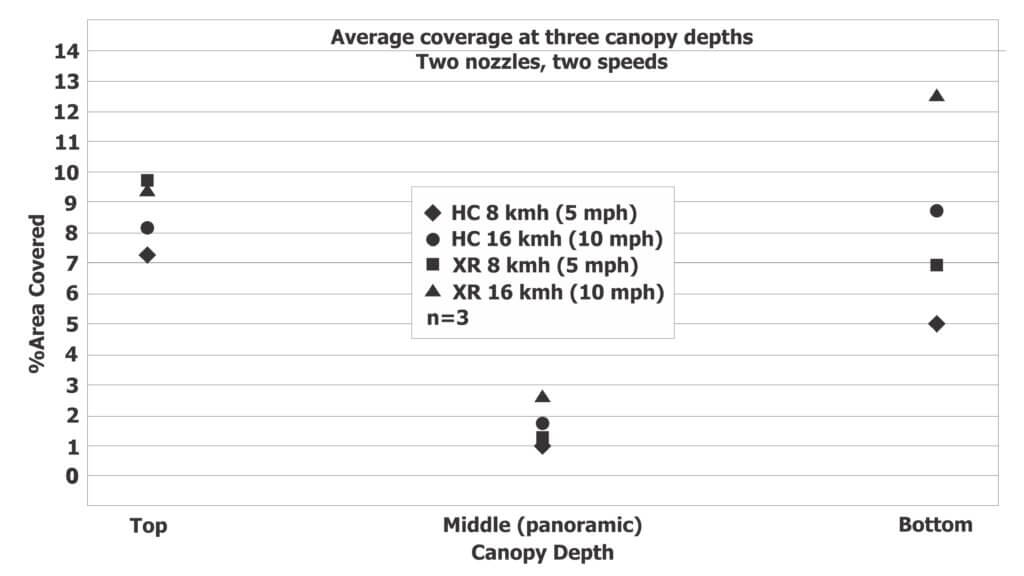
Hollow cone nozzles and XR flat fan nozzles were used to spray targets at two travel speeds and three volumes. Target coverage was determined both as droplet deposits per cm2 (see Figure 5) and total % covered (see Figure 6).
Figure 5. Average deposits per cm^2 for Hollow cone and XR flat fan nozzles at 280 L/ha (30 US gpa) and either 8 kmh (5 mph) or 16 kmh (10 mph).Figure 6. Average percent coverage for Hollow cone and XR Flat fan nozzles at 280 L/ha (30 US gpa) and either 8 kmh (5 mph) or 16 kmh (10 mph).
The variability in deposit density and percent coverage from medium/fine droplets created by the hollow cone nozzles make it difficult to determine statistical significance, but the trend suggests that higher ground speeds improve coverage in the middle and bottom of the canopy. This is likely due to the wake of the sprayer and the vortices created by its passage stirring fine droplets into the canopy.
Overall recommendations
The data suggest that coverage was improved when the sprayer travels at 16 kmh (10 mph) rather than 8 kmh (5 mph). Coverage was also improved at higher spray volumes, where 280 L/ha (30 US g/ac) provided the best overall coverage for all nozzles. As for the best nozzle, this depends on the application; the hollow cone created higher droplet densities than the XR flat fan, but the XR Flat fan created higher percent coverage. Higher droplet densities may be preferred when controlling disease with contact products, but spray drift becomes a significant concern. Higher percent coverage might be preferred with locally systemic products where complete coverage is less of a concern and preventing spray drift is a priority.
Epilogue
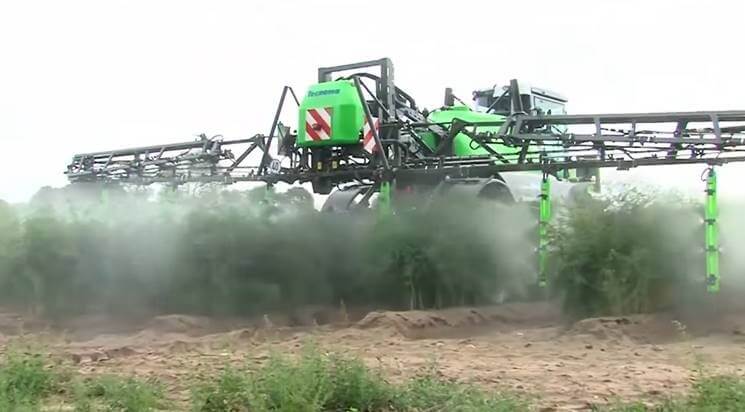
This work was performed in 2012. Since then there have been significant advances in sprayer design for spraying asparagus in fern. Dr. Torsten Balz (Bayer Application Technology Manager) kindly provided an example of such a sprayer (see below) and a video link to watch it in action. Drop arms that bring the nozzles closer to the target at all canopy depths are an ideal solution as long as the row spacing allows clearance without snagging the drops. Further, there have been developments regarding the use of hollow cones in an overhead broadcast application. Over- and under-laps in the hollow cone swath lead to double-dosing and gaps respectively that are referred to as “Technical Strip Disease”. Combined with considerable drift potential, hollow cones are not recommended.
Air-assisted drop arms greatly improve coverage uniformity in asparagus in fern. Photo kindly provided by Dr. Torsten Balz.
Special thanks to Max Underhill Farm Supply (Vienna, Ontario) for use of their sprayer and their assistance both spraying and placing water sensitive papers in the field. Thanks to Mr. Ken Wall of Sandy Shore Farms Ltd. (Port Burwell, Ontario) for providing the site and hosting the associated workshop, and thanks to TeeJet Technologies for their donation of parts and supplies.
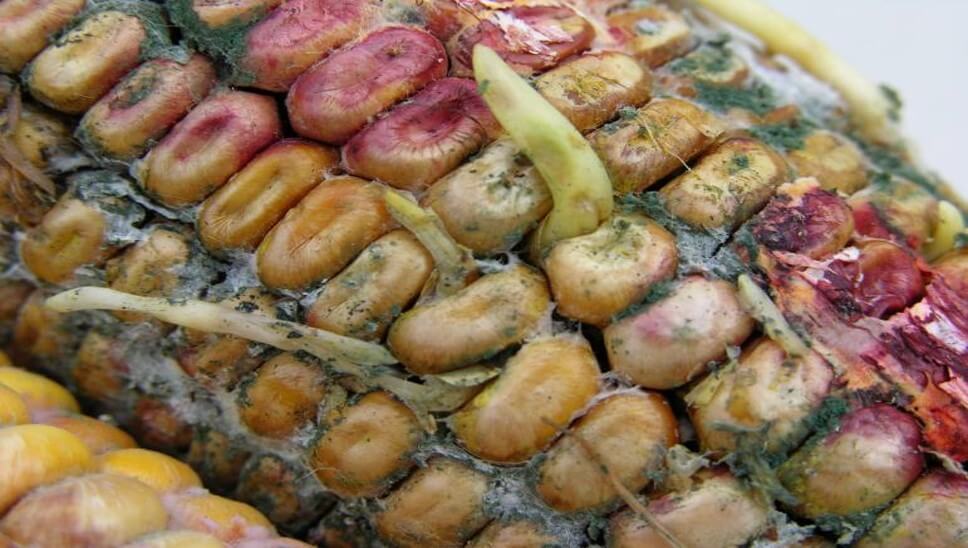
Gibberella ear rot is a significant disease that reduces the quality of grain corn, especially with the accumulation of mycotoxins (such as Deoxynivalenol (DON)) produced from the causal pathogen(s). Infection occurs through the corn silk channel when ideal temperatures (~27°C) and high humidity are present. Cool, wet conditions after pollination favour disease development and determine the degree of infection. With crop management practices providing only modest improvements in disease control, strategies to increase the efficacy of fungicides are important to investigate. Research has shown that the timely application of fungicide labelled to suppress the disease can reduce mycotoxins, but only by ~50%. We wondered if changes in the method of application could give better results.
Gibberella ear rot
It is reasonable to assume that improvements in spray deposit uniformity and increases in overall spray coverage (up to some threshold) at the infection channel (i.e. the silks) should result in improved efficacy. Water sensitive paper is an excellent tool for the qualitative evaluation of spray coverage. However, recognizing the complicated relationship between dose and coverage, we also looked at the deposition of copper sulphate as a surrogate for active ingredient .
Our primary objective of this study was to compare various sprayer systems and nozzle configurations by evaluating both spray coverage and copper sulfate deposition at the silks.
Experimental Design
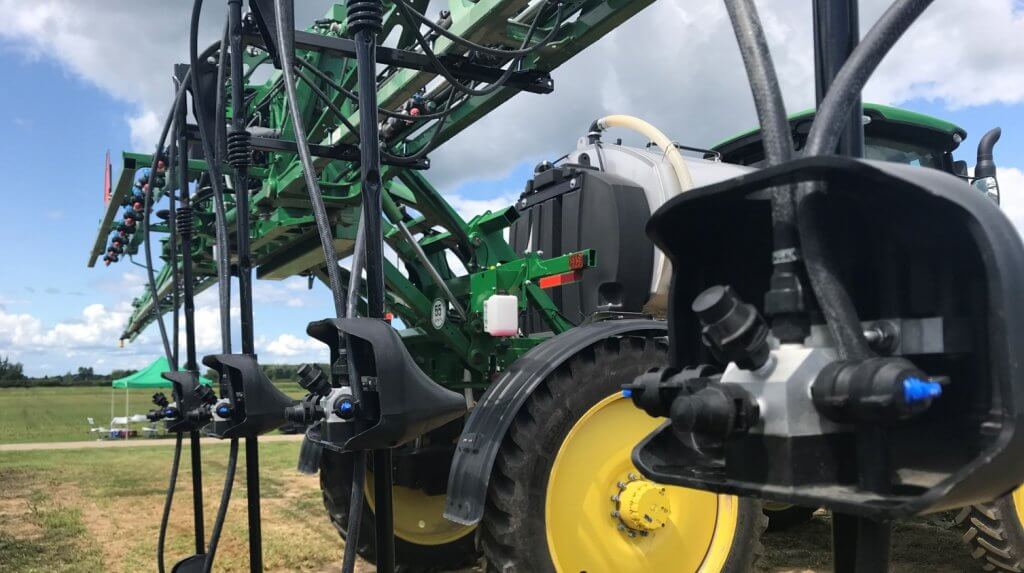
The test field of hybrid corn had a stand of ~80,000 plants/ha. It was located at Ontario’s U of G Ridgetown Campus and was managed similar to a grower’s field (e.g. fertility, etc.). In August of 2019 we evaluated nine sprayer rigs (or nozzle configurations) in a randomized block design.
The ground rigs were calibrated to deliver a spray volume of 190 L/ha and the aerial systems to deliver 47 L/ha. In order to achieve the target spray volume, the ground rig speed varied from 9.5 to 13 km/h, depending on nozzle configuration. The aerial applicators used the same nozzle configuration, travel speed and altitude as in their commercial field applications.
Sprayer
Nozzle Set
Notes
John Deere
Yield Center 360 UNDERCOVER drop pipes 75 cm (30″) spacing, each equipped with two Turbo TeeJet (TT) nozzles.
Drop pipes were centred between corn rows with nozzles adjusted to spray ~horizontally and directly at the corn silks.
John Deere
Pentair Hypro Guardian Air nozzles on 50 cm (20″) spacing.
Boom positioned to create 100% spray overlap at tassel height.
John Deere
Turbo TeeJet Induction (TTI) nozzles on 50 cm (20″) spacing.
Boom positioned to create 100% spray overlap at tassel height.
John Deere
Turbo TeeJet (TT) nozzles on 50 cm (20″) spacing.
Boom positioned to create 100% spray overlap at tassel height.
New Holland (front-mounted boom)
Wilger 60 degree conventional flat fan nozzles on 40 cm (16″) spacing.
Boom positioned to create 100% spray overlap at tassel height.
New Holland (front-mounted boom)
Wilger 60 degree conventional flat fan nozzles alternating with custom-made Wilger 40 degree conventional flat fan nozzles on 40 cm (16″) spacing.
40 degree nozzles were positioned between corn rows (interrow) while 60 degree nozzles were positioned over the tassels.
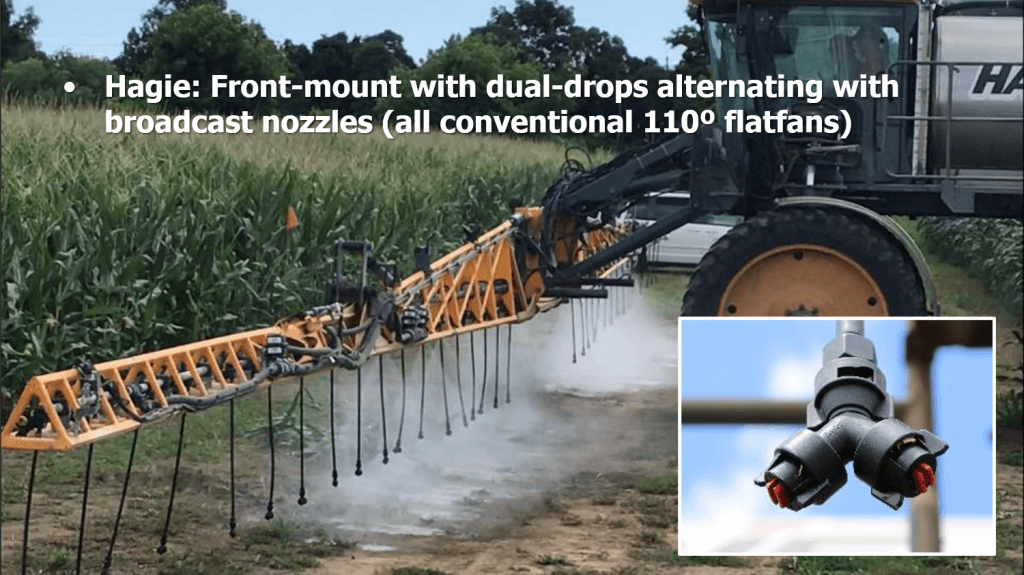
Hagie (front-mounted boom)
Drop hoses terminating with TeeJet Duo Nozzle bodies equipped with Turbo TeeJet Induction (TTI) nozzles were alternated with TeeJet XR110 nozzles.
Drop hoses were centred between corn rows but nozzles were not aimed directly at the corn silks (aimed down 45 degrees and spray parallel to ground rather than perpendicular). They alternated with the AI nozzles positioned over the tassels.
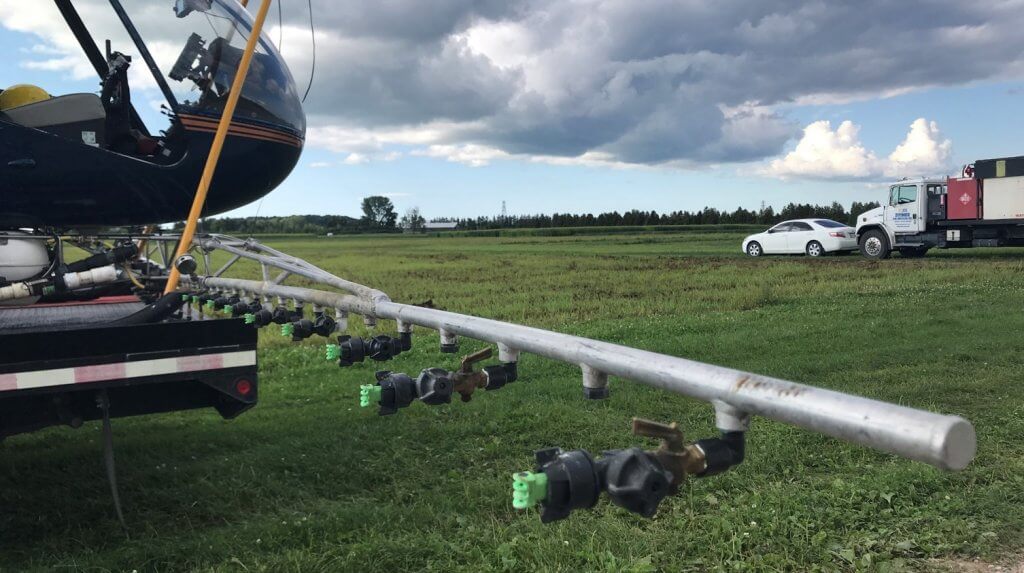
Helicopter
Air Induction TeeJet Turbo TwinJet (AITTJ) nozzles directed backwards.
Airplane
CP-111T nozzle bodies with CP256-4015 40 degree flat fan tips on 15 cm (6″) spacing.
Wingspan was 14.2 m with a 10.6 m boom width.
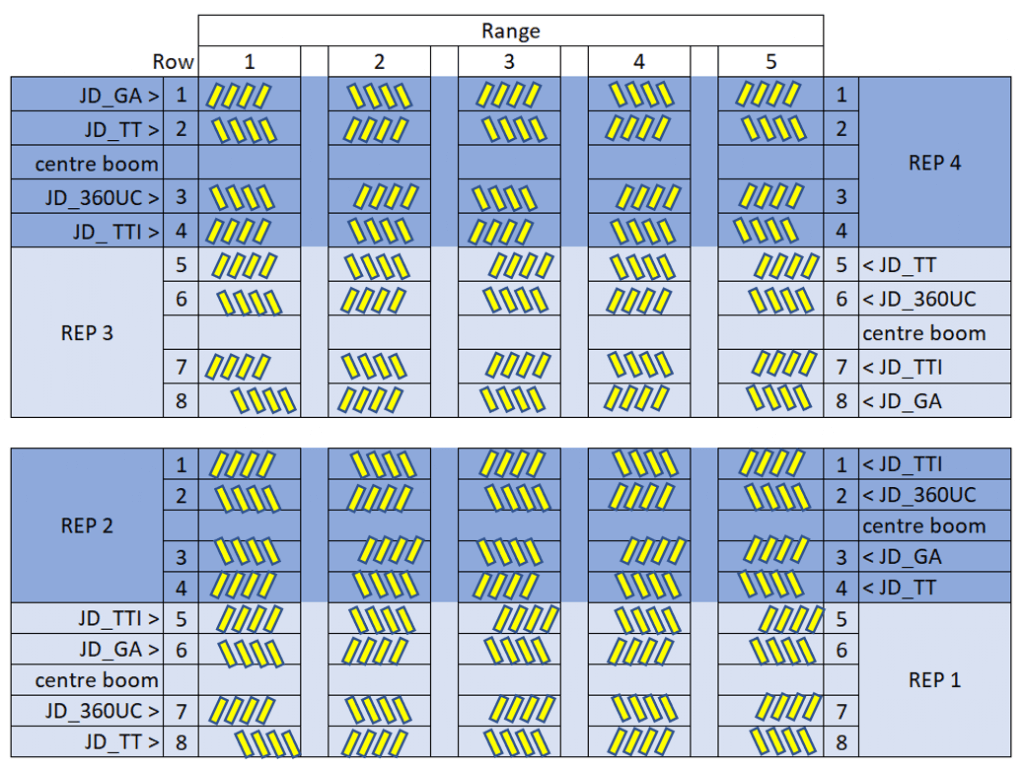
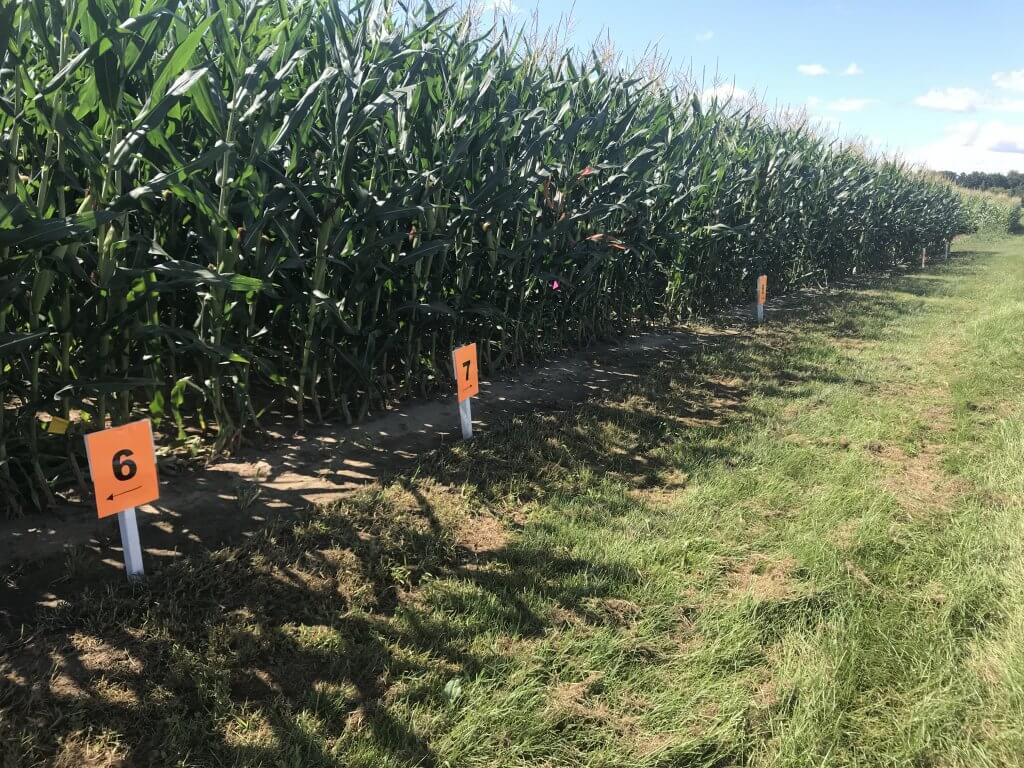
The field was divided into four replicated blocks (REP 1-4 in the image below) which corresponded with a single pass of the sprayer. The sprayers alternated direction with each pass over the four blocks. Depending on the ground rig, a single pass through a block might include more than one set of nozzles. For example, in the image below, a John Deere sprayer carried a different nozzle set on each of four sections, leaving the centre boom section off. Therefore, each block was subdivided into four experimental units that corresponded with each nozzle set. Further, to account for variability, each experimental unit was further subdivided into five ranges. Four water sensitive papers (yellow rectangles) were oriented sensitive-side up and fastened to random corn plants directly on top of silks at each of the five intersections between range and treatment for a total 20 papers. This was replicated four times for a final count of 80 papers per treatment.
The experimental unit covered by a nozzle set was four corn rows wide (~3 metres). Space was left between each boom section to provide a buffer and no nozzles were placed on the centre boom section. Four water sensitive papers (yellow rectangles) were fastened to random corn plants directly on top of silks at the intersection of each range and for a total 20 x 4 = 80 papers. The chevrons indicate sprayer direction.Test plots at University of Guelph, Ridgetown Campus
Evaluating Coverage
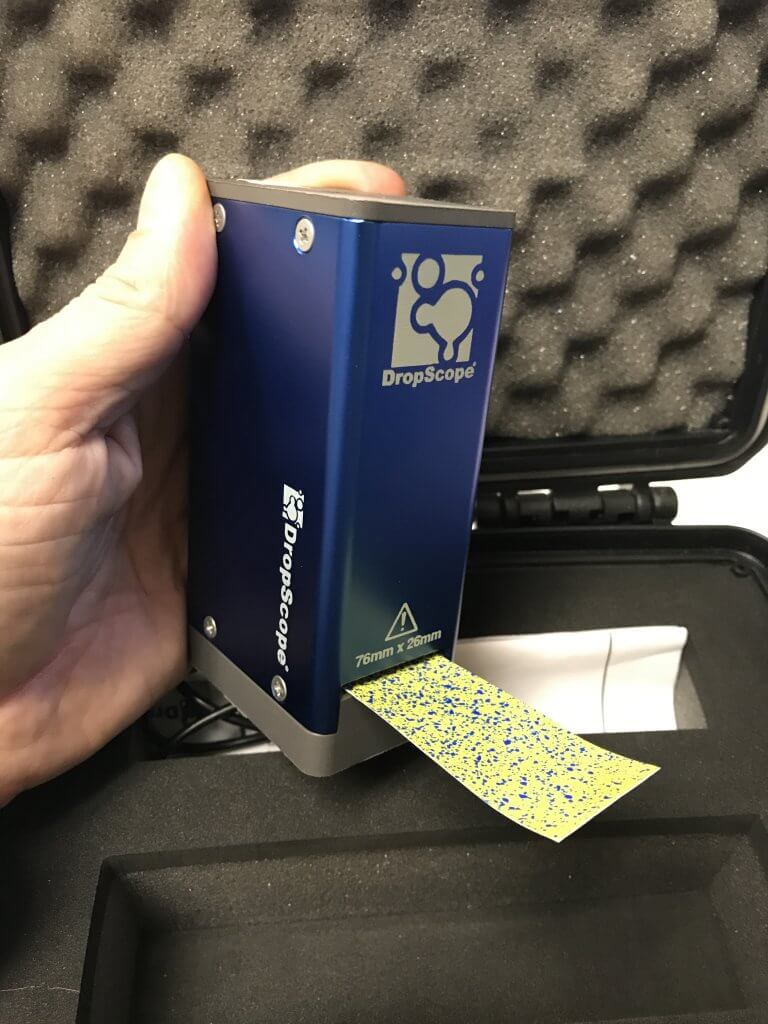
Each sprayer applied copper sulphate (Plant Products Inc., Leamington, ON) at 2 kg/ha as a chemical tracer. Agral 90 was added to the spray solution at 0.1% (v/v) to better emulate a typical fungicide application. After spraying, each water sensitive paper was allowed to dry, collected and then digitized using a DropScope (SprayX, Sao Carlos, Brazil). Droplet density and percent surface covered were evaluated within the detection limits of the equipment. Dose (represented by deposit volume) was more relevant to this study than percent surface covered, so a spread factor was used to convert area covered to volume. Once the papers were scanned they were subjected to flame emission spectroscopy (FES) (Actlabs – Activation Laboratories Ltd., Ancaster, ON) to determine the amount of copper deposited.
DropScope digitizing water sensitive paper
Results
Deposit area and volume
Note that papers were placed singly, oriented face-up. This was a missed opportunity to explore abaxial (down-facing) coverage and may have created a small experimental error wherein deposition from copper sulphate would be accounted for on both sides, but would only resolve on one side for area and density analysis. The results from evaluating water sensitive paper suggest trends and serve as quality checks for the experiment.
The percent area covered on water sensitive papers was affected by nozzle configuration (P<0.0001). Ground rigs produced ~4.0-12.0% area coverage, while aerial produced ~0.7-1.0%. It is not appropriate to compare ground and aerial spraying using water sensitive paper. Water sensitive paper does not reliably resolve deposits under ~60 µm and therefore underestimates the deposits from aerial applications because their spray quality tends to be finer. Further, these figures have not been normalized to reflect the differences in sprayer volume (190 L/ha for ground versus 47 L/ha for aerial).
The nozzle configurations with the highest percent area covered were produced by the 360 Undercover drop pipes and the TeeJet drop hoses (~9.5-12.0%). Coverage variability increased with percent area covered, but the lower 95% confidence limit with the pipes and hoses still exceed the upper limit of all overhead broadcast nozzles.
Yield Center 360 UNDERCOVER drop pipes
When area covered was converted to volume, estimated deposit volume on water sensitive papers was also affected by nozzle configuration (P<0.0001). The estimated volume calculated from deposit area showed fewer statistical differences across nozzle configurations compared to area data. However, once converted, there was no statistically significant difference in the volume deposited by drops or most broadcast methods.
Copper deposition
FES residue analysis (i.e. evaluating the amount of copper deposited on targets expressed as mass density) complements the water sensitive paper data. There are some differences that should be noted:
All applications sprayed the same amount of tracer per planted area. As such, depositions are more fairly compared with no need for normalization.
FES can resolve copper deposits as low as 0.5 µg/sample and may be more sensitive than the WSP method, which does not reliably resolve deposits under ~60 µm.
WSP will only resolve coverage on one surface. However, when these papers are subjected to FES, deposits on both sides of the paper will be accounted for, providing a more accurate result.
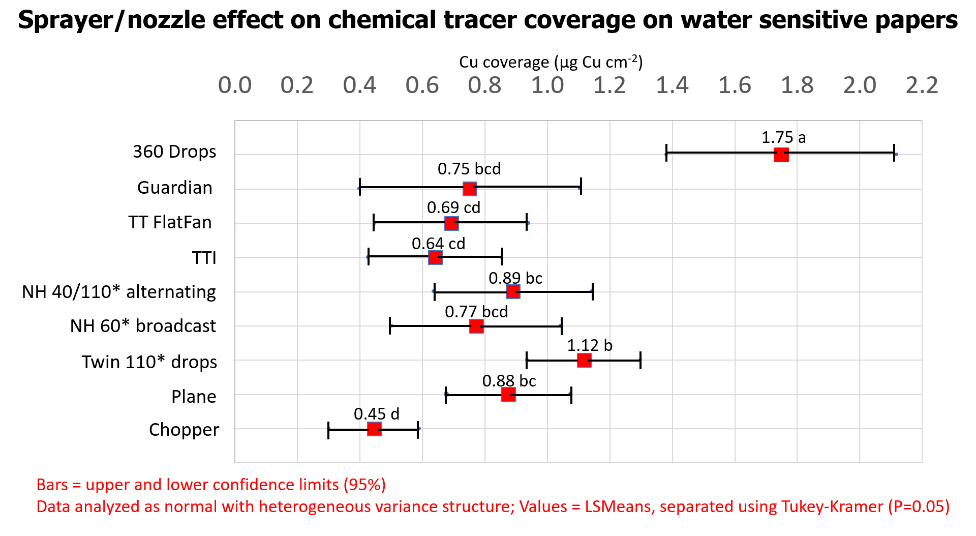
As anticipated, there was no correlation between the area coverage or volume estimates and the FES-derived copper deposition data. Estimated copper mass density on water sensitive papers was affected by nozzle configuration (P<0.0001). Analysis showed 56% more copper deposited from the 360 Undercover nozzles (1.75 µg/cm2) compared to the next highest deposition (1.12 µg/cm2) which was from the drop hose configuration (P<0.05). We feel the TeeJet drop hose configuration would have performed better still had the nozzles been directed at the silks, and the alternating broadcast nozzles been omitted and flow redistributed to the nozzles on the drops (see below).
Copper deposition from the airplane was similar to ground rigs with broadcast overhead nozzle configurations. The airplane deposited ~2x the copper as did the helicopter. It is assumed this is because the rotary atomizer nozzles on the airplane produced a much finer spray quality than the TTI nozzles on the helicopter. This increased the number of droplets considerably and has been shown to produce better coverage, particularly at such low sprayer volumes. Learn more about droplet size and behaviour here.
Average copper deposition from the Guardian Air nozzle set was similar to all other ground sprayer overhead broadcast setups, but had the highest variability (Between 0.4 and 1.12 µg/cm2). Comparatively, the lower 95% limit of the 360 Undercover drop pipe deposited 3.4x the copper as the lower limit of the Guardian Air.
Conclusions
The best deposition was produced from the Yield Center 360 Undercover drop pipes, followed closely by the TeeJet Duo nozzle body on drop hoses.
The deposition from ground sprayers with overhead broadcast nozzles was ~30% less than that of the two drop nozzle systems tested.
The deposition from Guardian Air and TTI nozzles were among the lowest of broadcast nozzle configurations with higher variability, but differences tended not to be statistically different (P=0.05) compared to other broadcast nozzles.
The deposition from the airplane was similar to the ground rig overhead broadcast applications, but the helicopter deposited the lowest amount of copper overall, likely due to droplet size (see image below).
Helicopter with air induction TeeJet Turbo TwinJet (AITTJ) nozzles directed backwards.
Next steps
In the summer of 2022 we re-evaluated promising nozzle configurations from this study, as well as other application methods (see bulleted list below).
Include various RPAAS (remote piloted aerial application systems) designs.
Include the Agrotop Beluga drop hose (Greenleaf Technologies, Louisiana, USA) with two nozzle bodies to span the silking zone of the canopy.
We used water sensitive paper as a qualitative indicator, but folded them to get adaxial and abaxial data. We also used copper deposition to indicate dose. Once the results are analyzed we’ll write a companion article to this one.
In 2021 and 2022 a separate study was performed to evaluate the efficacy, ease-of-use and return on investment of the Beluga drop hoses in corn. An article describing that work can be found here.
Thanks to the agrichemical companies, students, equipment owners and operators that donated their time and equipment to make this study possible.
Bonus
Watch these very cool slow-motion videos of the airplane and helicopter applications. Note that there is no difference in how the spray behaves once released; It deposits as a function of wind, gravity and momentum and is not “blown in” by the helicopter.
Originally published in: Wolf, T.M. and Downer, R.A. ILASS Americas, 11th Annual Conference on Liquid Atomization and Spray Systems, Sacramento, CA, May, 1998
Note to reader:It’s been nearly 23 years since we wrote this paper at the invitation of organizers of the Institute for Liquid Atomization and Spray Systems Conference. At the time, custom operators, not farmers, bought self-propelled sprayers. Air-induction tips had just been introduced. Pulse-Width Modulation was only beginning to be available. GMO crops were available but not widely adopted. Buffer Zones were more rumour than policy. How badly out of date are the thoughts we mulled over?
Abstract
The goals of an agricultural spray application are to provide effective control of the pest at low cost without adverse environmental impact. A spray must transport effectively from the atomizer to the target, be intercepted and retained by the target, and form a biologically active deposit. Improvements in efficiency are elusive because of interactions between successive stages in dose transfer. Progress will depend on atomizers providing increased control over droplet size and velocity spectra without sacrificing mechanical simplicity: (a) elimination of the interdependence of flow rate and spray quality, (b) control over size span at any given nominal diameter, (c) reversal of present relationship between droplet size and velocity. Such an atomizer would drive a new research thrust to improve spray efficiency
Introduction
Polydisperse sprays provide consistent results yet suffer from inherent inefficiencies in dose transfer. Drift potential and poor spray retention at the extreme ends of their spectra are classic examples of this inefficiency, and environmental aspects of spray application have been criticized as a result (Pimmentel and Levitan, 1986). Yet, despite ongoing research, efficiency breakthroughs remain elusive (Hislop, 1993). Due to the interdependency of the factors governing dose transfer, progress in one area (i.e., greater retention with finer sprays) has often been at the expense of spray drift, and vice versa (Young, 1986). Theoretical improvements in efficiency with monodisperse sprays (Controlled Droplet Application, CDA) have not translated into widespread adoption due to drawbacks in consistency and robustness of the results. After 50 years of research, the same compromises which have been discussed since the early days of spray application are apparently still unresolved.
Nozzle designs have certainly improved – wider pressure ranges, improved spray patterns, more options for achieving various spray qualities, better quality, longer wearing materials, and lower costs are all important for the end-user. But the basic atomizer – the hydraulic flat fan nozzle generating a polydisperse spray – has hardly changed over the years.
A New Start?
The questions posed in this paper are: If a biologist could design the ideal spray, what would it be? What are the criteria for achieving the best result in the most efficient manner? Such a discussion represents a unique opportunity to think about what we know about sprays and their biological impact, providing atomizer design information to meet our future needs.
Unfortunately, biologists still know relatively little about the impact of kind of spray quality on efficacy. General statements can be made relating spray quality to herbicide, insecticide, or fungicide effectiveness, but for the most part, the ideal spray or subsequent deposit has still not been defined for most situations (Hislop, 1987). The situation reflects the lack of choice in spray atomization, creating a catch-22: not being able to easily produce customized sprays has made it difficult for biologists to identify (without confounding factors) the ideal spray for any particular situation. Further, the need by the industry for a simple, reliable, and standard application system has inherently hindered efforts to optimize the system. All stakeholders will need to be flexible to present a fertile environment for improvements to take hold.
“Integrated Spray Management”
In this era of integrated pest management, cropping systems are optimized to provide the most effective pest management strategy on a case-by-case basis with minimal crop protection agent (CPA) use. This underlying philosophy can be extended to spray application. When CPAs are used in such systems, they, too, must rely on diverse strategies to make them more efficient. Within this philosophy, a single standard application technique for all pests will not be acceptable. Two developments are needed to put such a development into action: (a) an application system capable of delivering a wide variety of spray qualities (droplet sizes, spans, velocities) at a range of carrier volumes; and (b) the knowledge to utilize specific spray qualities under identifiable conditions.
Application Objectives
During the development of such a new application philosophy, the objectives for spray application must remain clear. They are to deliver a CPA in its most effective form to the pest, with no off-target effects, at the lowest possible cost, i.e., effective, economical, and environmental.
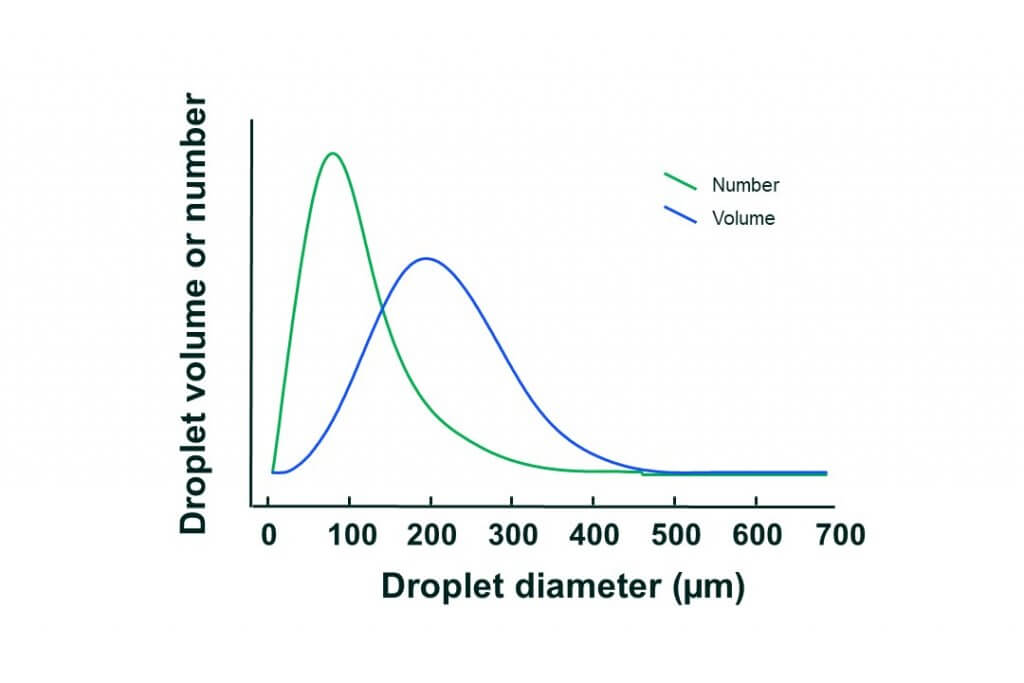
Figure 1: Typical droplet number and volume spectra for an agricultural hydraulic flat fan nozzle
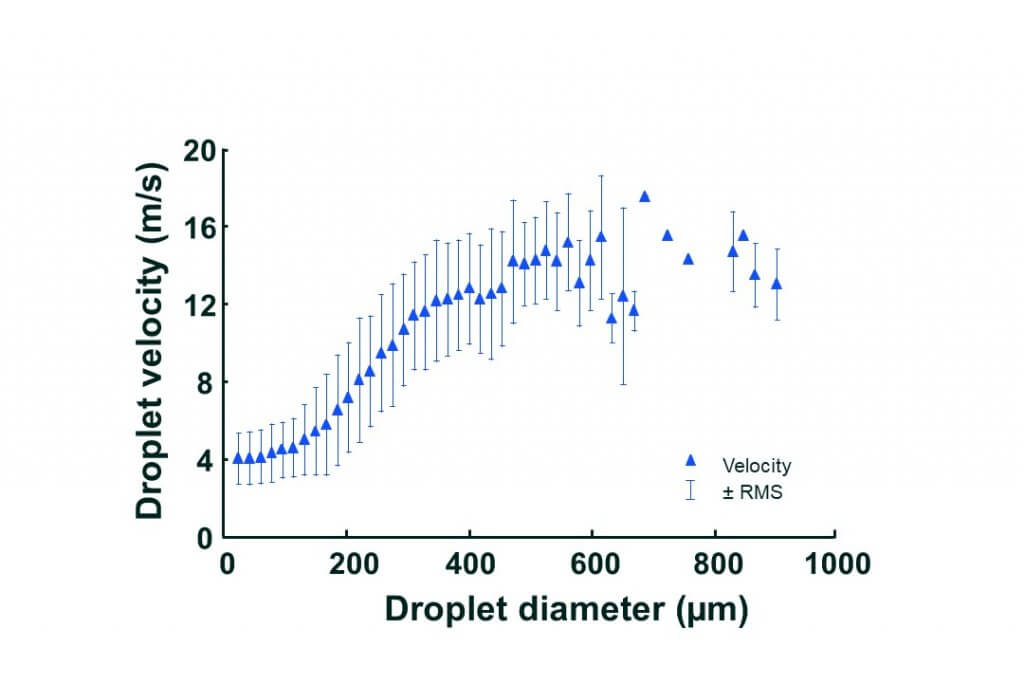
The status quo for most post-emergent CPA applications is the hydraulic flat fan nozzle. As we know, such a nozzle produces a heterogeneous mix of fine and coarse droplets (Figure 1) with a droplet speed and size relationship (Figure 2). This nozzle has frequently been criticized for inefficiency because only a small portion of spray is optimally targeted (Adams et al., 1990). At the same time, it has been applauded for consistency because a portion of its size and velocity spectrum (although not necessarily the same one) is usually appropriate for the pest complex at hand.
Figure 2: Typical velocity spectrum for an agricultural hydraulic flat fan nozzle.
The most frequently documented drawbacks of the hydraulic nozzle are driftability of fine, and poor retention of coarse components. An additional drawback is interdependence of flow rate and droplet size for any given nozzle, i.e., at the same work rate, lower carrier volumes are applied with finer sprays. Research into droplet size effects has been difficult because no variable can be held constant while another changes. Keeping dose constant, studies of carrier volume have to accept a simultaneous change in travel speed or droplet size, droplet size studies have to contend with changes in droplet density, and droplet density studies must alter active ingredient concentration. Given the complexity of the problem, few researchers commit themselves to solving these dilemmas.
Maximizing Effectiveness – No Easy Answers
For any given spray mixture, an atomizer controls spray pattern, droplet size, and droplet velocity. Spray patterns determine spatial uniformity. Droplet size and velocity in turn affect spray fate by controlling canopy penetration spray interception, spray retention, spray coverage, evaporation rate, etc. Considering the variety of active ingredients, formulations, concentrations, environments, pests, and plant canopies present, it is not surprising that the scientific body of evidence is often contradictory (Knoche, 1994). It should also come as no surprise that there is no single “best” droplet size to optimize these factors.
Basic principles: In order to better understand why a single ideal spray cannot exist, a brief review of the principles of spray drift, interception, and retention are appropriate. Larger droplets are driven mostly by inertial and gravitational forces (Spillman, 1984). As such, they tend to have vertical trajectories from which they cannot easily be displaced. This makes them a good choice for drift reduction, and also for canopy penetration into vertically oriented canopies, such as cereal grains. Collection efficiency by a target is a function of target size and orientation – horizontally oriented, larger objects will be favoured by larger droplets. Spray retention is a function of leaf surface wettability and microstructure, as more difficult to wet species will be more likely to reflect larger droplets (Hartley and Brunskill, 1958).
Small droplets, on the other hand, are more subject to viscous drag, have shorter stop distances, and can therefore move with local air turbulence to reach shadow regions (Nordbo, 1992). Thus the finer sprays have a propensity for displacement from their flight path by air turbulence, but they also are better able to penetrate dense broadleaf canopies because they can move around larger objects. Small, vertically oriented objects such as stems and petioles have the best collection efficiency for small droplets.
Upon depositing successfully on a target, the deposit must be in a form which exerts the desired biological effect. Given the same spread factor, deposits with greater volumes remain wet longer, providing more opportunities for uptake into the leaf. Small droplets provide more efficient coverage per unit volume, but dry rapidly, which may limit their uptake.
Uptake and translocation of active ingredients by biological targets are physical processes driven by concentration gradients. Concentrations of active ingredients and surfactants per unit leaf area are a function of carrier volume, droplet size, and spread factor. Less than optimum concentrations can result in reduced uptake and translocation (Wolf et al., 1992).
Further complications arise due to the heterogeneous nature of weeds. Individual regions of weed plants have unique anatomical and physiological features that can affect retention, uptake, and translocation processes on a spatial level. For example, Merritt (1982) showed that for wild oats (Avena fatua), younger leaves and the basal region of leaves absorbed more difenzoquat than older leaves.
All these factors conspire to complicate the quest for optimization in a field setting.
The Ideal Spray
Based on the previous discussion, it may be obvious that a single droplet size cannot meet all demands within such a complex system. Therefore our focus must shift from a theoretical optimum solution, as was the basis for controlled droplet applicators (Bals, 1980) to one which emphasizes flexibility.
One advantage of speaking on behalf of biologists is that one can feign complete ignorance about atomization, and propose seemingly ludicrous ideas. Perhaps a prerequisite to a fresh approach is such ignorance.
Biologists need a spray to not only implement optimum application, but as a means with which to learn how to optimize the process in the first place. Further, since there is no single optimum spray quality to meet all application scenarios, the most important feature in a spray is flexibility. The following features will be important:
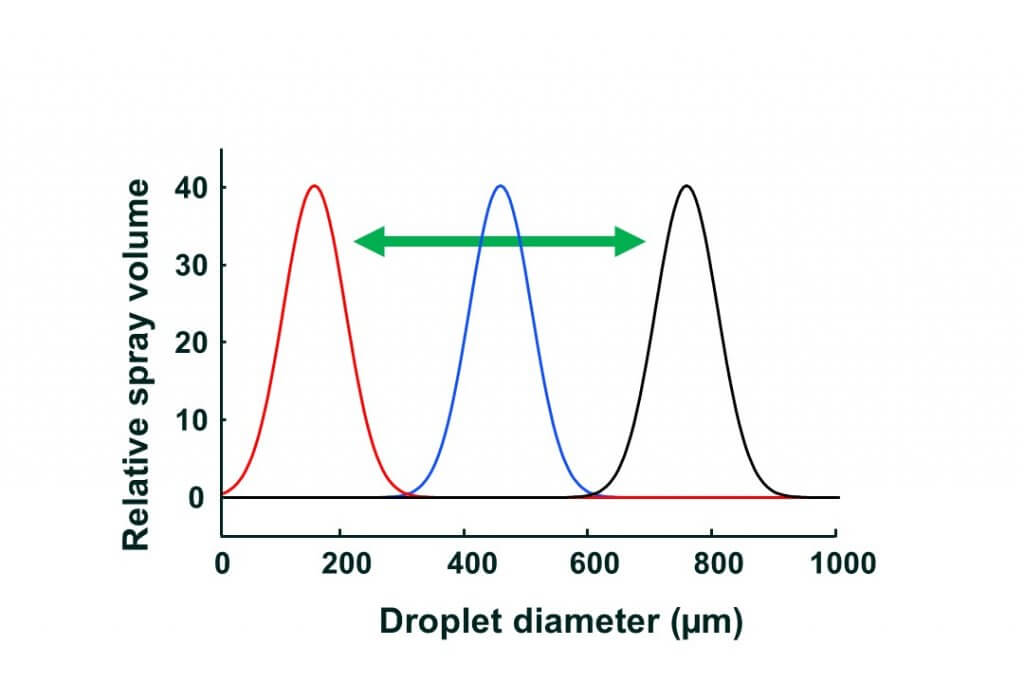
Spray quality independence: The first criteria is the ability to adjust spray quality easily, without affecting carrier volume or droplet velocity, and vice versa (Figure 3). A shift towards a coarser or finer spray can then be achieved without introducing other confounding effects. Some progress has already been made in this area (Giles and Comino, 1990).
Figure 3: Shift in droplet size spectra from medium to fine or coarse qualities, achievable without a change in carrier volume.
Relative span factor flexibility: The relative span factor of the spray should be adjustable (Figure 4). It will be important to narrow the broad spectrum sprays produced by flat fan nozzles to determine the importance of specific droplet sizes. While such research was conducted during the 1970s and 1980s with controlled droplet applicators (CDAs), the unique droplet velocity associated with such atomizers would question results if they were to be applied using hydraulic atomizers.
Figure 4: Narrowing the span of the droplet size spectra, while preserving its polydisperse nature, will be useful to strike a balance between specific droplet sizes and spray heterogeneity.
Velocity control: The third criteria is for improved droplet velocity control. The droplet velocity dependency on size has meant that in the absence of air assist, smaller droplets are always moving slower. This factor has reduced the efficiency of their collection and made them more drift prone. Additionally, the larger droplets, being faster moving, were more likely to rebound from targets. Acceleration of small droplets is a strategy for reducing spray drift and enhancing collection efficiency, but greater velocity for larger droplets may reduce the efficiency of their retention by the target. If the droplet size – velocity relationship were reversed, then smaller droplets would be less drift prone and larger droplets would be less likely to rebound (Figure 5).
Figure 5: Droplet velocity spectrum for a typical agricultural hydraulic spray, accelerated with air assist to reduce drift potential of smaller droplets, and with smaller droplets travelling faster than larger droplets to maximize transfer efficiency.
Spray heterogeneity: Spray heterogeneity will remain important in an optimized system, especially in the absence of specific knowledge on droplet function by size class. In this sense, a polydisperse spray does more than provide insurance for changing conditions, it adds diversity to static conditions which strengthens the overall effect. While a quantitative dose-based approach to CPA delivery is often appropriate, it under-emphasizes the role of deposit structure and spray redistribution, where quality is more important than quantity (Wolf, 1996). For example, let us assume that canopy penetration is maximized with a spray of 400 µm VMD, with a relative span factor of 0.7. In such a spray, fine droplets contribute relatively little to overall dose. However, their ability to redistribute in the canopy, targeting areas left untouched by the larger droplets may be more important than their total dose contribution would suggest. In this way, they provide benefits which are total dose independent. A heterogeneous spray would ensure that these benefits remain.
Deposit uniformity: Efforts at optimizing dose transfer are compromised if spatial dose uniformity cannot be maintained within the treated area. High deposit variability has been associated with reduced control of insects (Uk and Courshee, 1982; Cooke et al., 1986). As such, uniformity remains a fundamental requirement for spray application and should not be compromised with new atomizer designs.
Environment as a Priority
Spray must land on the intended target, be it a plant, insect or ground, and in some cases on the optimal pest part, i.e., specific leaves, leaf sides, stems, etc. Off-target placement not only represents inefficiency, but also undesired environmental input. With any application system, an important criteria is the ability to manage off-target impacts.
Past solutions to spray drift or droplet rebound has been two-fold: (a) eliminate those droplets which do not impact on the target efficiently, or (b) protect them from displacement. For spray drift, the elimination of small drops through production of coarse sprays has been successful (Edwards and Ripper, 1953). The challenge is to provide drift protection without compromising the advances made in the previous exercise of maximizing effectiveness. The protection of fines with barrier (shrouds) is an effective strategy for reducing drift, and provides the advantage of maintaining a spray quality established to meet separate criteria (Wolf et al., 1993). Another successful strategy has been to assist transport of fines with an external energy source (air or electrostatics). This also allows the preservation of an optimized spray quality, with the added advantage of modifying the droplet velocity spectrum in favour of canopy penetration.
Nozzle design may offer some opportunities for the reduction of rebound. Novel atomization systems such as venturi or twin-fluid nozzles, which offer air-inclusion in droplets, may reduce rebound of larger droplets. If larger droplets are required, but retention is of concern, such approaches may be useful. Spray adjuvants can also play important roles in this area (Downer et al., 1995)
Economical Considerations
Underlying any attempt to provide effective pest management is an economical consideration. The producer must see a benefit in making a technical investment. Any atomizer solution must therefore not only meet the technical requirements for optimizing dose transfer, it must also be a cost-effective and practical system. A system which is complicated to use is not likely to be widely adopted. Without strategies for implementation by the end user, innovations in delivery are merely theoretical exercises.
Putting it into Practice
During a typical work day, an applicator may be called to treat crops for a range of pests with broad-spectrum products. These pests will likely be present in a range of densities, some above and others below an economic threshold. There may also be a range of canopies present, some broadleaves, others grasses, some dense, others sparse. Depending on the area, there may have been a range of environments under which pests became established, or during which application is made. Each field will also have a range of bordering ecosystems with unique trespass sensitivities.
There will obviously be a limit to the degree of customization that is possible. But some efforts will be rewarded. The applicator uses GPS technology to collect or recall relevant data – sensitive areas, high and low infestation levels, or changes in canopy structure. With the new atomizer, the applicator can emit the most effective droplet size, velocity, span, and dose appropriate for the pest or canopy on a site-specific basis. The use of spray quality classification systems such as those developed by the BCPC and ASAE will guide optimization efforts, but in the end, these classification systems will be too broad to fine-tune the system. A higher resolution, multi-parameter scheme which is sensitive enough to represent the criteria laid out in this paper will be necessary.
Possible difficulties emerge when the system resists optimization. For example, it would be comparatively easy for the applicator to control a broadleaf weed in a grassy canopy, as the size spectrum which optimizes grass canopy penetration is also likely to target the broadleaf weed effectively. If a tank mix is used to control both grassy and broadleaf weeds in this canopy, the applicator now needs a more heterogeneous spray, where a finer component targets the grassy weed, and the coarser component still effectively transfers dose to the broadleaf weed. As the situation increases in complexity, the simultaneous optimization of several criteria will be increasingly difficult.
Conclusions
Only an integrated approach involving all stakeholders (engineers, chemists, biologists, etc.) can result in improved application of CPAs. Individual goals and concerns must be communicated and reconciled in new design efforts. This paper represents a wish list from biologists’ perspectives. While greater flexibility and control are important objectives in our opinion, consideration must also be given to mechanical complexity and cost, possible interactions with formulations exhibiting a range of physico-chemical properties, biocontrol agents, and practical strategies for adoption. A continued willingness to establish and maintain lines of communication and cooperation between these disciplines will be pivotal to success.
Acknowledgments
The invitation by the ILASS Program Organizing Committee to make this presentation is gratefully acknowledged.
Citations
Adams, A.J., Chapple, A. C., and Hall, F.R.. 1990. Agricultural sprays: lessons and implications of drop size spectra and biological effects. In: L.E. Bode, J.L. Hazen, and D.G. Chasin (eds.) Pesticide Formulations and Application Systems, ASTM STP 1078. American Society for Testing and Materials, pp. 156-169
Bals, E. J. 1978. The reasons for C.D.A. (Controlled Drop Application). Proceedings of the 1978 British Crop Protection Conference – Weeds, pp 659-666.
Downer, R.A., Wolf, T.M., Chapple, A.C., Hall, F.R., and Hazen, J.L. 1995. Characterizing the impact of drift management adjuvants on the dose transfer process. In: R.E. Gaskin (ed.) Fourth International Symposium on Adjuvants for Agrochemicals. New Zealand Forest Research Institute, Rotorua, NZ, pp. 138-143.
Edwards, C.J. and Ripper, W.E. 1953. Droplet size, rates of application and the avoidance of spray drift. Proceedings of the 1953 British Weed Control Conference, pp. 348-371.
Giles, D.K., and Comino, J.A. 1990. Droplet size and spray pattern characteristics of an electronic flow controller for spray nozzles. J. Agric. Engng. Res. 47:249-267.
Hartley, G.S. and Brunskill, R.T. 1958. Reflection of water drops from surfaces. In: J. F. Danielli, K. G. A. Parkhurst, and A. C. Giddiford, eds., Surface Phenomena in Chemistry and Biology, Pergannon Press, London, pp. 214-223.
Hislop, E.C. 1993. Application technology for crop protection: an introduction. Pages 3-12 In: G.A. Matthews and E. C. Hislop (eds.) Application Technology for Crop Protection. CAB International, Wallingford, UK.
Hislop, E. C. 1987. Can we define and achieve optimum pesticide deposits? Aspects Appl. Biol. 14:153-172.
Knoche, M. 1994. Effect of droplet size and carrier volume on performance of foliage-applied herbicides. Crop Prot. 13:163-178.
Merritt, C.R. 1982. The influence of form of deposit on the phytotoxicity of difenzoquat applied as individual drops to Avena fatua. Ann. Appl. Biol. 101:517-525.
Nordbo, E. 1992. Effects of nozzle size, travel speed and air assistance on deposition on artificial vertical and horizontal targets in laboratory experiments. Crop Prot. 11:272-278.
Pimentel, D. and Levitan, L. 1986. Pesticides: Amounts applied and amounts reaching pests. BioScience 36:86-91.
Spillman, J.J. 1984. Spray impaction, retention and adhesion: an introduction to basic characteristics. Pestic. Sci. 15:97-106.
Wolf, T.M. 1996. Spray application into standing stubble – an exploration of physical and physiological components. Ph.D. Dissertation, Department of Agronomy, The Ohio State University, 192 pp.
Wolf, T.M., Grover, R., Wallace, K., Shewchuk, S.R., and Maybank, J. 1993. Effect of protective shields on drift and deposition characteristics of field sprayers. Can. J. Plant Sci. 73:1261-1273.
Wolf, T.M., Caldwell, B.C. McIntyre, G.I., and Hsiao, A.I. 1992. Effect of droplet size and herbicide concentration on absorption and translocation of 14C‑2,4‑D in oriental mustard (Sysimbrium orientale). Weed Sci. 40:568-575.
This article was originally published in the Proceedings of the Soils and Crops Workshop, 2005.
Authors
Tom Wolf (AAFC), Brian Caldwell (AAFC), Cheryl Cho (CDC), Sabine Banniza (CDC), Yantai Gan (AAFC)
Background:
Fungicide application is an important disease management strategy for ascochyta blight (caused by Ascochyta rabiei) in chickpea due to the poor host resistance in available cultivars. Ascochyta blight, left untreated, can cause yield losses in excess of 90% in Saskatchewan, and appropriate timing and frequency of fungicide spray application is critical. Producers wishing to apply fungicide are sometimes unsure which application method to use – aerial or ground. Both offer potential advantages and disadvantages: ground sprayers utilize greater water volumes, but leave tracks which can lower yield and spread disease. Aircraft use lower water volumes but do not damage the crop and can cover more area in a timely fashion. The relative importance of these characteristics is unknown.
Objectives:
Objectives of this study were to compare aerial and ground fungicide application on chickpea disease and seed yield.
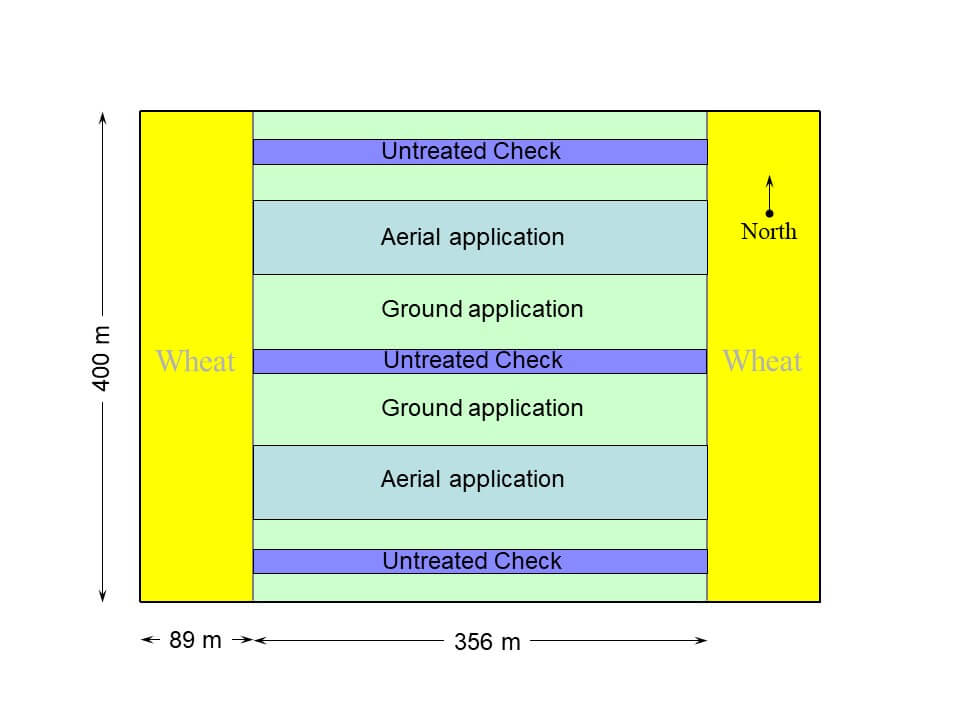
Materials and Methods:
Chickpeas (certified CDC Xena, a unifoliate kabuli rated as having very poor ascochyta resistance) were seeded on May 15 (2003) and May 27 (2004) on 35-acre sites near Saskatoon which had been chem-fallow wheat stubble (2003) and spring wheat (2004) the previous year. Seed was treated with Crown and Apron and seeded at 170 lbs/acre (35 seeds/m2) to a depth of 6.5 cm using a Flexi-Coil airseeder with 9” row spacing. The field was harrowed and rolled after seeding. Pursuit (70 mL/ha) and Post Ultra (0.32 L/ha) were applied for weed control in both years. The crop established evenly and weed populations (primarily prostrate pigweed and stinkweed) were low in 2003. In 2004, sow thistle was the predominant weed.
In 2003, the crop was scouted at 5-day intervals for the presence of disease. Initial disease levels through June were very low and disease did not become visible until after the first major rainfall event on July 6. Headline (pyraclostrobin) was applied on July 11 and 21 at 0.4 L/ha, followed by Lance (boscalid) on August 1 and 13-14 at 0.42 kg/ha. Aerial and ground applications were conducted at dusk with calm conditions. Both were conducted within 1 h of each other except for the last application of Lance where the ground application followed the next morning.
In 2004, the crop was slow to establish, but disease became prevalent early in its development, especially on the side of the field which bordered the 2003 trials. Headline was applied on July 12 and July 23, Lance was applied on August 2. A second application of Lance was not warranted due to cool conditions which jeopardized the maturity of the crop.
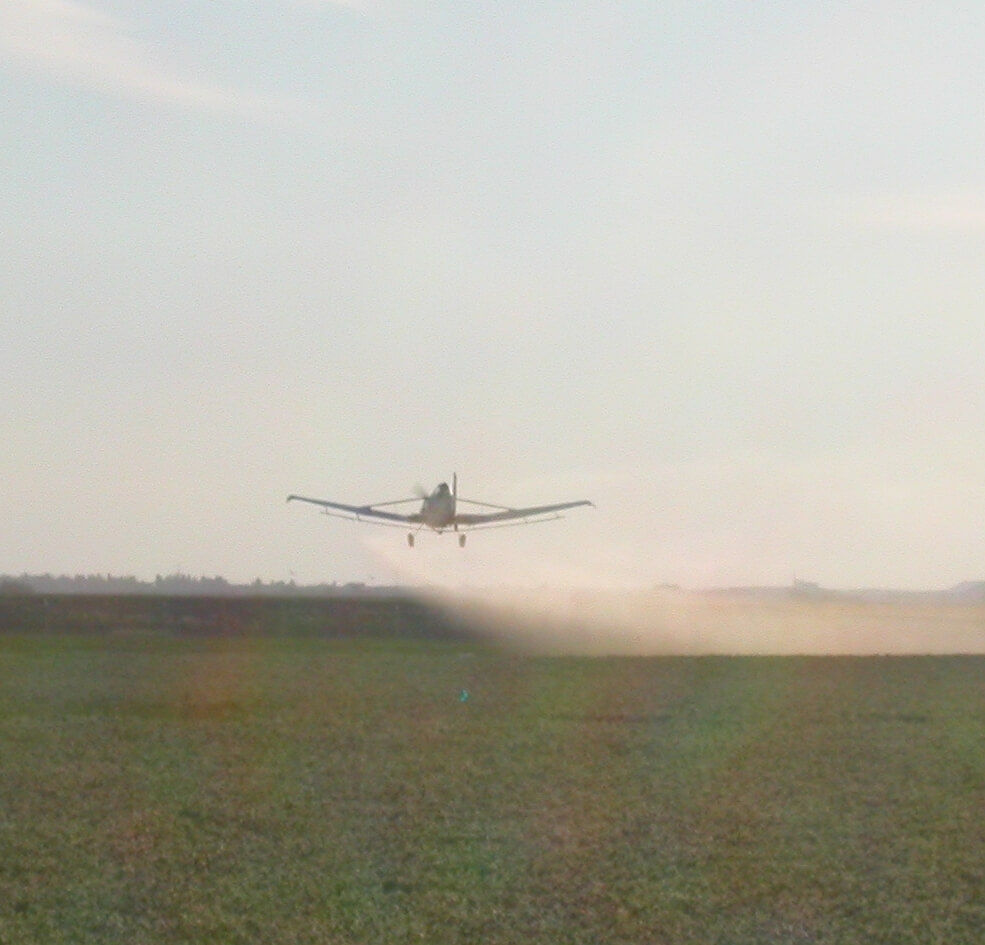
In both years, aerial applications were done by Cessna Ag Truck applying 4 US gpa (37 L/ha) through 24 CP-03 nozzles with the 0.125 flow orifice and 90º deflection, at a pressure of 34 psi and 120 mph airspeed. At these settings, the spray had a volume median diameter (VMD) of 271 µm according to USDA atomization models. Swath width was 50’ and boom height was 10 to 15’ above ground.
Aerial application of fungicide to chickpeas, 2003.
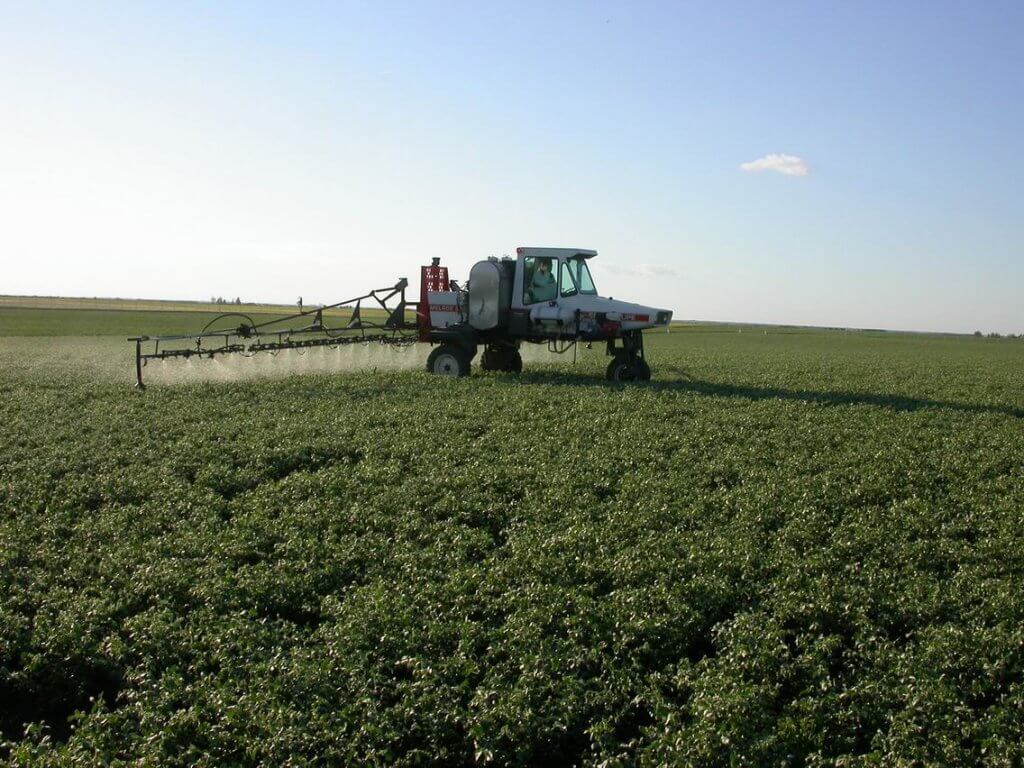
Ground applications were done using a Melroe SpraCoupe 220 travelling 8 mph with a 43’ boom, using XR8003 nozzles operated at 40 psi and a boom height of about 75 cm. At these settings, the application volume was 100 L/ha, and the spray had a VMD of 246 µm.
Ground application of fungicide to chickpeas, 2003.
Disease ratings were conducted on approximately the same dates as spraying. Disease ratings were conducting using the 0-11 Horsfall-Barratt scale, converted to % infection. Single plants were rated at 64 (2003) and 60 (2004) locations in each treatment within each rep, for a total number of 128 or 120 plants rated per treatment per rating date (except for the first rating, where only 24 plants per treatment were rated). Ratings from the outside two passes of the aircraft in each replicate were deleted since proper spray patterns were not expected at these edges.
In 2003, the crop matured in mid-August and Reglone was applied by ground sprayer travelling perpendicular to the treatments, on August 22. In 2004, the crop failed to mature and was sprayed with Roundup on September 20.
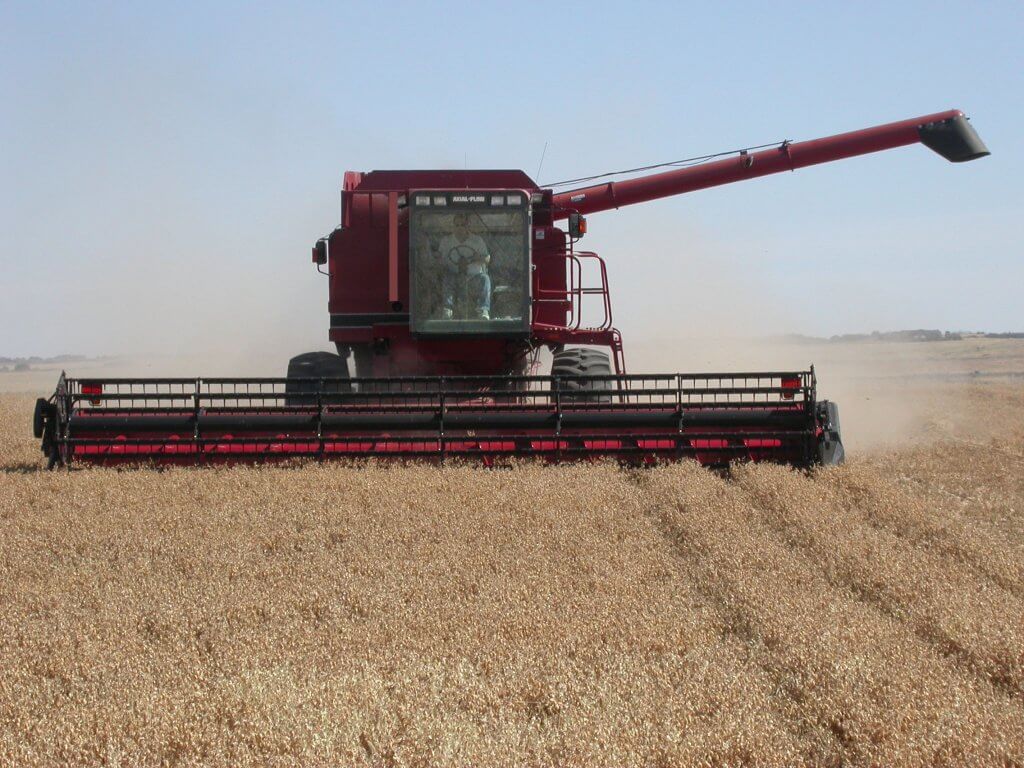
The 2003 crop was harvested on September 3 using a Case 1688 combine with a 30’ flex header. After removal of headlands, two 275 m long swaths were taken from each treatment, and the seed from each swath was weighed and sub-sampled for seed quality. In the aerial plots, the central two spray swaths of each rep were sampled. In the ground plots, two swaths were taken with wheel tracks, and two without wheel tracks in each rep. Wheel tracks were then adjusted to a 90’ boom width for yield calculations.
In 2004, harvest was impractical with the large combine due to the low seed yield and quality which prevented accurate yield measurements. On November 10, a Hege combine was used to harvest a single pass along the length of each sprayer swath for all treatments. The grain was bagged, dried , and weighed.
All data were analyzed using analysis of variance (ANOVA) as a randomized complete block design with two replicates. Treatment effects were considered significant at p=0.05.
Results and Discussion:
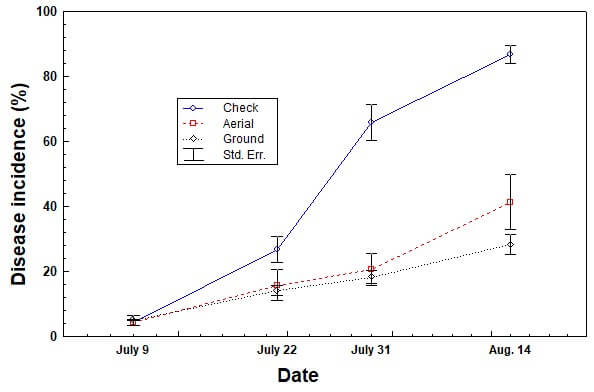
Ascochyta was prevalent in both 2003 and 2004. In 2003, disease severity in the untreated chickpea progressed from about 5% to about 66% from July 9 to July 31. Disease severity in sprayed plots was significantly less, about 18 and 21% for the ground and aerial treatments, respectively on July 31. A late flush of disease on new growth increased levels to 87% in the untreated plots, and 28 to 41% in the ground and aerial plots, respectively, on August 14.
Ascochyta blight severity on chickpeas throughout growing season, 2003
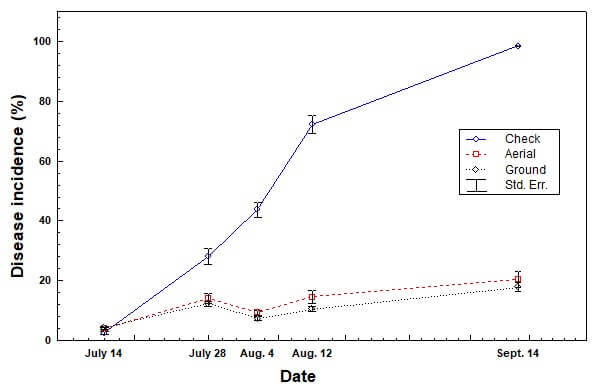
In 2004, disease in the untreated plots steadily increased from 3% infection on July 14 to 99% on Sept 14. During this time, the treated aerial and ground plots increased from 4 to 18-20%, similar for both application methods.
Ascochyta blight severity on chickpeas throughout growing season, 2004
Application methods generated visually different spray deposits on water sensitive cards. The ground application had greater overall coverage of the cards primarily due to the greater water volume used (100 L/ha vs. 37 L/ha) Cards indicated that overall uniformity of the spray deposit along the width of the boom was greater for the ground sprayer (data not shown). However, water sensitive cards provide an artificial collection surface that does not accurately simulate the complexity of a leaf surface or a multi-dimensional plant canopy. These cards therefore do not provide an assessment of leaf coverage, but are limited to a visual indication of the type of spray quality emitted by the application.
Spray deposit on water-sensitive paper for ground application at 100 L/haSpray deposit on water-sensitive paper for aerial application at 37 L/ha
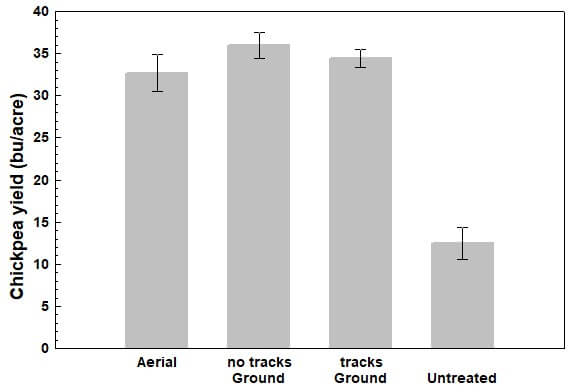
Fungicide application significantly increased seed yield in both years. In 2003, yield averaged 13 bu/acre for the unsprayed treatments, and 33 bu/acre where fungicide had been applied. Aerial treatments yielded 32.7 bu/acre, whereas ground treatments (track damage adjusted for 90’ boom width) yielded 34.4 bu/acre. This difference was not statistically significant (Table 1). Ground-sprayed areas without wheel tracks yielded 36.0 bu/acre, therefore yield loss due to tracks was 1.6 bu/acre.
Chickpea seed yield in plots treated with fungicide applied by air and ground, 2003.
Table 1: Analysis of Variance (ANOVA) for chickpea seed yield from aerial and ground applications (ground with tracks adjusted for 90′ boom), 2003
Effect
df Effect
MS Effect
df Error
MS Error
F-value
p-level
Trt
1
5.89
1
1.41
4.18
0.290
Rep
1
12.10
1
1.41
8.58
0.209
Sprayer tracks reduced yield due to crop destruction, but they did not appear to spread disease within the crop. It is possible that application during evening hours before dew wetted the foliage helped prevent disease spread. The role of sprayer tracks requires further investigation.
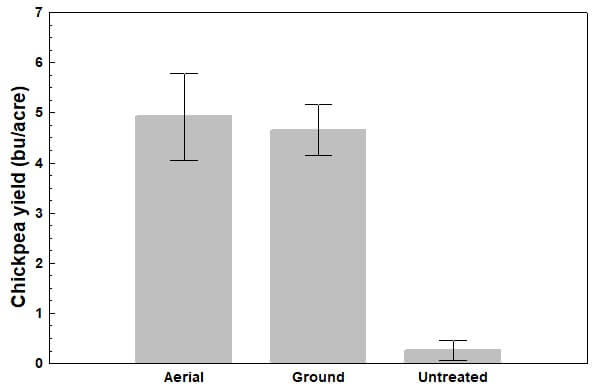
Seed yield and quality were very poor in 2004 due to cool growing conditions and an early frost. In spite of this, results mirrored those from 2003: fungicide significantly increased yield, from 0.3 bu/acre in the untreated plots to 4.7 and 4.9 bu/acre in the ground and aerial treatments, respectively. Yield differences arising from application method were not statistically significant.
Chickpea seed yield in plots treated with fungicide applied by air and ground, 2004
Seed quality analysis demonstrated no difference in chickpea grade of either ground or aerially applied fungicide. Aschochyta rabiei was not detected on seed from any treatment.
These results showed that both ground and aerial application of fungicide provided effective control of Ascochyta rabiei on chickpeas. Results from 2004 were compromised by a poor growing season, therefore further work may be necessary to confirm this outcome. Nonetheless, the consitency of conclusions support recommending both methods to producers wishing to apply fungicide.
Acknowledgements:
We thank Roland Jenson (Cloud 9 Airspray) for conducting the aerial applications, Mark Kuchuran and Dan Caldwell (BASF) for providing fungicide, herbicide, and overall support, Jim Kelley (Redhead Equipment) for providing harvesting equipment, Al Baraniuk (AAFC) for assisting with seeding and harvesting operations, and Curtis Sieben and Chris Gilchrist for implementing this trial. Financial assistance was provided by the Saskatchewan Pulse Growers (2003) and AAFC through the IFSP Initiative (2004).
There’s a call that I’ve been getting for 20 years now. It came again this week. Someone has a twincap with two small air-induced tips, and they’re applying herbicides and fungicides with low water volumes, often 5 gpa, sometimes less. They call because they want to know how much wind they can spray in. Is 30 km/h OK? They want my blessing.
I don’t need to hear much more. Some nozzles are sold entirely on the premise that they provide superior coverage – more droplets per square inch – and that this improved coverage permits the reduction of water volumes. Furthermore, the claim goes, when water is reduced, the spray concentration increases and the whole darn package just works a lot faster and better.
This line of thinking is as old as spraying itself. Applicators seek pesticide performance as well as productivity, and this approach gives them both. The proponents are well aware of their customers’ desires, and sell into it. “Use these tips and cut back on water. Any more than this just runs off anyways. You’ll get better coverage and better performance, get more spraying done.” It’s a convincing argument. Get an edge on your neighbour, the person who’s not in on the secret and is wasting time and water.
Why don’t I embrace it? There are a few reasons.
First, it doesn’t tell the whole story. Invariably it involves a twin nozzle setup. Use two nozzles, get more droplets, right? If that were true, believe me, I’d be advocating for quintuples.
Fact is that the only factors that change droplet numbers are droplet size (spray quality) and water volume. Want more droplets at the same water volume? Make the spray finer. Want to keep spray quality and add droplets? Add water (not nozzles).
The easiest way to improve coverage at the same volume is to use a finer nozzle, or to increase spray pressure. Depending on how far you go, you could make the spray finer and cut water, and still have more droplets per square inch.
The hardest way to improve coverage is to purchase a twincap and buy two nozzles, each of them half the size. True, within any given nozzle type, smaller sized tips usually generate finer sprays. But why bother with two tips? They’re more expensive and plug more.
If someone asks me how to improve coverage without changing water volume, I usually tell them to speed up a few mph. The rate controller will increase pressure and the spray gets finer. If speeding up is not possible, get one size smaller nozzle and run at higher pressure, same speed. Or keep nozzle and speed, and add some gpa, pressure will go up. It’s that easy. No twins necessary.
Second, the twin nozzle/low volume approach exaggerates the value of the twin nozzle for herbicides. With small plants and relatively open canopies in the early season, plus our high booms and travel speeds, the twin tips are not adding a lot, if anything at all, to coverage. It remains a sum of droplet size and water volume, the angle is not important at this stage. Deposit is by turbulence and wind, most of the time.
Third, low volume believers ignore a few potential problems. Drift is a big one. Low volume, fine spray operators are surrounded by nervous neighbours. They have fewer hours per day during which drift is acceptably low. And they definitely should not be on the field when wind is at 30 km/h. Basically, they’re a bit uncomfortable (at least they should be) and get less done per day.
Another potential problem is evaporation. Most sprays, even when applied at lower volumes, are still 90% or more water. The same volume of water evaporates much quicker when atomized into smaller droplets. This has two main downsides: On their way to the canopy, small droplets evaporate and become even more drift prone, and may not impact at all. Those that impact evaporate shortly thereafter. Research has shown that pesticide uptake is better from wet than dry deposits.
When Delta T (dry bulb minus wet bulb temperature) is high, evaporation can be so strong that it reduces pesticide performance or causes solvent burn. Fine sprays make it worse.
I also hear about the use of oily adjuvants to control evaporation from small droplets. This could be even more dangerous. Small droplets drift, and evaporation to dryness is actually helpful in reducing the impact of that drift. How? It makes the small droplets disappear, with their remnants dispersing into the turbulent atmosphere. With oily adjuvants, the small droplets stick around and stay potent and their drift damage is much worse.
Lastly, the practice is possibly off label. Water volume and spray quality label statements are designed to offer good performance and acceptable drift risk. While that part of the label is often a bit dated, it does provide better support from the manufacturer should something go wrong.
If you’re spraying under hot, dry and windy conditions, the low volume, fine spray approach is irresponsible. Use sufficient water (7 to 12 gpa) to allow low-drift sprays, at least Coarse to Very Coarse, in some case, even coarser.
Agronomists provide the best possible information for their clients, based on scientific evidence and experience and in accordance with their professional code of ethics. Sometimes the news we deliver aren’t what the customer wants to hear. But we have to represent the interests of all of us, collectively. I find that pretty important.