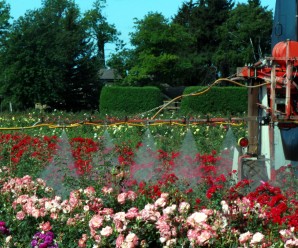
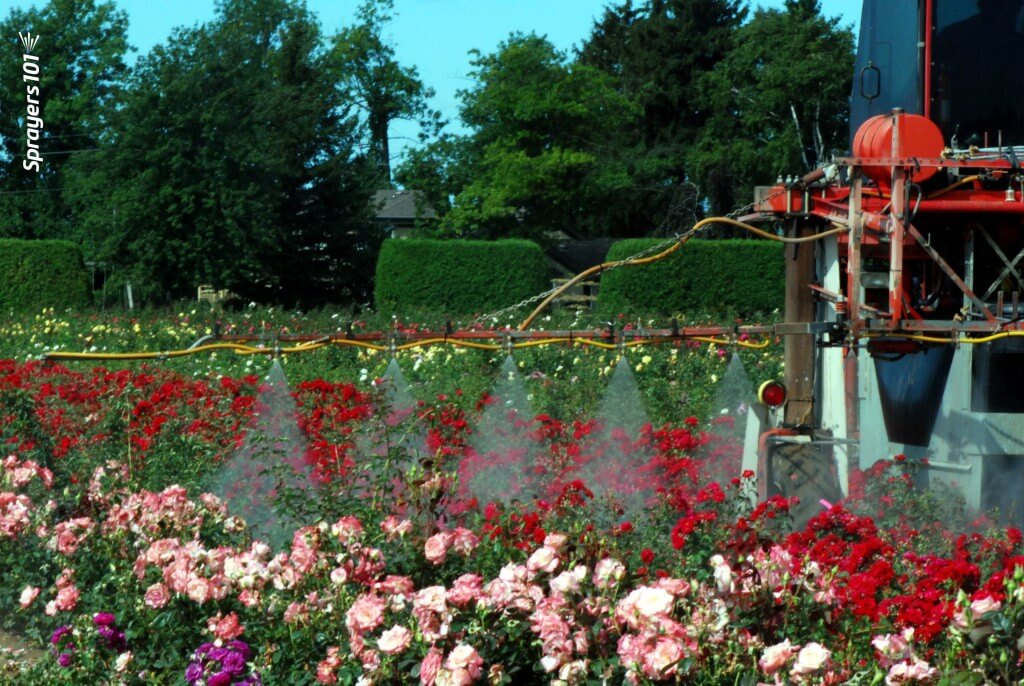
We always admire the photos of sprayers in tulips produced by the Netherlands. Rose protection in Ontario is equally beautiful.
Nursery growers apply pesticides to a diverse range of plant species. In a perfect world, sprayer operators would adjust their sprayer set-up to match each crop, but this is rarely done because of time constraints and a lack of guidance. Adjustments in product rate and spray distribution should reflect the plant size, row spacing and developmental stage of the crop and pest. Any such adjustments should be performed using a reference point for coverage and a strong history of efficacy.
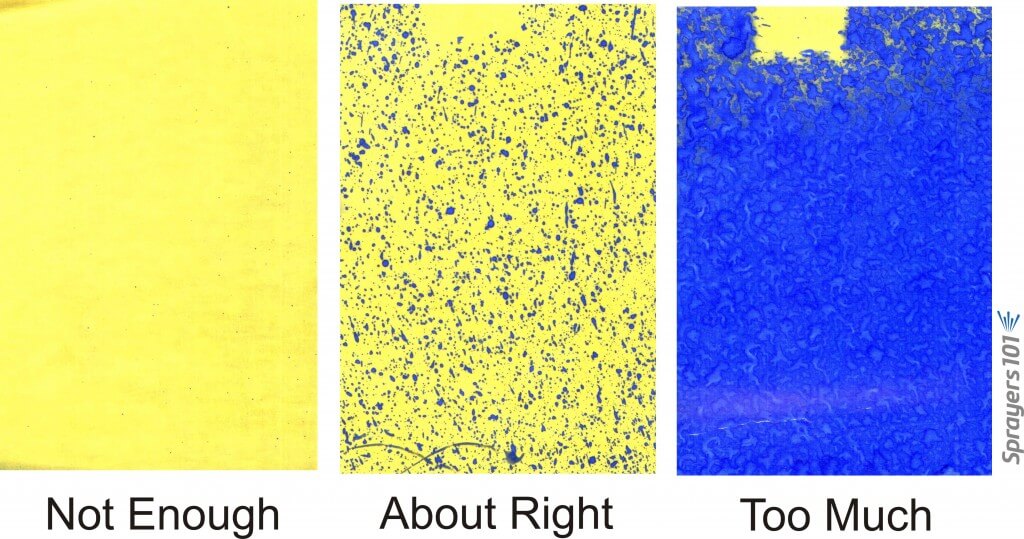
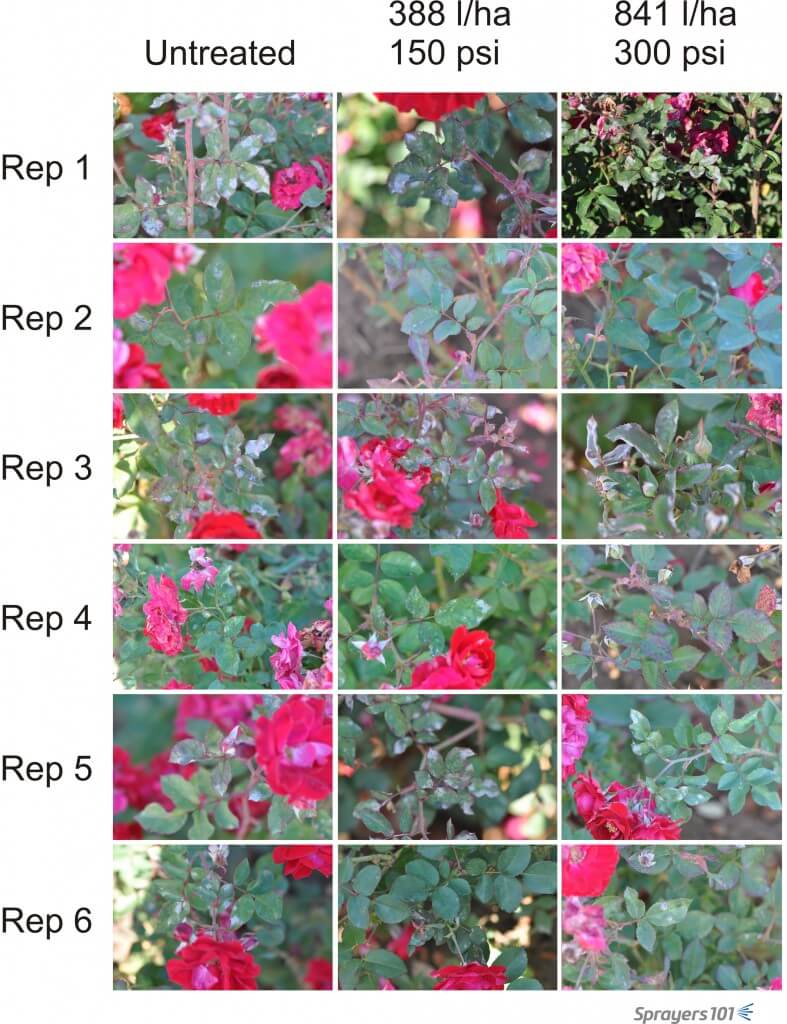
To demonstrate the value of sprayer optimization, we marked out three, 65m x 6.5m blocks in a field of roses. One block was an untreated control. One block was the grower’s traditional set up of hollow cones (D4D45) on 50 cm centres at 300 psi and 3.0 mph (841 L/ha). The third block was the experimental condition where we used an optimized set up of hollow cones (D3D45) on 50 cm centres at 150 psi and 3.0 mph (388 L/ha). We validated this condition using an iterative process to dial in the coverage indicated by water-sensitive paper.
Setting up water-sensitive papers in the rose blocks.Rule-of-thumb fungicide coverage on water-sensitive paper.
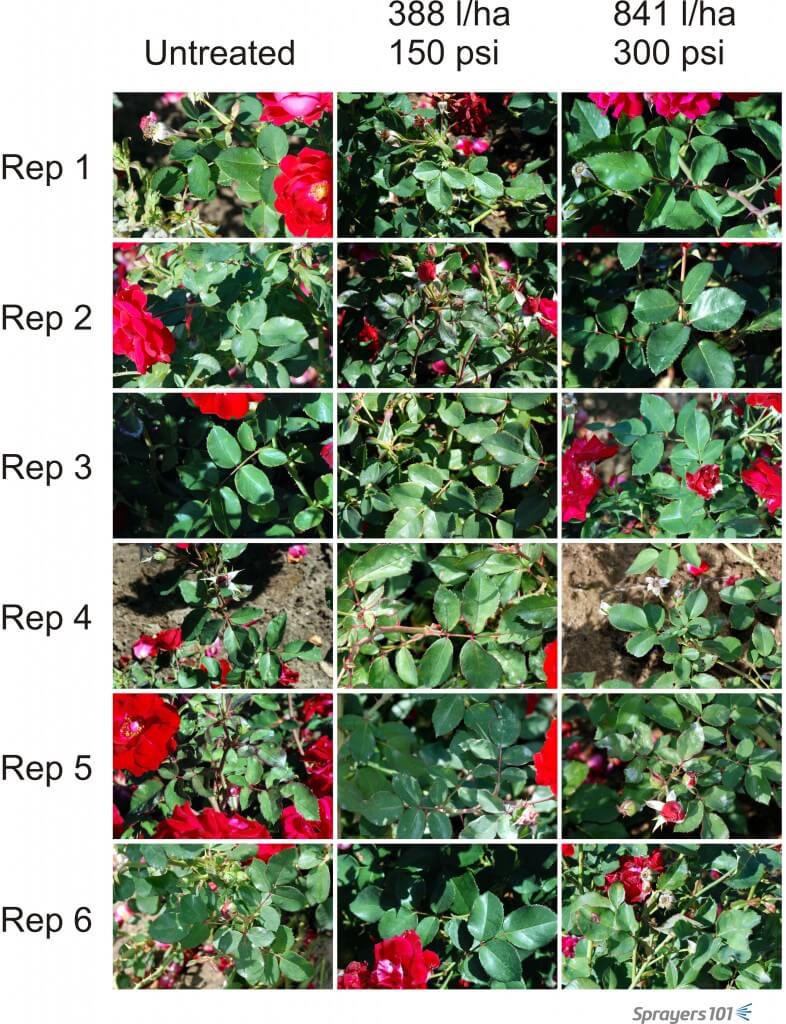
One application of Folpet + Nova was made on Sep 19, 2011. Roses were photographed before and after the treatment. The photographs were digitized and the amount of powdery mildew appearing on the upper surfaces was determined as a percent of the total visible leaf area. Six replications were randomly selected from each block.
Visual record of randomly selected roses prior to treatment (September 9).Visual record of randomly selected roses immediately following treatment (September 20).
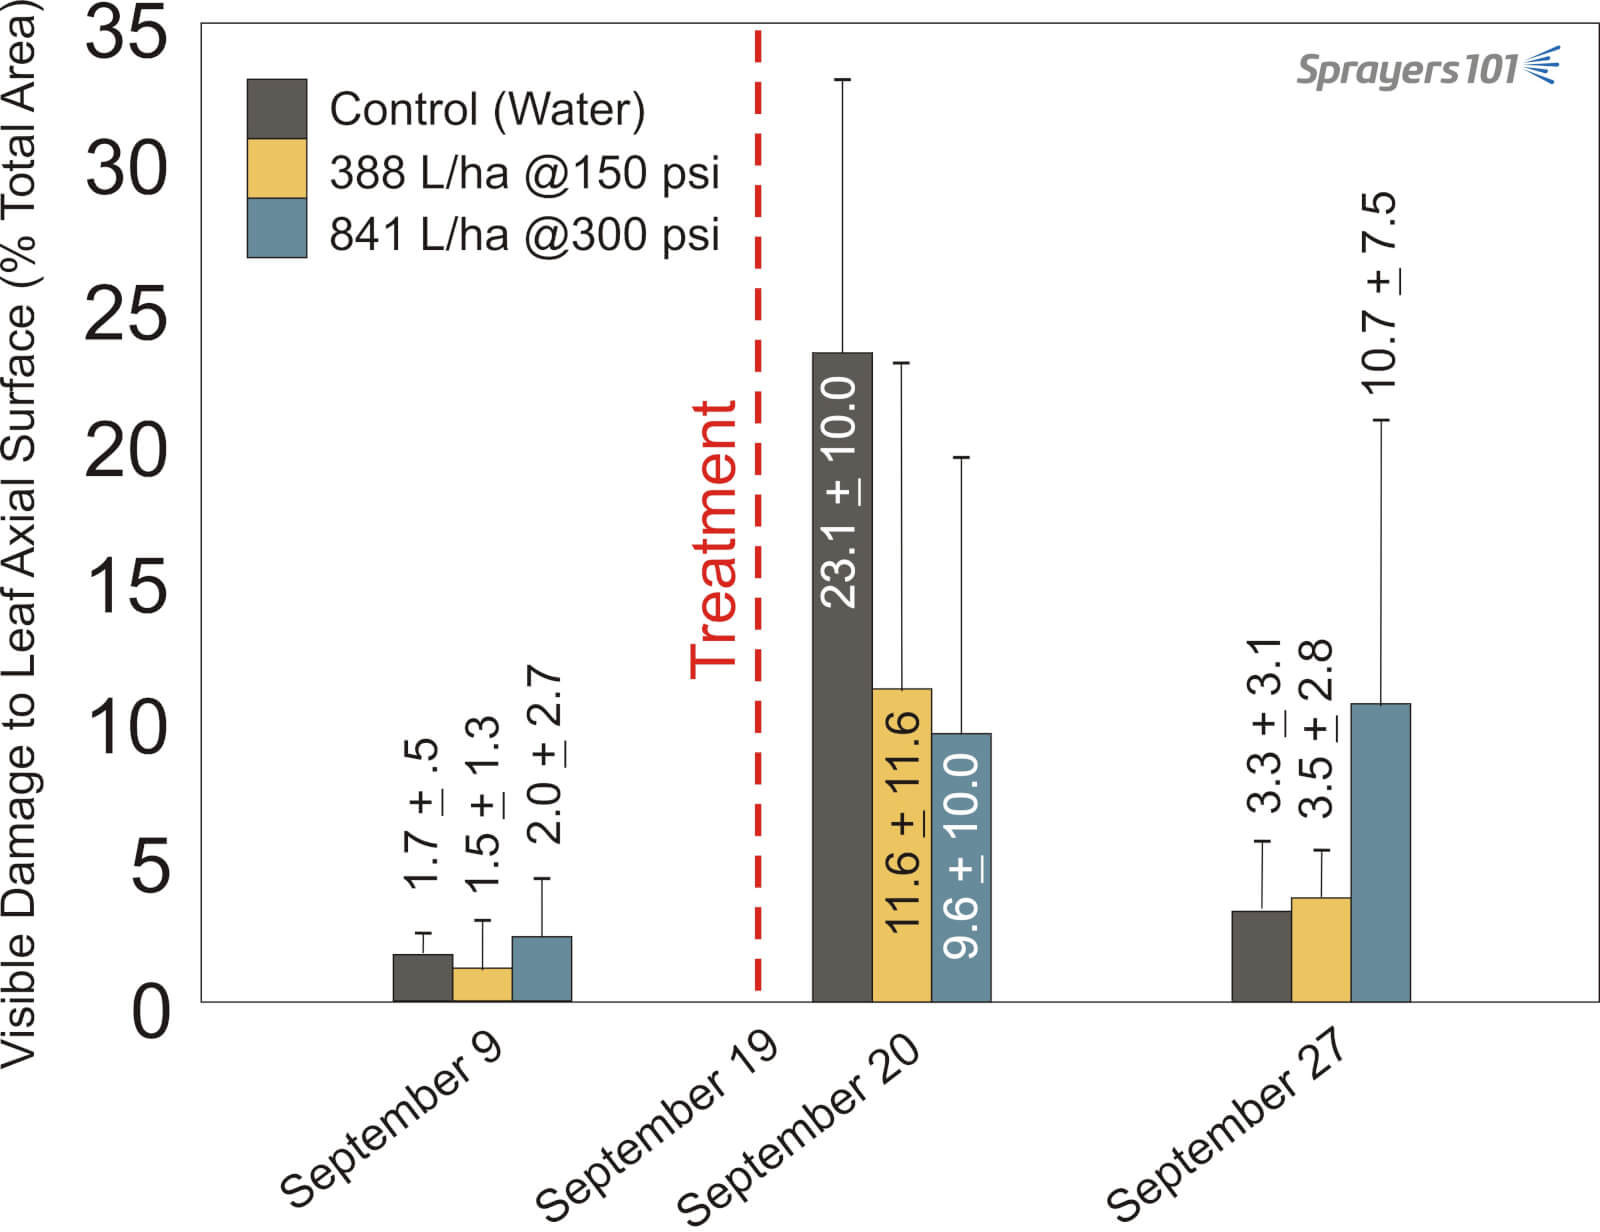
There was no significant difference in the amount of mildew presented in the two sprayed blocks one day after the application (September 20). Eight days after application (September 27), there appeared to be better control in the optimized sprayer set up condition versus the grower’s standard set up. The large standard error bars in the grower’s condition made this statistically insignificant. It is unclear why the untreated block presented with the least visual mildew at this point. This preliminary work demonstrates the value of customized application settings and their potential to conserve pesticide, water, and fuel without compromising pesticide efficacy.
Results of optimizing sprayer set up on the visual occurrence of powdery mildew on rose leaves. Bars represent standard error of the mean. Unclear why control block presented less mildew on Sept 27.
The Ontario Farm Innovation Program and the grower co-operator are gratefully acknowledged for making this research possible.
No sprayer operator is more preoccupied with work rates, sprayer cleanout and tank mixes than the custom (aka contract) applicator. Perhaps this is why we’re seeing more direct injection systems on their sprayers in recent years.
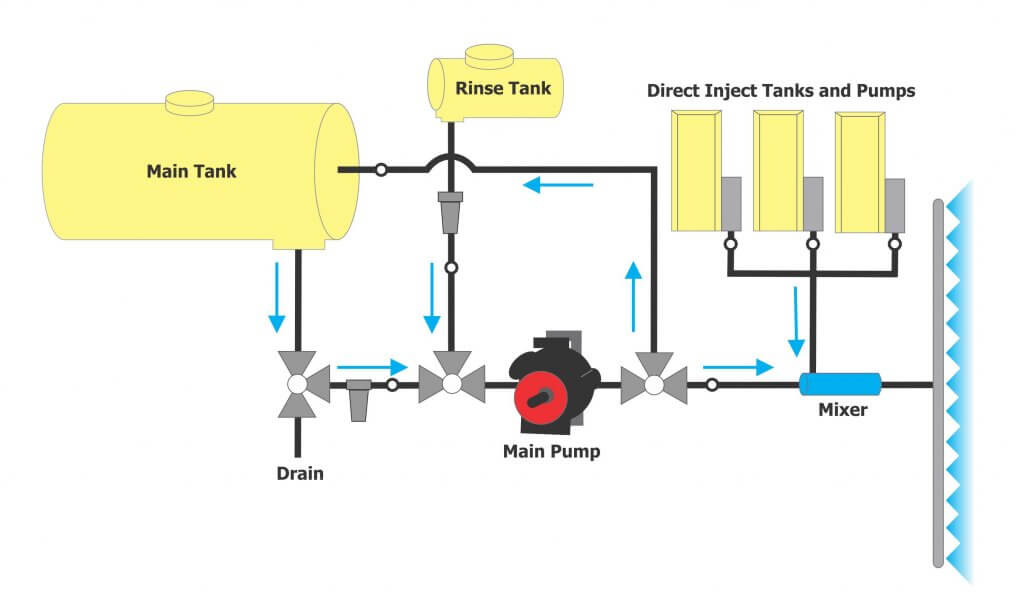
Injection systems employ additional tanks and pumps to introduce undiluted product directly into the carrier just prior to the boom. They are designed to maintain the product concentration in the boom (they are not for variable rate prescription spraying within in a field). This permits the operator to change tank mixes between fields without having to clean out or refill.
This generic plumbing diagram depicts an injection system that can create custom tank mixes from products held in three separate tanks. The rinse system, number of tanks, pumps and the point of injection (main pump suction or pressure side) are system-specific.
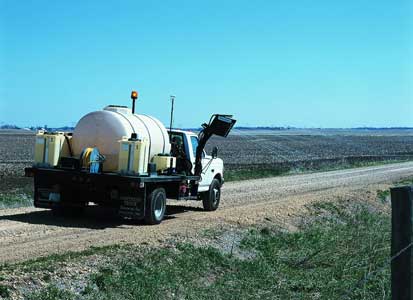
In the 1980’s, Mid-Tech first offered the TASC peristaltic pump injection system. The bulk of this market was (and still is) right-of-way applications (e.g. railways, highways). Unlike a field application, which covers an area, these sprayers cover a linear distance that makes reloading challenging. When the chemistry is carried onboard, water can be easily accessed along the way.
Boomless roadside spraying using an injection system (Photo courtesy of TeeJet).
In the 1990’s, field sprayer operators tried using direct injection and encountered problems:
Spray concentrations would fluctuate because product was injected based on travel speed while the carrier rate was a constant.
Latency (aka lag) issues were commonplace. Imagine spraying 10 gpa using a boom that holds 15 gallons. A change in speed would prompt a change in injection rate that would not reach the outermost nozzles until half the acre was sprayed.
And, changes in temperature affected the accuracy of the injection systems, so rates changed as cold mornings gave way to warm afternoons.
But the technology has evolved. Today’s injection systems are more consistent and accurate. Here are a few niche usage scenarios to consider:
Usage scenarios
1. Anhydrous ammonia applications require nitrogen stabilizers. The stabilizers are intended to treat the soil, not the ammonia. An injection system can introduce nitrogen at a rate that matches a field’s soil type, while the ammonia is applied on a per-area rate.
2. *Small plot work, such as seed production, consists of many sub-acre plots requiring a range of doses. Injection systems improve work rate by reducing refills or cleanouts between applications.
3. Where appropriate, border sprays of insecticide can be introduced during herbicide post applications.
4. Applicators can adjust herbicide mixtures and glyphosate rates between fields depending on weed pressure.
5. Custom applicators can adjust glyphosate rates when terminating cover crops. For example, alfalfa is a perennial planted for feed before corn. When it gets hardy and begins dormancy late-season, it requires more glyphosate. Oats are used as a cover following winter wheat, and both oats and volunteer wheat require a much lower dose.
6. Clients of custom application may or may not want foliar fertilizer (e.g. zinc) amendments. This service is only feasible using direct injections systems.
*This scenario was communicated to the author by a company selling the equipment, but subsequently there has been some question as to how this might work. The amount of time and water required to clear lines between applications would depend on the nature of the chemistry and whether it is a rate or wholesale chemistry change. As such, there are situations that would make this an impractical use of the technology.
Today’s injection systems
Mid-Tech/TeeJet
In early 2000, TeeJet acquired Mid-Tech and offers two injection systems that can control up to six 28 L (7.5 gal.) or 95 L (25 gal.) tanks on a single sprayer. The tanks have an optional agitation feature.
The MT-500 peristaltic pump (still predominantly for roadway applications) injects into the suction side of the main pump to facilitate mixing. It delivers 6-10 ml/min. (0.2-350 oz/min.) but flow rate can be changed by changing hoses. Peristaltic hoses lose accuracy as they wear with time, but hose is cheaper to replace than seats on a piston pump. It can run in reverse to pull product back from the lines. It works with the TASC controller.
The MT-600 is a piston-pump with a mixing chamber option that injects the pressure side of the main pump leaving more clean line and increasing response time at the nozzle (i.e. less lag). It must have backflow prevention (typically a seated ball valve). Depending on the rate required, high and low-volume product pumps can be added in pairs to extend the range: 15-1,500 ml/min. (0.5-50 oz/min.), 30-3,000 ml/min. (1-100 gal./min.), 45-4,500 ml/min. (1.5-150 oz/min.) or 60-600 ml/min. (2-200 oz/min.). High and low-volume product pumps can be added in pairs to extend the range. This pump works with TASC controllers and the ISOBUS Legacy 6600 and Aeros 9040.
Raven
The Raven Sidekick Pro replaced their original Sidekick in 2011. It is ISOBUS compatible with many sprayers and their controllers (e.g. Deere’s Greenstar 3, Raven RCM). It controls up to five 90 L (24 gal.) or 190 L (50 gal.) tanks with optional agitation that can be removed like totes. Depending on the rate required, low [0.03-1.2 L/min. (1-40 oz/min.)] and high-volume [0.15-6 L/min. (5-200 oz/min.)] positive displacement product pumps can be used alone or in pairs to extend the range. Product is injected into a length of latticed pipe in-line on the pressure side of the main pump to create a mixing action prior to the boom.
Other entries
In North America, SurePoint sells the Spartan, which claims to support the direct injection of liquid chemical, fertilizer, biological, or other product into the carrier flow stream. It may be intended for towed implements rather than on a self-propelled sprayer. There are also European entries from Danfoil (theMultidose) and Diimotion (prototype PiiXdi), but information is sparse and the last update we found on either was c.2017.
In 2025, the UK’s Knight Sprayers won gold at LAMMA 2025 for their Smart-Inject chemical system. Details are light at this point, but it’s described as a third-party retro fit for spot sprayers. Slightly diluted product in held in a second, smaller tank and circulates separately and in parallel with the sprayer’s existing lines. Chemistry is injected on demand (e.g. when a weed is detected) directly into the nozzle body between the shut-off valve and the nozzle cap.
Pump and tank selection
Quite often, direct injection users regret limiting their pump capacity and the number of tanks installed. This limits travel speed and encourages risky practices such as mixing multiple products in a single injection tank.
Direct injection systems should be capable of staying within your target rate and travel speed. You can calculate your pump requirement in oz/min. using the following formula:
So, if you are considering a direct chemical injection system, give some thought to the following pros and cons.
Pros
Cleanout is faster when the main tank is reserved for water (Although some operators continue to mix in the main tank and use the product tanks to amend the mix).
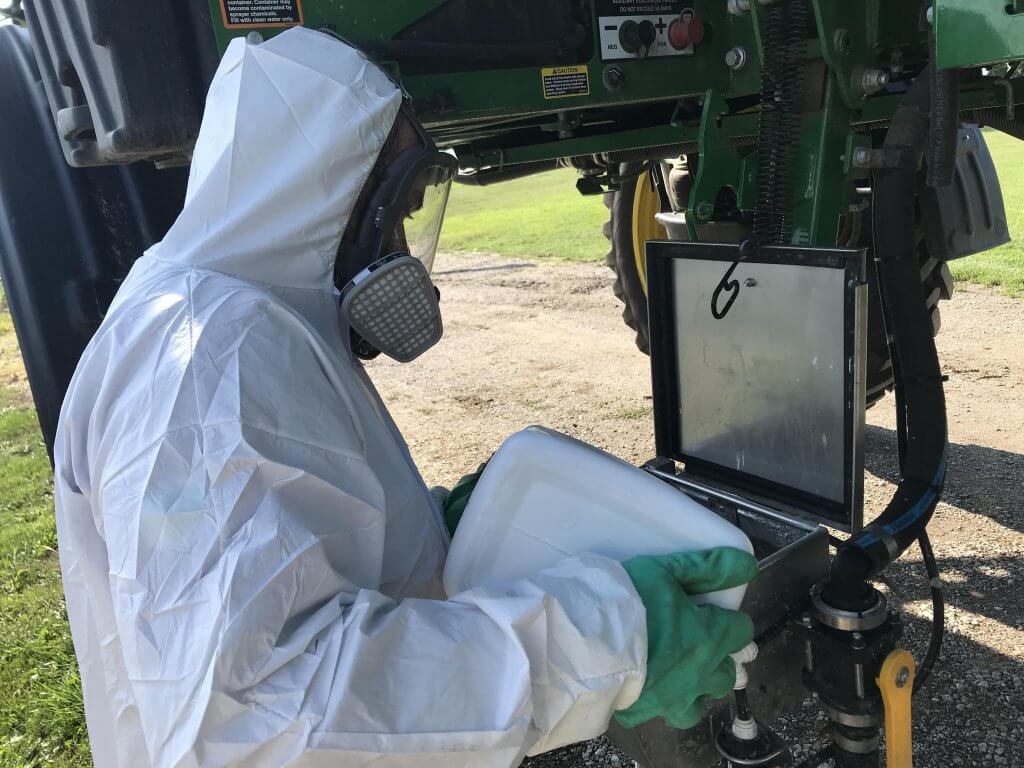
Product tanks are filled from bulk, so there are fewer jugs to handle. That reduces waste and operator exposure during loading.
Work rate is improved by altering tank mixes between fields without cleaning and reloading.
There is no spray math required during loading and no excess or deficiency at the end of a field.
There is no concern about a tank mix sitting for long periods during delays.
There is reduced potential for spills due to accident or malfunction.
Tracibility is improved; Instead of recording tank mix per acre, record tank mix by field.
Cons
Expense.
Rinsing systems, if available, do not clean lines between injection pumps and tanks. Cleaning requires pulling them apart manually.
Product tank loading can be slow (up to ½ hr to load 50 US gallons with certain loading assemblies).
Some products are harder to clean out than others and can plug the injection pump if left full of chemical.
The number and volume of product tanks may not hold a day’s worth of chemicals.
Viscous or clay-based products prone to settling or separation (e.g. PrimExtra on corn or Boundry on beans) should not be used.
Thanks to Rob Warwick and Markus Redmond (John Deere), Dennis Frey and Jordan Diefenbacher (Clean Field Services), Brian Satorius and Andy Graber (TeeJet Technologies), Nick Michael and Gary Esselink (Raven Applied Technology), Jan Langenakens (AAMS) and Mark Ledebuhr (Application Insight LLC) for informing this article.
We’ve identified and discussed shortcomings in the content and design of today’s pesticide labels in an earlier article. From the perspective of the spray applicator, the information needed most often can be difficult to locate, anachronistic, contradictory, subjective or even missing from the label altogether. To truly encourage an applicator to read and follow the label we need a consistent, concise and clear format that summarizes critical content.
To that end, we have worked with growers, university/government extension and industry to develop a prototype we’re calling the “Label Summary Sheet”, or LSS for short. We presented the concept in a series of public presentations in western Canada as part of the RealAgriculture TechTour Live event in 2018. You can watch a recording of part of that event at the end of this article.
The LSS does not replace or interpret the current label, which is a legal document. It is a summary intended to accompany it. At this stage the LSS is simply a proposal. These documents are not intended for use right now; we hope they will grow and change for the better as they stimulate discussion.
Consider this metaphor: You have just purchased a laptop. When you unbox it, you get an in-depth instruction guide that covers everything from operation to trouble shooting and includes all the legal riders. It’s a daunting technical document that you likely won’t read unless something goes wrong. Knowing that, manufacturers include a graphic and accessible quick start-up guide that summarizes the most common and critical issues. It doesn’t replace the instruction manual, it just augments it. If you can’t find what you need in the quick start-up guide, you are referred to the more fulsome description in the instruction manual. Think of the pesticide label as the instruction manual and the LSS as the quick start-up guide.
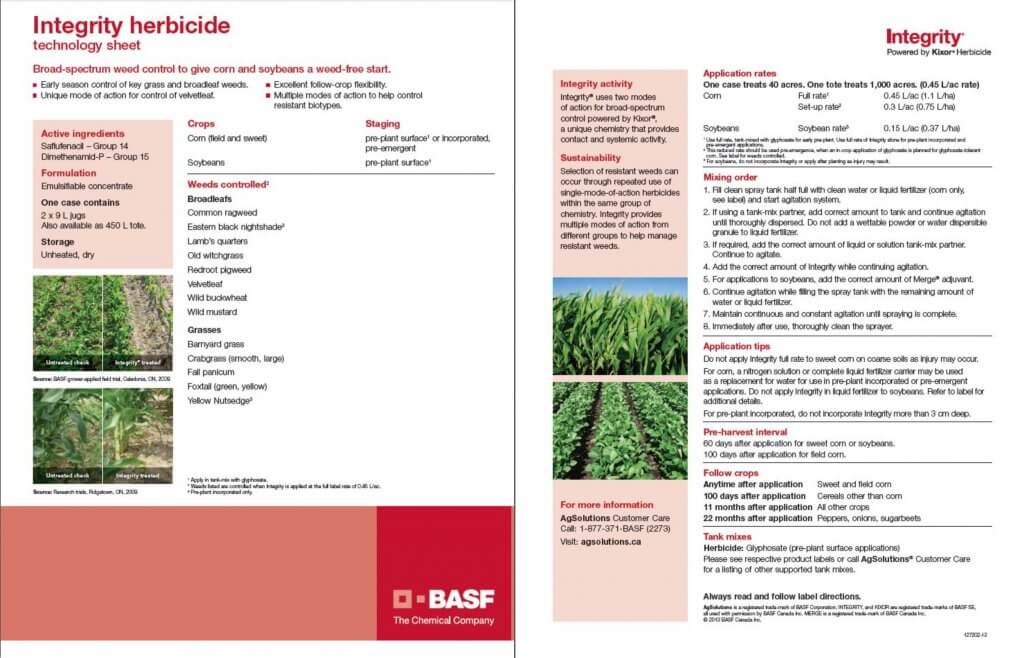
Some agrichemcial companies recognize this need and have developed short documents to summarize key aspects of the label, but they are inconsistent and brand-specific marketing documents that do not always contain the information we are proposing. Here, for example, is the technology sheet for Integrity herbicide.
We tested the versatility of our LSS format by summarizing four diverse pesticide labels. Our selections are not intended to imply that these labels are particularly deficient. Only that they are commonly used, somewhat complicated and represent the spectrum of pesticide categories and application methods.
Download and look at the variety of labels we have summarized as examples. They are available here:
Note that each LSS features the same section headings and a relatively consistent layout, no matter the manufacturer. Generic icons are used to illustrate content and make it easier for users to navigate without language barriers. The LSS are black and white to facilitate reproduction and refer back to their respective pesticide labels (i.e. the online PDF, not the booklets that come with the pesticides).
LSS Sections
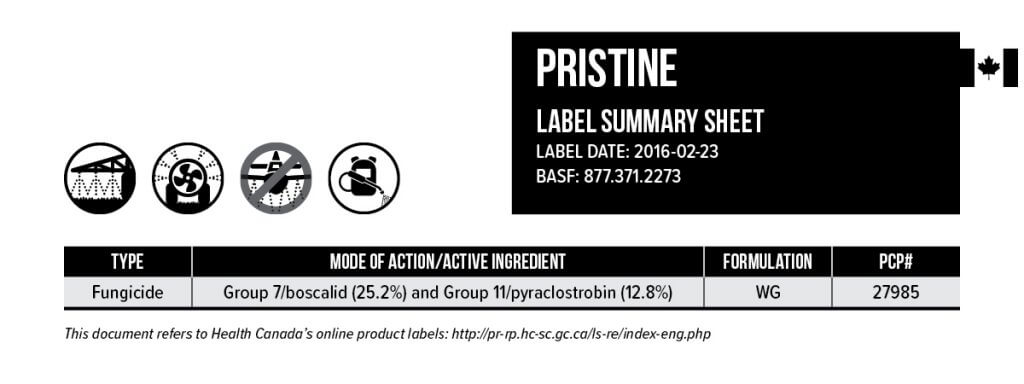
Here is the Pristine LSS broken down by section to highlight the key features.
1. Banner Section
The banner is at the top of every LSS. It gives the commercial product name and the date to ensure the LSS reflects the current pesticide label. Four icons represent the most common application technologies: Horizontal boom sprayer, airblast, aerial and handheld. If an application method is prohibited, a banned symbol appears (such as aerial in this case). Note we have left room for RPAAS (UAV’s) anticipating the day we have products registered for that technology. The table notes the type of pesticide (e.g. fungicide, insecticide, adjuvant, etc.). The mode of action and active ingredient(s) are noted, as well as the formulation and the Pest Control Product number.
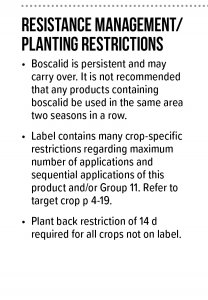
2. Resistance Management / Planting Restrictions
Intended to provide key information on managing pesticide resistance, this section reflects label content about carry over and the rotation of active ingredients. Further, to aid in application decisions, it reflects any restrictions around maximum number of applications, sequential applications or plant back issues following use.
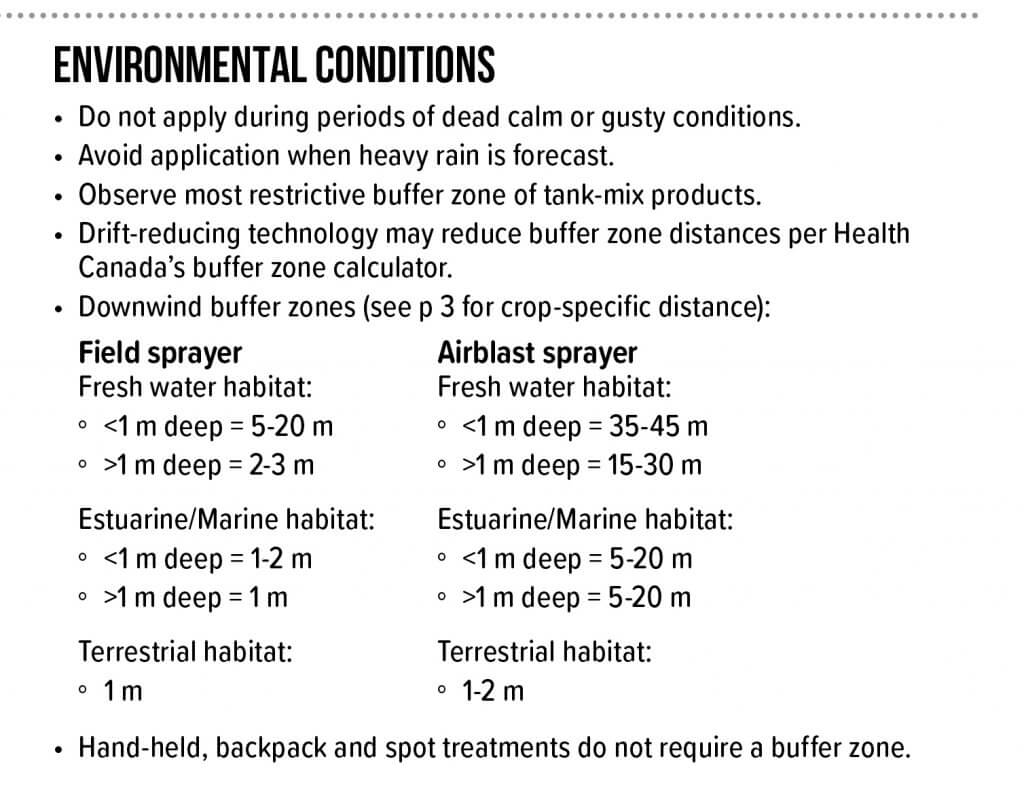
3. Environmental Conditions
Any restrictions regarding weather conditions during or after application are noted here. This includes set-backs or buffer zones that reflect method of application and the nature of the adjacent or downwind area in question.
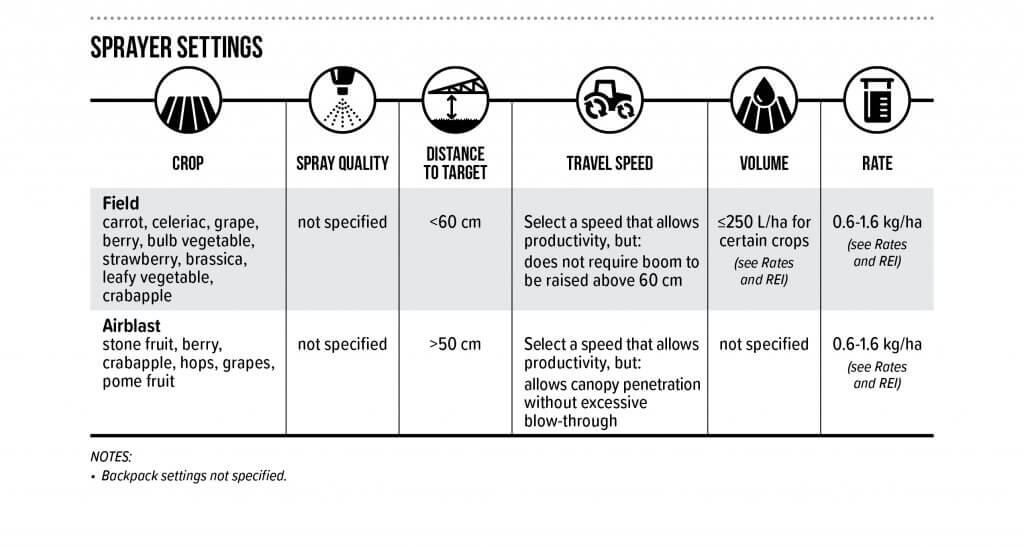
4. Sprayer Settings
This section includes the six most commonly asked questions an applicator has when calibrating or adjusting their sprayer prior to use. It is organized by target crop and method of application. When the label provides a high level of detail, the user is referred to the correct page. Note the use of graphics to quickly direct the reader to the information they need. Any additional qualifications found in the label relating to sprayer settings are indicated in the notes beneath the table.
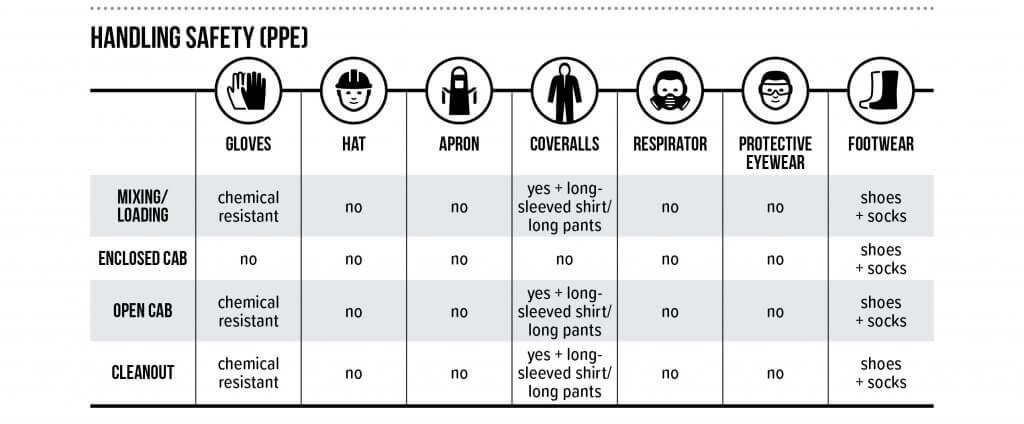
5. Handling Safety (PPE)
The concept for this simple and graphic table originated in France, and was communicated to us by Dr. Carol Black of Washington State University. This unambiguous format encourages the use of PPE while ensuring the handler uses the appropriate level of protection for each activity.
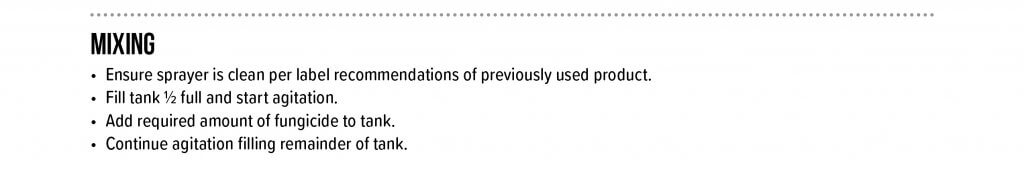
6. Mixing
As operators tank mix more products to curtail resistance, improve efficacy or improve productivity, there is a greater chance of chemical or physical incompatibility. This section summarizes any restrictions noted in the label. Learn more by downloading Purdue Universities’ publication “Avoid Tank Mixing Errors“.
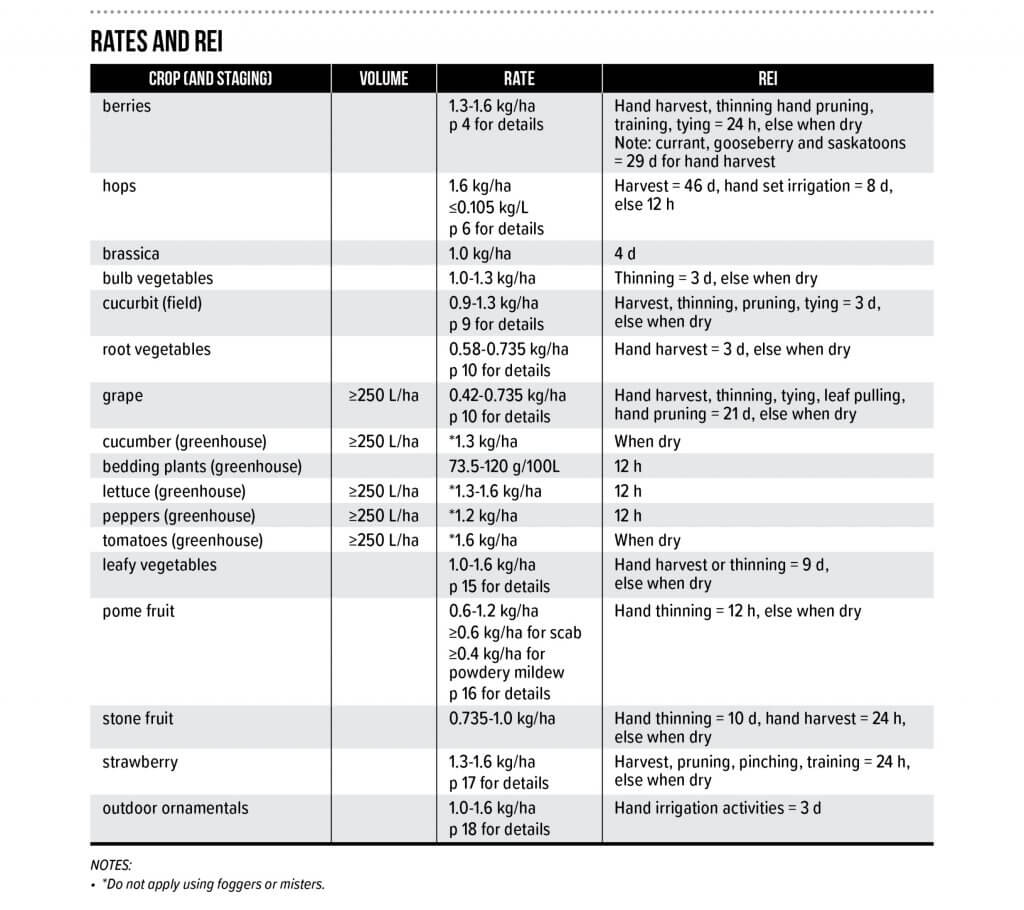
7. Rates and Restricted Entry Intervals
This table can be quite complicated depending on the pesticide label. It summarizes the rates, volumes and restricted entry intervals by crop. It reflects the broadest range of product rates listed in the label. Restricted entry duration is affected by the post application activity, and this is captured in the REI column. If more detail is required, the user is referred to the appropriate page(s) of the label. Any additional qualifications found in the label relating to rates, volumes or REI are indicated in the notes beneath the table.
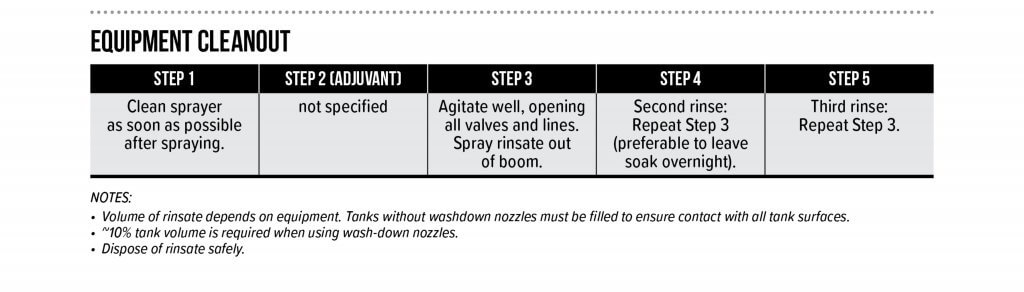
8. Equipment Cleanout
Finally, equipment cleanout is summarized (where possible) in a sequence of steps. When the pesticide label is silent on the cleanout procedure, the user is provided with the triple rinse protocol, which is generally held to be the industry best-practice.
Adoption
To date, this proposal has been made to Croplife Canada, the American Society of Agricultural and Biological Engineers (ASABE), an International Organization for Standardization (ISO) mirror committee (Equipment for crop protection) and more than 1,400 growers and stakeholders across Canada.
Our suggestion for adoption of the LSS (in its current form or something similar) is that regulatory agencies commission a working group comprised of representatives from grower groups, industry and government to oversee the process. The working group would support registrants as they populate (or update) the LSS template when a new product is submitted for registration, or as part of the natural review cycle.
Should the registrant encounter duplicate, missing or contradictory information while completing the LSS, it should be considered an opportunity to remedy the problem on the pesticide label. This will clarify the safest and most effective use of the pesticide for the applicator, who is currently forced to selectively ignore or interpret such errors. To our minds, this was the intent of the original labelling system, and the inclusion of the LSS is a simple and effective way to achieve that goal.
The Confusicol Sketch
In 2018 we participated in Real Agriculture’s TechTour Live event that toured four major cities in Western Canada in four days. We presented the “Confusicol sketch” as a light-hearted way to open a discussion with the audience on the strengths and weaknesses of Canadian pesticide labels and how the Label Summary Sheet might be a viable supplement. Here’s one of the live takes, warts and all. Turns out live sketch comedy is tricky…
PWM is gaining popularity, and there is an ever-increasing number of first-time users that need to make nozzle selections for their system. We’ve written about it here, here, and here.
Recall the PWM replaces spray pressure with Duty Cycle (DC) of a pulsing solenoid as the primary means of controlling nozzle flow. The solenoid shuts off the flow to the nozzle intermittently, between 10 and 100 times per second depending on the system. The Duty Cycle is defined as the proportion of time that the solenoid is open, and for low-frequency systems, DC is more or less linearly related to flow rate.
The first rule of PWM nozzle selection is to understand that under average travel speeds, we’d like to see the duty cycle of the system at between 60 and 80%. This means that the nozzle solenoid is open about 2/3 of the time. This value also describes the flow rate as a proportion of the full capacity that nozzle.
The reason for this 2/3 duty cycle rule is to enable four key features of PWM:
It’s ideal for turn compensation, allowing the outer nozzles to increase their flow 20 to 40%, and the inner nozzles to decrease flow about three-fold, in accordance with boom speed.
It allows speed flexibility, providing some additional speed, but more importantly, reduced speeds should conditions require it, without a change in spray pressure.
It compensates for pressure changes so that spray quality can be adjusted without requiring a speed change. Less pressure reduces nozzle flow, and increasing DC recoups accordingly.
It allows for customized higher flows of certain nozzles, perhaps behind wheels, to address reduced deposition in their aerodynamic wake (available on some PWM systems).
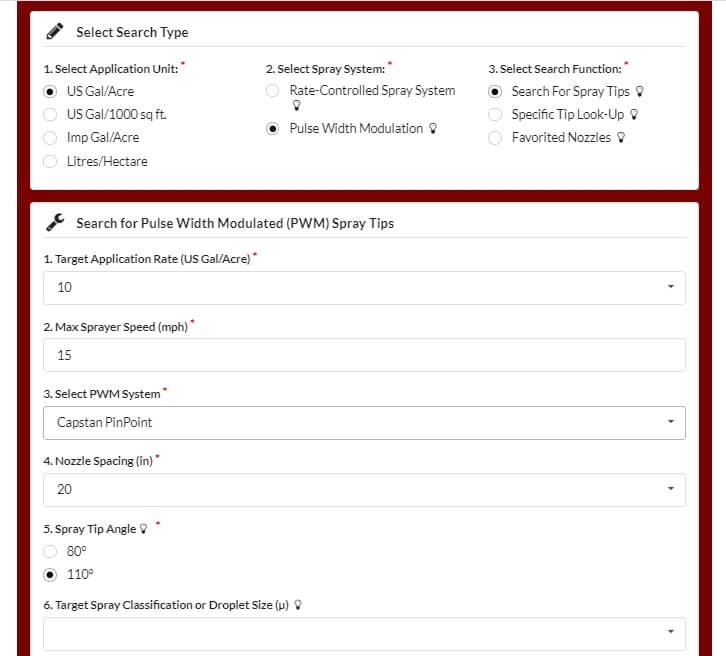
The best tool for selecting the right nozzle size is Wilger’s Tip Wizard. This site asks for your desired average speed ( although it calls this “Max Sprayer Speed”), and reports the expected DC for a host of nozzle size solutions and pressures. It also reports maximum and minimum travel speeds and other useful information such as spray quality.
Fig 1: The Tip Wizard is a useful tool for sizing nozzles on any PWM system. Sizing information applies to any nozzle. Spray quality information is for Wilger ComboJet nozzles only.
Although intended for Wilger nozzles, the site’s sizing feature works for any nozzle brand. It asks the user which PWM system they have for the purpose of calculating the documented pressure drop across the solenoid.
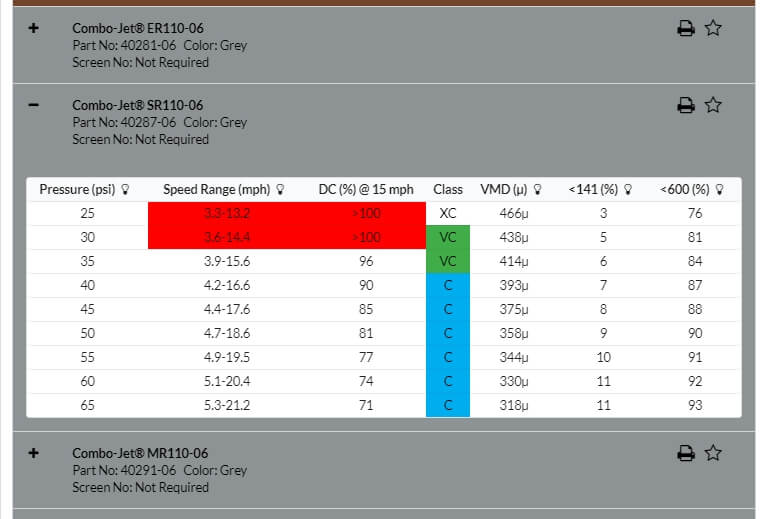
Fig 2: Tip Wizard results for the Wilger SR11006 tip at 10 gpa and 15 mph. Look for a solution that provides 60 to 80% Duty Cycle (DC).
If you don’t have access to the site, a basic calibration chart can still work with a simple trick. Recall that we use the top row to identify the desired water volume, and the table’s interior values are speeds, as described here.
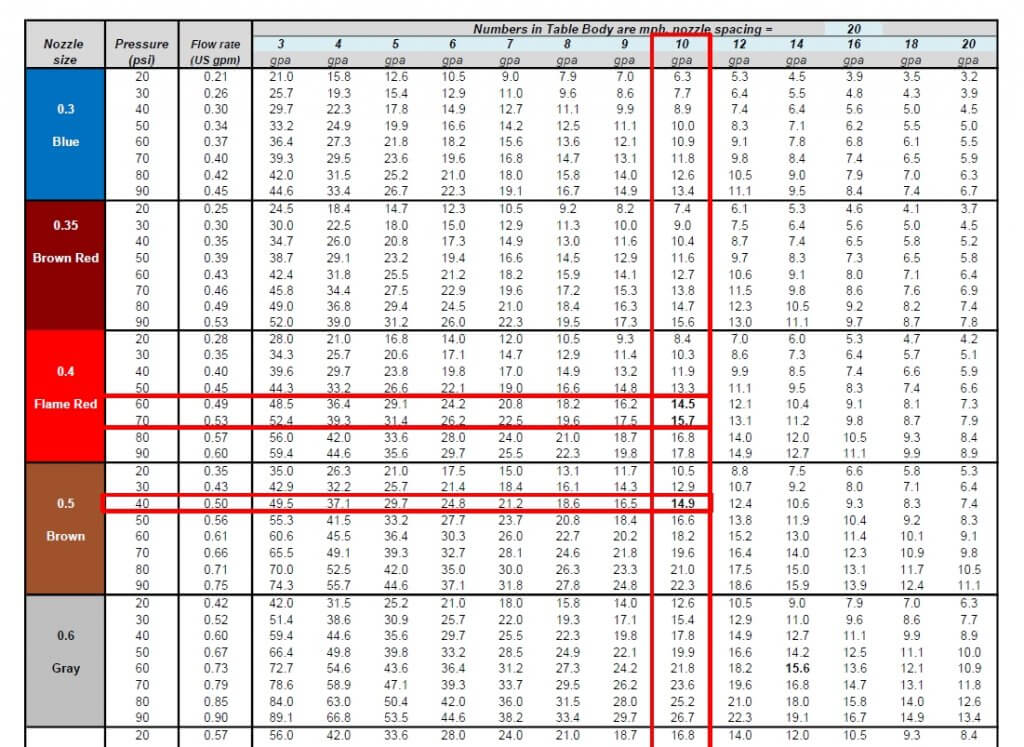
Below are two solutions for someone wanting to apply 10 gpa at 15 mph without PWM. The correct choice depends on the required pressure to produce the needed spray quality.
Fig 3: A conventional calibration chart, solving a 10 gpa application for 15 mph.
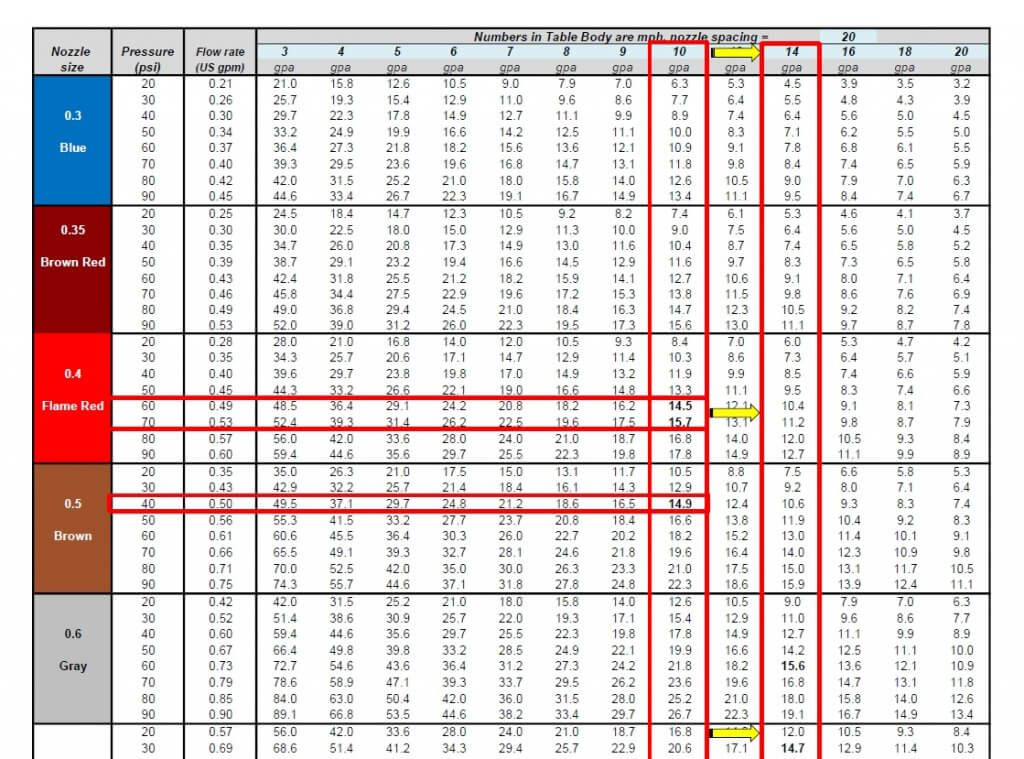
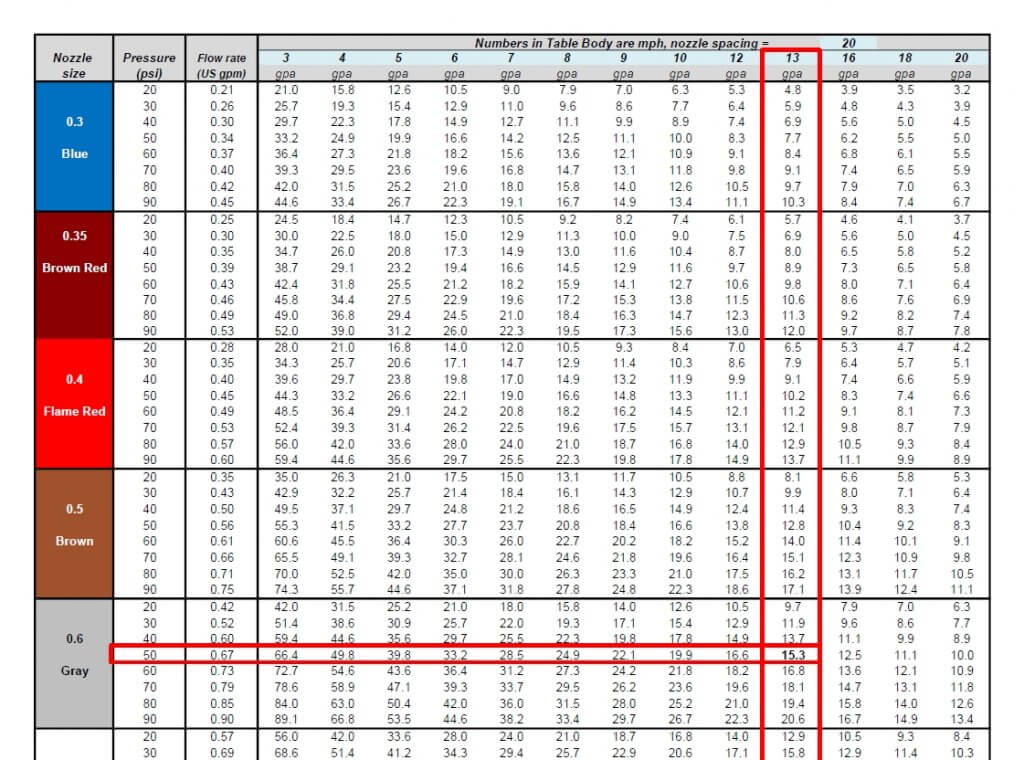
If you want to apply the same 10 US gpa using PWM, simply solve for a larger volume that offers the right DC. For example, choosing 13 gpa will over-apply by 3 gpa, or 30%. The PWM system adjusts by running at 100-30=70% DC. If the chart doesn’t offer 13 gpa, go nearby, to 14 gpa, as we did below:
Fig 4: By pretending to require 14 gpa instead of the actual 10 gpa, the conventional calibration chart is tricked into solving for a nozzle size that will work with PWM at 60% Duty Cycle.
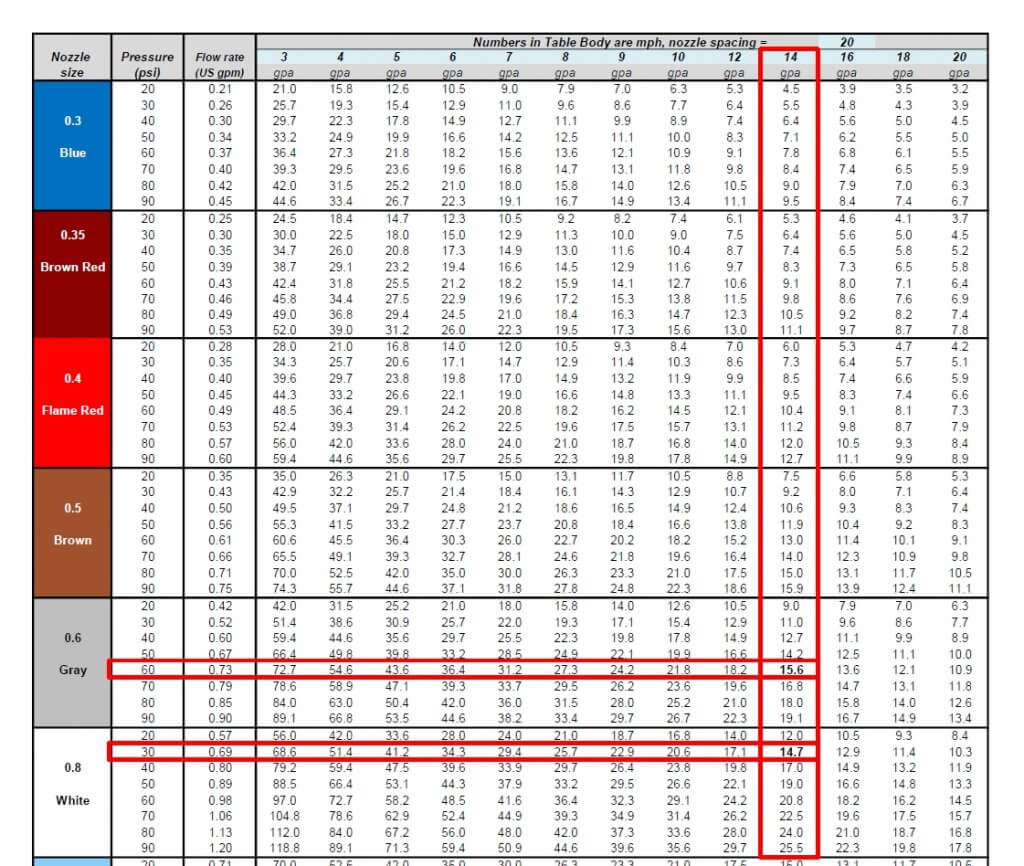
Now solve for the same target speed, 15 mph. The solution will run at 60% DC. Again, there is more than one choice, and that will depend on the spray pressure needed.
Fig 5: Two possible solutions for achieving 10 gpa at 10 mph. An 06 nozzle at intermediate pressure or an 08 nozzle at low pressure.
We’ve developed a template, in US or metric units, that can be customized for any water volume. Here is the same chart with 13 gpa added:
Fig 6: A conventional calibration chart with the 13 mph speed added.
The best solution for 10 gpa at 15 mph is the 06 size nozzle at 50 psi. This is not engraved in stone. One of the nice things about PWM is that it has inherent flexibility. Make the nozzle pressure a priority to get the correct spray quality. It really doesn’t matter whether the resulting DC is 65 or 80%, the system will still work well. Simply avoid extremes that take you below 50% or above 90%, they will limit the system’s capabilities.
It can handle any water volume or nozzle spacing by filling in the blue cells. Two additional worksheets in the file automate the process, simply enter the desired application volume, travel speed, and nozzle spacing (yellow cells), and the solution that offers the optimal duty cycle range will be highlighted in light green.