The idea of controlling weeds individually instead of treating the whole field uniformly makes a lot of sense. Why waste herbicides, till soil unnecessarily or use other weed control methods on areas without weeds? Besides reducing unintended environmental impacts, it means cost savings for the farmer, reduced crop stress and the opportunity to concentrate efforts where they are needed.
In this era of widespread herbicide resistance, the latter opens the door for new weed control tools – such as lasers or electrical weeding (Carbon Robotics as one example). Unfortunately, all the above absolutely relies on the ability to reliably recognize weeds in all manner of crop-weed conditions. Enter cameras, computers and cake recipes.
Besides alliteration, they are all connected by their role in real-time, in-crop weed recognition. So why isn’t weed recognition already widely available and how will this trio change that? Well, the way I look at it, if our faces were weeds, this problem would have been solved a long time ago. Said differently: new technologies mean that this challenge can be addressed with the necessary focus, investment, and research.
In the last few years, there have been step changes in research and development for real-time weed recognition, which are driving rapid gains for in-crop site-specific weed control. We are seeing this with the emergence of image-based green-on-green (GoG) see-and spray systems globally, many of which are listed in the table below.
| Sensor | Location |
| AutoWeed | Australia |
| Agtecnic SenseSpray | Austraila |
| Bilberry | France / Australia |
| Carbon Bee – SmartStriker | France |
| DeepAgro | Argentina |
| EXXACT Robotics | France |
| GreenEye | Israel / USA |
| John Deere / BlueRiver | USA |
| OpenWeedLocator (OWL) – developed by the author as a DIY, open-source weed detection system. | Australia |
| Xarvio / Bosch / BASF | Canada / Europe |
Yet, as the last 50 years of plant detection, identification and recognition research have shown, reliable weed recognition is a challenging problem to target. The aim of this article is to take you on the journey of weed recognition – from simple plant detection for thinning in the 1970s to every metre of a boom equipped with camera-computer-cake recipe combinations. Fortunately, we are well on this path toward more effective weed recognition.
Green-on-brown weed detection
As far as the available research shows, the first attempts at plant detection were made for thinning sugar beets in the early 1970s. The method is impressive in its simplicity – two sensors (photodiodes) that generate a signal based on incoming light intensity, are each covered by a filter that only allows specific wavelengths of light through. By knowing the reflectance spectrum for plants and comparing the ratio/output of these two sensors means you can detect if a plant has entered the field of view, but not necessarily exactly where it is.
In this case the weed detection ‘algorithm’ is a ratio of sensor values and some predefined threshold, which can be adjusted as a form of ‘sensitivity’. The concept is largely the basis of WEEDits and WeedSeekers today. This system has all the principles of advanced image-based systems: (1) data stream from a sensor/camera + (2) computer running a weed recognition algorithm + (3) some form of actionable output (e.g. turn on a nozzle).
Image-based weed recognition
With the fundamentals of SSWC largely consistent between sensor and image-based systems, the interesting details and drivers for GoG technology emerge if we dive into the data stream (images) from the camera and the algorithm running on a computer.
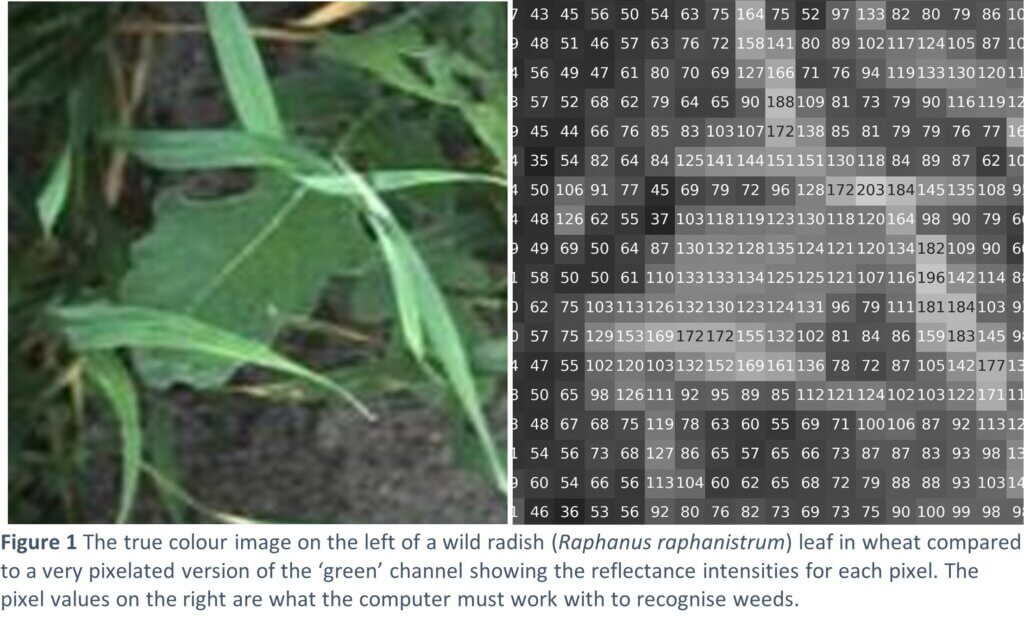
At its most basic, a digital colour camera is a sensor that generates signals based on incoming light intensity. The difference with the photodiodes is that a camera records this reflectance intensity information for every pixel in the camera across the red, green and blue (RGB) parts of the spectrum. For example, a 12-megapixel camera has 12 million pixels reporting reflectance intensity for each RGB channel. That means 36 million individual numbers generated for every photo. Learn more about the basics of digital imaging, here.
When you bring this together in an image, you have information on object relationships in space, providing not just a ‘spectral’ dimension (RGB) but also a ‘spatial’ dimension. The use of computers to understand image content is known as computer vision. Having all this data (colour and spatial information) means there is a lot more to work with when differentiating two plants, increasing your chances of success. The downside of having more to work with, is having to work with more! In this case, the computer needs to deal with the 36 million numbers it receives 30 times per second.
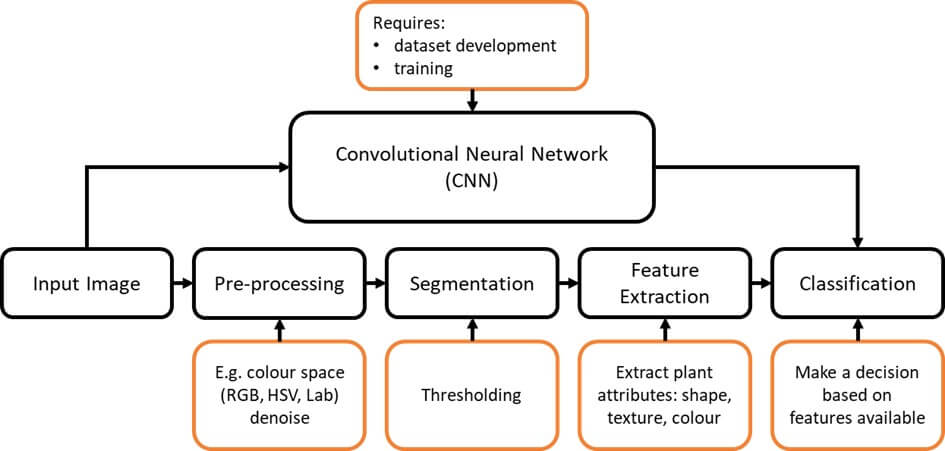
The next part of this weed recognition puzzle is the computer and associated weed recognition algorithms, which receive the incoming images and determine if there is a weed in the image. In the case of ‘conventional’ or non-convolutional neural network (CNN) methods (we’ll get to those later), this analysis process is largely formed of four stages shown in Figure 2 – (1) pre-processing, (2) segmentation, (3) feature extraction and (4) classification. If you’re interested in the details on the volumes of research done in this space, I’d highly recommend this review by Wang et al., 2019.
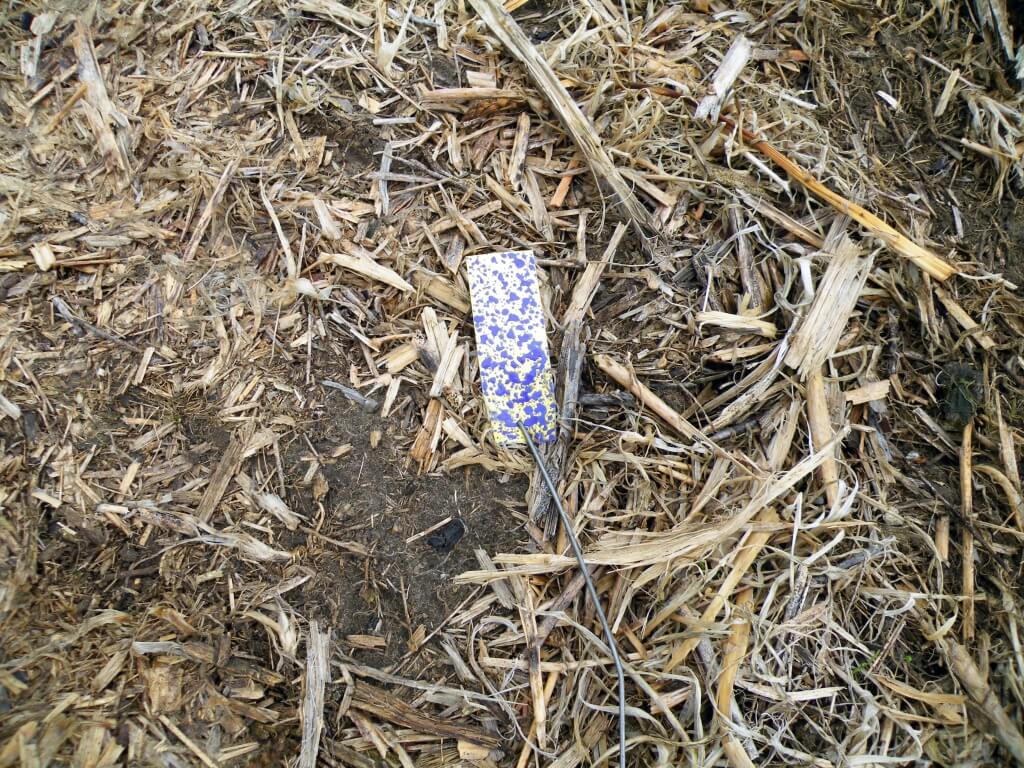
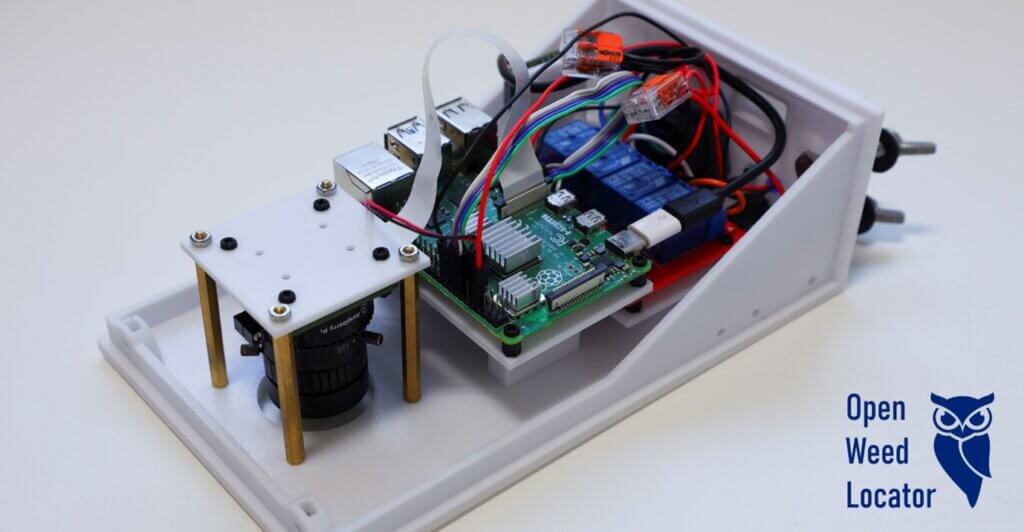
In the case of a simple colour-based detection system that just needs to find green plants in fallow, like our DIY weed detector the OpenWeedLocator (OWL), the algorithm is largely a threshold on the green colour channel using the RGB colour space. This carries some risk – for example if the lighting changes substantially or if weeds aren’t green the method can break down. Yet we went down this path because of the simplicity and speed with which it can be used on the rather computationally constrained Raspberry Pi.
Our field testing also showed acceptable levels of performance in variable fallow conditions. We managed these issues by combining multiple colour-based algorithms; relying on greenness in the RGB colour space from the ‘excess green’ (ExG) vegetation index, combined with thresholds in the hue, saturation, and value (equivalent to brightness) (HSV) colour space to avoid false detections on over/underexposed regions, which often occur in stubble. Even with these adjustments, the system is prone to errors, but the benefit of using cameras is that they can be levelled up for in-crop detection to more advanced algorithms.
The ‘green detection only’ approach without machine learning that effectively exits Figure 2 at the segmentation stage is also likely in the initial launch of John Deere’s green-on-brown See & Spray Select ™. Probably for the reasons above, they also warn against use close to sunrise and sunset where lighting is changing rapidly. As expected, the system pivoted to in-crop detection with deep learning in early 2022 because images and embedded processors allow software-only changes for green-on-green.
If weed species classification or crop-weed discrimination is needed for green-on-green use, then the remaining two stages of feature extraction and classification are required. In the conventional process, someone selected which plant attributes (known as image features) you wanted to use, trained an algorithm on those features and then ran it in the field, a method generally known as machine learning. In spite of this more advanced approach the performance drop between the test dataset and the variable field conditions meant the method was still commercially unusable in large-scale systems. So, what has changed?
Well, in 2012 a research group managed to substantially outperform all these other methods with an algorithm known as a convolutional neural network (CNN). Instead of an ‘expert’ identifying which plant attributes in an image were important, the algorithm itself could select and learn which features were most important, making it more robust. The CNN effectively skips all the steps in the conventional process (Figure 2), instead replacing them with having large quantities of training images with weeds manually highlighted – a newfound bottleneck itself, but not insurmountable.
Part of CNNs robustness comes from the algorithms being capable of analyzing many dozens of features and combinations of features that wouldn’t necessarily be obvious to humans. In the training process, it tests one combination of features before correcting itself based on the training dataset you’ve provided and testing another. One of the biggest improvements is that by doing this feature extraction and selection process automatically, it removes the slow and somewhat qualitative process of deciding which features/plant attributes were most important. Besides this, the algorithms are incredibly large. Some of the modern CNNs have over 100 million (!) different dials that can be automatically tuned to learn the patterns of a weed.
Combined with these algorithms, we now also have low-cost (<US$150) credit-card sized computers such as the Raspberry Pi (when it has additional support) and Jetson Nano that can run these algorithms real time, or around 15 – 20 frames analyzed per second. Even when processing millions of pixels through CNNs with over a 100 million parameters 15 times per second, they consume very little power and can fit easily on agricultural equipment. Genuinely mind boggling every time I think of the sheer scale of it.
That leaves us with the cake recipe – how does that fit? Well, the step-changes in technology, particularly deep learning for image analysis can be largely attributed to the use of open-source software, data and hardware. Accessible datasets gave rise to the first effective CNN; open-source deep learning libraries (e.g. Tensorflow and Pytorch) to widespread adoption and development and open-source and/or low-cost hardware to field-scale implementations of the work. The best analogy I have heard used to describe an open-source approach is that it’s like sharing the recipe for a cake – except the code/assembly guide are the recipe and the ingredient list all the tools/languages/packages/components required to make it work.
Even though I could make an average chocolate cake with the ingredients in my pantry, I’ll still go and buy one for many different reasons – quality, convenience or support/returns in case it doesn’t quite live up to standards. The emphasis in this approach is on the quality of the entire product experience not necessarily a secret combination or method of combining ingredients. Plus, it means everyone with the basic tools can try making the cake or training the algorithm, discovering opportunities for fixes, optimization or low-hanging fruit that may change its use case entirely.
I mean, Australians took sponge cake and made lamingtons! In my own experience with the OpenWeedLocator, we built a device for detecting green weeds in large-scale fallow situations. But in true open-source fashion, this has now been used for site-specific fungicide sprays, desiccant application and under trees for weed control. A Canadian innovation – AgOpenGPS – developed by Brian Tischler is an open-source GPS steering system for tractors, similarly enabling farmer-driven development. The examples of different uses are quite extraordinary.
One of the main tenets of open-source technology is that by allowing people to see the details of software and hardware, a larger and more diverse array of people can examine the code and any inefficiencies and errors can be picked up faster. Besides this, it makes research and development accessible to those that might need the technology – the farmers – instead of it being locked away in large companies with inaccessible customer support. Farmer-driven innovation has a long and successful history and open-source development facilitates this continuing to occur in the era of agritech.
Over these last 50 years of development, the cameras, the computers and the open-source recipes have each contributed at different points to site-specific weed control. It seems that now they are converging in agriculture in a storm of interest and development for weed recognition and targeted application.