Category: Drift

Hort articles about spray drift and mitigation.

  • What is Delta T and why is it important for spraying?

    What is Delta T and why is it important for spraying?

    Click here to listen to Audio Article

    Humidity is important in spraying. With the average tank of pesticide being 90 to 99.5% water, evaporation plays an important role in both droplet size and active ingredient concentration. Low humidity causes droplets to evaporate faster, potentially increasing drift and reducing uptake. But relative humidity (RH) isn’t the best way to measure this effect because the same RH at two different temperatures results in two different water evaporation rates.

    Instead, we present Delta T, also known as “wet bulb depression”. Delta T is an atmospheric moisture parameter whose use in spraying has made its way to North America from Australian operations. It is defined as the dry bulb temperature minus the wet bulb temperature, and provides a better indication of water evaporation rate than RH. Higher Delta T means faster water evaporation.

    The recommendations from Australia are to avoid spraying when the Delta T is either too high or too low, with a range of two to eight being described as ideal.

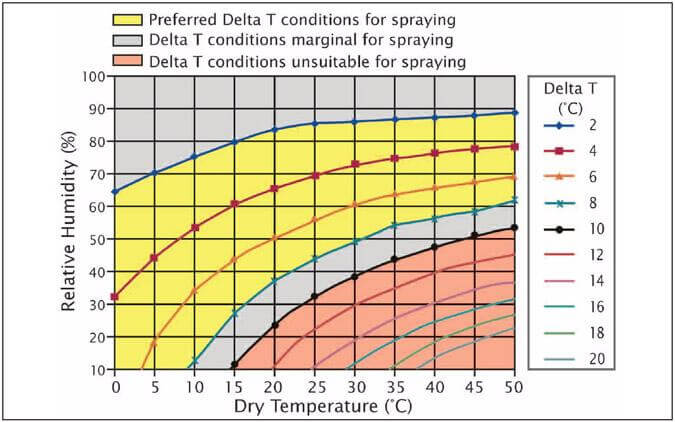
    Figure 1: Delta T chart used in Australia (Source: Australian Gov’t Dept of Meteorology)

    Delta T is being reported on an increasing number of weather stations, and it’s time we took a closer look at what it means.

    Measuring Relative Humidity

    In the early days of weather reporting, relative humidity was calculated from psychrometric charts. All one needed was a hygrometer, usually a sling psychrometer. A sling psychrometer is two identical thermometers side by side whose bulbs could be slung in a circle, exposing them to moving air. One bulb was covered in a cotton wick moistened with distilled water, the other was left exposed and dry.

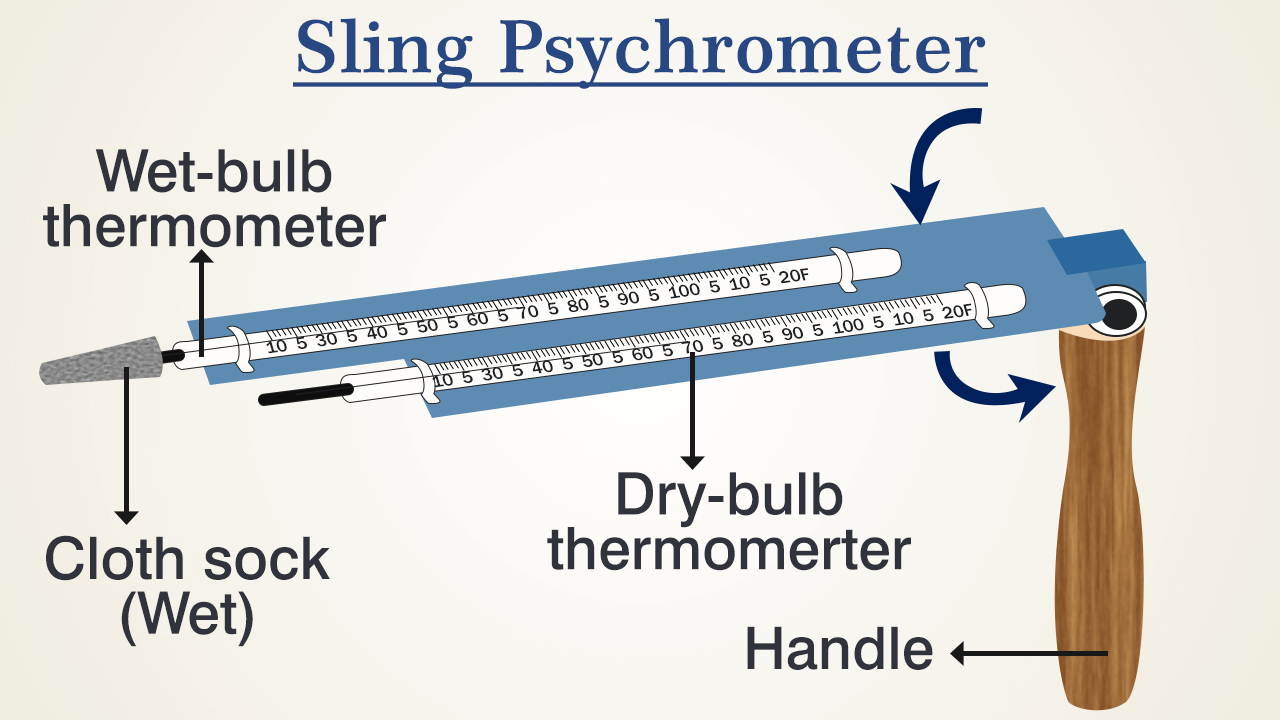
    Figure 2: Sling psychrometer (Source: ScienceStruck.com)

    As the bulbs met moving air, water evaporated from the cotton wick and that reduced the temperature of that thermometer. The dryer the air, the greater the evaporation rate and therefore the greater the temperature drop. The dry thermometer was unaffected by this movement.

    On measuring the wet and dry bulb temperature, one consulted a psychrometric chart. This chart converted the two temperatures to total water content in the air, compared it to total water-holding capacity, and expressed it as Relative Humidity. Psychrometric charts are useful for many other air parameters such as dew point, vapour pressure, or enthalpy. (Pause briefly to give thanks that we don’t need to know what enthalpy is.)

    Figure 3: Psychrometric Chart (Source: Carrier Corporation)

    Turns out that RH is a poor measure of water evaporation rate. An RH of 24% at 20 C has exactly the same evaporation rate as an RH of 44% at 35 C. That’s why Delta T is the preferred measurement: it’s linearly related to evaporation.

    Note: Modern electronic weather stations don’t need two thermometers to measure air moisture content, and use polymers whose capacitance or resistance changes with atmospheric moisture. Add an internal look-up table, and we have all the information we need.

    Pros and Cons of Water Evaporation

    It’s important to note that our Australian colleagues caution against spraying when water evaporation rate is both too high and too low.

    Too High:

    • Water evaporates rapidly, reducing droplet size and pre-disposing the smaller droplets to drift;
    • Deposited droplets dry quickly, reducing pesticide uptake which is more effective from a wet deposit.

    Too Low:

    • Water doesn’t evaporate, maintaining the smaller droplets in a liquid state. These small droplets are already drift prone, but are now more potent because of more effective uptake. Overnight conditions that are inverted are usually humid, adding to harm potential from the inversion.

    Delta T in North America

    The addition of this parameter to our spraying weather lexicon has been useful. But it’s important to understand the context in which it was developed to properly judge its suitability.

    Aussies started talking about Delta T because the use of finer sprays under the hot dry conditions found during their summer sprays resulted in significant evaporative losses, significantly greater drift potential, and potential reduction of product performance. The guidelines to avoid spraying when Delta T exceeds eight or ten originate there.

    A few changes have happened since these guidelines were developed. Over the past ten to 20 years, we’ve observed greater use of low-drift sprays, with the coarser sprays’ larger droplets resisting fast evaporation. In the past five to ten years, water volumes have increased due to our heavier reliance on fungicides, desiccants, and contact modes of action. Both of these developments have helped reduce the impact of a dry atmosphere. We simply can’t say if a Delta T of 10 is too high with these new application methods.

    Looking at it another way, if Delta T values are very high, increasing water volume and droplet size will mitigate that to some degree, as the Aussies state in their extension materials (linked earlier).

    Formulation

    Pesticide formulation can also play a role in evaporation. Once the water is gone, oily formulations may still have good uptake because the oily active ingredient stays dissolved in the oily solvents. This is both good and bad, helping on-target efficacy but also increasing the risk of more potent drift. Solutions, on the other hand, are more likely to leave their actives stranded on leaves as crystals once the water is gone.

    Bottom Line

    Delta T is definitely useful information when spraying. It will typically rise and fall with air temperature as the day proceeds, and it is wise to consider suspending operations when values are critical. Take note of the Delta T when spraying the same product throughout these hot days and learn from the experience. Remember, the atmosphere affects not just sprays but also plants and insects, and due to this complexity we may not be able to attribute success or failure to just one measurement.

  • “Bee” Responsible with Pesticide Sprays

    “Bee” Responsible with Pesticide Sprays

    Horticultural crops cannot be produced commercially without the use of pesticides to manage the impacts of insects and pathogens. Growers recognize the importance of pollinators and in some cases, rely on bees for pollination. Growers are practicing due-diligence to try to minimize the effects of necessary pest management activities on bees. There’s a fine balance between managing pests effectively and economically and minimizing the effects of pesticides on pollinators. Impact on pollinators is a major consideration for the registration of pesticides.

    Not all pesticides are toxic to honeybees.

    Not a honeybee, but a great photo of a pollinator on a spray boom near some nozzles. Too good not to use.

    Growers use IPM practices which means that they are spraying only when necessary (monitoring for pest levels) rather than following a calendar-based program. Because each droplet of spray that does not land on the target (the crop) is wasted money, growers are more conscious of drift and are using technology to reduce off-target drift.

    The Ontario Bees Act states “No person shall spray or dust fruit trees during the period within which the trees are in bloom with a mixture containing any poisonous substance injurious to bees unless almost all the blossoms have fallen from the trees.” While some crops, like grapes and peaches, do not rely on insects for pollination, bees may still visit their flowers and they are still present in vineyards and orchards before and after bloom, foraging for nectar and pollen on flowering plants in row middles and surrounding vegetation areas. We have been promoting row middle management with flowering plants to encourage the presence of beneficial insects. Honey bees are also attracted to these plants. For this reason, it’s important to recognize that sprays applied to manage pests may have adverse effects on honey bees as well.

    One of the most important things to do is to maintain communication between growers/custom operators and beekeepers. While it’s common sense to not allow insecticides to drift directly onto bee hives, bees will usually forage up to 3 km from a hive and when food sources are scarce, they are known to fly as far as 12 km (8 miles) (Download reference).

    BeeConnected is an app connecting registered beekeepers with registered farmers and spray contractors, enabling anonymous communication on the location of hives and crop protection product activities. The app is available free of charge through a web browser, the Apple App Store and Google Play.

    Here are a few others things you can do:

    Read the pesticide label:

    Carefully follow listed precautions with regard to bee safety. In some cases a product may not be used while bees are actively foraging.

    Product selection:

    Pesticides (insecticides and fungicides) are not all equally toxic to honey bees. It is also important to be familiar with the relative toxicity of pest control products to bees. In Publication 360, Fruit Crop Protection Guide, the relative honeybee toxicity is now listed in the fungicide and insecticide activity tables of each chapter. The impact of products that are moderately toxic to bees can be can be minimized if dosage, timing and method of application are correct. Highly toxic products may cause severe losses if used when bees are present at treatment time or within a few days thereafter.

    Choose the least hazardous insecticide formulation. Emulsifiable formulations normally have a shorter residual toxicity to bees than wettable powders and flowables which, in addition to having residual characteristics can be more easily picked up from the flowering plant while bees are gathering pollen.

    Spray timing:

    Whenever possible, apply products with toxicity to bees in late evening, night or early morning while bees are not foraging (generally between 8 p.m. and 8 a.m.). Evening applications are less hazardous to bees than early morning applications. Warm days and nights can extend the foraging period; therefore applications may be necessary later in the evening or earlier in the morning under unusually warm conditions. Do not apply insecticides when cool temperatures are expected after treatment. Residues will remain toxic to bees for a much longer time under cool conditions. Do not apply insecticides that are toxic to bees on crops in bloom, including crops containing weeds or cover crops in bloom. Avoid treating during hot evenings if beehives are very close to the target field and honey bees are clustered on the outside of the hives.

    Remove alternate pollen sources:

    Where feasible, eliminate weeds or flowers in row middles by mowing at least 2 days before a pesticide with toxicity to bees is to be applied.

    Minimize off-target drift:

    Drift of spray applications can cause significant bee poisoning problems, particularly when drift reaches colonies or adjacent flowering weeds. In general, sprays should not be applied if wind speed exceeds 10 mph and favors drift towards colonies. Give careful attention to position of bee colonies relative to wind speed and direction. Ensure that there are no colonies directly in the orchard at the time of spray. Select drift-reducing spray nozzle technology, whenever possible. Since fine droplets tend to drift farther, apply spray at lower pressures or choose low-drift nozzles that reduce drift by producing a medium to coarse droplet size.

    Calibrate spray equipment often. Air-blast sprayers can produce finer droplets with greater drift potential. When using an air-blast sprayer, consider redirecting or turning off nozzles, or use technologies that reduce drift (for example, towers, multirow, tunnel and target-sensing sprayers). Shut off sprayer when making turns at field ends or gardens, near large puddles, ponds and other sources of water that may be used by pollinators and other wildlife.

    There is a precaution to nighttime spraying: you must be aware of inversions. When you spray during an inversion, the larger drops fall quickly (per normal), but smaller lighter droplets fall very slowly (a few centimetres per second). They do not disperse. Instead, they move with the air they were released into, evaporating very slowly, over great distances. These small particles, as well as vapours from volatilizing products, are capable of moving for kilometers and are therefore subject to drift.

    The only sure way to know if you are in an inversion is to take two air temperature readings: the first about 10 cm from the ground, and the second about three metres off the ground. If the surface air temperature is cooler, you are in an inversion. The magnitude of the difference indicates how strong the inversion is. Accurate measurements are difficult to manage with conventional thermometers (Although the new Spot-On Inversion Detector makes it possible). It is generally easier for sprayer operators to watch for the following cues:

    • Large temperature swings between daytime and the previous night.
    • Calm (e.g. less than 3 km/h wind) and clear conditions when the sun is low.
    • Intense high pressure systems (usually associated with clear skies) and low humidity where you intend to spray.
    • Dew or frost indicating cooler air near the ground (fog may be too late).
    • Smoke or dust hanging in the air or moving laterally.
    • Odours travelling large distances and seeming more intense.
    • Daytime cumulus clouds collapse toward the evening.
    • Overnight cloud cover is 25% or less.

    If you suspect a strong inversion, don’t spray. Postpone the application if possible.

    Reducing pesticide injury to honey bees requires communication and cooperation between beekeepers and growers and applicators. It is important that beekeepers understand cropping practices and pest management practices used by farmers in the vicinity of their apiaries. Likewise, pesticide applicators should be sensitive to locations of apiaries, obtain a basic understanding of honey bee behavior, and learn which materials and application practices are the most hazardous to bees.

    Furthermore a number of native pollinators such as bumblebees, leaf cutter bees, sweat bees and squash bees are also important pollinators in some crops and they too require consideration. While it is unlikely that all poisonings can be avoided, a balance must be struck between the effective use of insecticides, the preservation of pollinators and the rights of all — the beekeeper, farmer and applicator.

  • Airblast Towers are Worth Considering

    Airblast Towers are Worth Considering

    Are you considering shelling out for a tower extension for your airblast sprayer? Spray towers are an excellent investment, but they warrant special consideration. Towers move the air and nozzles closer to the target compared to the curved booms on a conventional airblast sprayer. When the distance-to-target is reduced, the odds of droplets reaching the target are improved. That means less pesticide drift and more deposit in the plant canopy.

    Be Aware: Nozzles need a minimal distance from the target to create an optimal spray pattern, so do not get too close.

    Many growers report savings when switching from conventional airblast to towers. The towers are more efficient at depositing the spray, so they have to reduce their typical sprayer volumes to prevent run-off. We worked with one apple grower that switched from a conventional sprayer to one with a tower. His lake-side orchard was plagued by wind, and his conventional sprayer had a relatively small fan diameter (~2 feet) that couldn’t compete. Traditionally, the grower used higher spray volumes to compensate. His new tower sprayer had a larger fan (~3 foot diameter) but perhaps equally import was that the tower reduced the distance-to-target. As a result, he was able to reduce his spray output by more than 200 L/ha while improving his overall coverage! That represented considerable cost savings and reduced environmental impact.

    Towers may provide better coverage than conventional sprayers in orchards with horizontal scaffolding. The tower sprays between branches, penetrating more easily, while the conventional sprayer has to spray through them. Concept from K. Blagborne, British Columbia.
    Towers may provide better coverage than conventional sprayers in orchards with horizontal scaffolding. The tower sprays between branches, penetrating more easily, while the conventional sprayer has to spray through them. Concept from K. Blagborne, British Columbia.

    While there are many benefits associated with towers, they are not suitable for all situations:

    • Towers must be taller than the highest target (e.g. treetop)
    • Towers should be used on level ground. Towers will roll on the vertical axis (i.e. tip left and right) on uneven ground, potentially missing or over-shooting targets
    • Towers must be able to clear netting, trellises, or an overhanging canopy.
    The perils of towers on uneven ground. For towers to be effective, the tower must be at least as tall as the target. When the target is only slightly higher than the tower, some sprayer operators install an additional nozzle body on the top deflector plate to extend the reach.
    The perils of towers on uneven ground. For towers to be effective, the tower must be at least as tall as the target. When the target is only slightly higher than the tower, some sprayer operators install an additional nozzle body on the top deflector plate to extend the reach.
    A home-grown airblast sprayer with tower. PVC ducts, sheets of plastic, a squirrel cage blower and grower ingenuity. While it looks suspect, and difficult to clean, it reputedly works very well in highbush blueberries.
    A home-grown airblast sprayer with tower. PVC ducts, sheets of plastic, a squirrel cage blower and grower ingenuity. While it looks suspect, and difficult to clean, it reputedly works very well in highbush blueberries.

    Occasionally, we have discovered areas along tower outlets where there is reduced air flow. You can usually feel these “dead zones” with your hand (beware flying debris), but it’s better to observe short ribbons attached to the nozzle bodies as described in our articles about adjusting air direction and speed/volume. In low fan gear, watch to see if any ribbons flag or appear slack from a lack of air, you can “borrow” air by re-positioning neighbouring deflectors. If that’s not possible, try replacing the conventional nozzles in the dead zone with air induction nozzles; coverage should improve in that zone because pressure propels coarser droplets further than finer droplets. We’ve seen significant improvements using this technique in high density orchards.

    In the end, if a tower will fit in our operation, we suggest it’s a worthwhile investment that will make coverage more consistent, reduce off-target drift and possibly reduce the volume of spray needed per hectare.

    Towers come in many shapes and sizes. Orchards aren’t the only good fit for towers; grapes, bushes and canes can also benefit from small towers.
    Towers come in many shapes and sizes. Orchards aren’t the only good fit for towers; grapes, bushes and canes can also benefit from small towers.
  • Spray Drift – Why is it still happening?

    Spray Drift – Why is it still happening?

    Despite the abundance of information available on spray drift, we continue to see widespread incidents of damage to a variety of crops every year. Do applicators just not care or are they missing some vital information when making decisions to spray? I believe it is the latter.

    What is the problem?

    In my experience, the vast majority of spray drift cases (probably 90% or more) are the result of ‘inversion drift’. That means the drift has not come from an adjacent sprayed area, it has come from one or more sources that are some distance from the site of damage. The distance between the sprayed site and the location of the damage may vary dramatically, from a few kilometres to tens of kilometres.

    Why is there so much inversion drift when labels specifically prohibit use of the products under surface temperature inversions? Many may argue that it is a blatant disregard of the label by a few applicators (translation = cowboy operators). I do not agree this is the main problem. While I can confirm the existence of ‘cowboy operators’, thankfully they are limited in number. I believe the problem is a lack of understanding about how to tell when there is an inversion and particularly not knowing how ‘day wind’ moves differently to ‘inversion wind’. I continue to see good farmers/applicators doing what they believe to be the right thing but it is not. These are people very concerned about minimizing spray drift; they honestly do not think they are doing anything wrong.

    What is ‘day wind’?

    After sunrise, the sun begins to heat the ground, the warm ground then heats the air close to the surface, and this air then rises. As that warm air rises, cold air from above sinks down to replace it. The ground then warms this cold air and it rises. This cycling of warm air rising and cold air sinking creates turbulence and then wind. This is a good thing; turbulent wind movement is much safer for spraying. ‘Day wind’ has a turbulent motion and is much more likely to pull any fine droplets to the ground within a reasonable distance. During the day, we can predict which direction and how far our fine droplets will travel.

    What is ‘inversion wind’?

    As the sun sets, the ground begins to cool quickly and this in turn cools the air next to the ground. As we all know, cold air does not rise and warm air does not sink. This means there is a layer of cold air trapped close to the surface and a layer of warm air above it. The result is no turbulent movement or mixing of the air. The air may become quite still and this is often observed around sunset when the daytime wind ceases or drops off. What happens next is where the real danger occurs for spraying.

    As the night progresses and the ground cools more, the cool air close to the surface becomes colder and therefore more dense, particularly from midnight onwards. This cold dense air then begins to move across the landscape, often down slope and in very unpredictable directions. Remember this air is not turbulent, there is no mixing, it has layers of air, something like layers in plywood, and it flows parallel to the ground. Any fine droplets released into these layers of cold non-turbulent air will simply move sideways across the surface until the sun rises and heats the ground again. This is when the fine droplets are released from the layers and they come to ground, often in the lower parts of the catchment and a long way from the site of application. It is impossible to predict what direction this ‘inversion wind’ will go. For this reason, spraying in this type of wind is extremely high risk for spray drift.

    Key indicators that and inversion is unlikely

    • We should always expect that a surface temperature inversion has formed at sunset and will persist until sometime after sunrise unless we have one or more of the following: continuous overcast weather, with low and heavy cloud;
    • continuous rain;
    • wind speed remains consistently above 11km/h for the whole time between sunset and sunrise;
    • and after a clear night, cumulus clouds begin to form.

     Inversion wind movement – practical demonstration video

    Wind is a key factor in any spray application. The problem is that not all wind is the same. To reduce the incidence of spray drift, it is critical that spray applicators understand how wind moves, particularly during a surface temperature inversion. This video uses smoke flares to visually demonstrate the air movement under inversion conditions.

    Here’s what we’re looking for: moderate wind with consistent direction that disperses spray and drives it to ground.

    Conclusion

    Many factors affect the potential for spray to drift but the main ones are; the weather conditions at the time of application, nozzle selection, products/tank mix used, actual spray quality achieved, speed of rig, and boom height. The common denominator is that all of these things are within the control of the spray operator.

    Spraying under inversion conditions is extremely high risk and prohibited on many product labels, that means it is illegal. If you are serious about preventing drift, then you must learn how to identify when an inversion is likely to be present and more importantly when it has broken.

    All agricultural chemicals have the potential to drift; it is how we use them that increases or decreases that potential. Therefore, the problem is a human one, not a chemical one. There is a suite of information available but if you are still unsure or need any assistance, please seek advice from an expert. Maintaining long-term access to key products depends on us reducing spray drift.

  • Evaluating an Anti-Drift Adjuvant in an Airblast Sprayer

    Evaluating an Anti-Drift Adjuvant in an Airblast Sprayer

    Most pesticides are either pre-formulated with the required adjuvants, or the label specifies their addition. However, compelling claims by manufacturers create interest in tank mixing additional adjuvants to improve some aspect of pesticide performance. In a previous article we advised caution when using adjuvants in airblast sprayers (see here). Specifically, we stated that unless an adjuvant has been tested with airblast equipment, do not assume it will perform as it does in a boom sprayer. In the last year, we’ve received a lot of questions about anti-drift adjuvants, so we decided to test one of the more popular products.

    2016_orchard_spraying

    The Adjuvant

    According to the manufacturer, InterLock is a vegetable oil-based adjuvant intended to improve deposition, canopy penetration and drift reduction from both aerial and ground applications. Independent research has validated its ability to reduce the population of Finer droplets produced by a nozzle without shifting the entire droplet spectrum into a Coarser category. As such, InterLock is used extensively in aerial and field sprayer applications, but we wanted to explore its fit in airblast applications.

    There are fundamental differences in how an airblast sprayer functions compared to a field sprayer. An airblast sprayer operates at pressures considerably higher than field sprayers, and many use paddle agitation to churn tank mixes. Further, droplets are entrained by air and can be carried several meters before reaching their target. So, does the collective impact of paddle agitation, droplet shear and the increased opportunity for evaporation affect the adjuvants performance?

    The Trials

    Water sensitive cards were distributed throughout target trees in an apple orchard. We elected to use two models of airblast sprayer to eliminate the chance of sprayer-specific results. Both models applied either water or water-and-adjuvant. So, the four treatments were:

    Hol Sprayer: Water
    Hol Sprayer: Water-and-Adjuvant
    Turbomist: Water
    Turbomist: Water-and-Adjuvant

    Weather Conditions

    On the afternoon of May 30, 2016, the crosswind was 6-11 kmh (3.7-6.8 mph), the temperature was 27 ˚C (80.5 ˚F), and the relative humidity was ~50%. While warm, conditions were reasonable for spraying.

    Orchard and Targets

    We worked in high-density Honeycrisp apples planted in 2008 on M.26 rootstock. Row spacing was 5 m (16’), average canopy width was 1.2 m (4’) and average height was 3.3 m (11’). Water sensitive cards were located at the top, middle and bottom of each target tree, close to trunk. In each location, the cards were placed back-to-back with sensitive sides facing the alleys.

    We placed cards in two trees in the same row, and the sprayer passed down both sides to complete the application. We performed this twice per treatment. That’s four trees per treatment representing a total of 24 cards (comprised of eight per position).

    Sprayers

    As previously mentioned, we used two models of airblast sprayer. In both designs, nozzle bodies are outside the airstream, causing additional shear as nozzles spray into the air on an angle.

    A Hol sprayer with tower operated at 9.6 bar (140 psi) and driven at 5.6 kmh (3.5 mph). The sprayer was calibrated and spray was distributed to match the canopy. Nozzles were TeeJet AITX 8004s and TXR 80015’s spraying 10.2 l/min. (2.7 gpm) per side for a total rate of approximately 500 l/ha (53.5 gpa).

    A Turbomist with tower was operated at 11.7 bar (170 psi) and driven at 5.6 kmh (3.5 mph). The sprayer was calibrated and spray was distributed to match the canopy. Nozzles were TeeJet AITX 8004s and TXR 8002’s spraying 10.6 l/min. (2.8 gpm) per side for a total rate of approximately 500 l/ha (53.5 gpa).

    2016_hol_turbo_interlock

    Spray mix

    Sprayers were filled with water for the control trials, and then dosed with the equivalent of 250 ml per 500 L (8.5 oz in 132 US gal.) of spray mix, per manufacturer’s recommendation. We ensured lines were primed and sprayer was up to speed before spraying.

    Analysis

    Water sensitive cards were scanned and digitized to compare coverage and median droplet size using DepositScan software (created by Dr. Heping Zhu, USDA ARS, Ohio). Water sensitive cards have a limitation when quantifying average droplet size: once a card exceeds about 30% coverage, too many droplets overlap and their combined profile is wrongly counted as a single droplet. This can skew droplet size analysis.

    For the sake of an accurate comparison, we selected subsets of the overall data; we analyzed only those cards with 40% coverage or less, then refined our comparison to those cards with 30% or less, and finally cards with 20% or less. In each subset, the data remained fairly robust because they included at least one card from each canopy position (i.e. top, middle, low) and three from each treatment.

    In the following tables, the range of droplet sizes is represented by DV0.1, DV0.5 and DV0.9 in µm. Basically, this is the span of droplet diameters from the smallest 10%, to the median to largest 10% in microns. The standard error of the mean and the number of papers are also indicated.

    Data subset 1: Cards with 40% coverage or less

    Avg. DV0.1 (µm) ±SEMAvg. DV0.5 (µm) ±SEMAvg. DV0.9 (µm) ±SEM
    HolAdjuvant: 255±33 (n=8)
    Water: 254±24 (n=12)
    Adjuvant: 664±137 (n=8)
    Water: 736±114 (n=12)
    Adjuvant: 1,175±223 (n=8)
    Water: 1,391±204 (n=12)
    TurbomistAdjuvant: 252±38 (n=8)
    Water: 258±31 (n=9)
    Adjuvant: 545±86 (n=8)
    Water: 697±141 (n=9)
    Adjuvant: 964±168 (n=8)
    Water: 1,175±237 (n=9)

    Data subset 2: Cards with 30% coverage or less

    Avg. DV0.1 (µm) ±SEMAvg. DV0.5 (µm) ±SEMAvg. DV0.9 (µm) ±SEM
    HolAdjuvant: 221±30 (n=6)
    Water: 189±22 (n=6)
    Adjuvant: 553±127 (n=6)
    Water: 495±118 (n=6)
    Adjuvant: 1,007±245 (n=6)
    Water: 969±235 (n=6)
    TurbomistAdjuvant: 240±42 (n=7)
    Water: 192±22 (n=5)
    Adjuvant: 502±86 (n=7)
    Water: 433±89 (n=5)
    Adjuvant: 912±184 (n=7)
    Water: 759±187 (n=5)

    Data subset 3: Cards with 20% coverage or less

    Avg. DV0.1 (µm) ±SEMAvg. DV0.5 (µm) ±SEMAvg. DV0.9 (µm) ±SEM
    HolAdjuvant: 163±19  (n=3)
    Water: 172±28 (n=4)
    Adjuvant: 371±107 (n=3)
    Water: 472±176 (n=4)
    Adjuvant: 617±137 (n=3)
    Water: 904±315 (n=4)
    TurbomistAdjuvant: 240±78 (n=4)
    Water: 192±22 (n=5
    Adjuvant: 439±140 (n=4)
    Water: 433±89 (n=5)
    Adjuvant: 691±189 (n=4)
    Water: 759±187 (n=5)

    Conclusions

    In the first subset (i.e. 40% coverage or less) there was no trend to suggest the sprayer model made any difference in coverage. Nor did there appear to be any change in the droplet spectra produced by water or water-plus-adjuvant. In particular, there was no apparent increase in the DV0.1 when adjuvant was used, which we would expect to see if the Finest droplets produced by the nozzle were made Coarser. We hoped that by further subdividing the data to cards with 30% coverage or less, and then 20% coverage or less might resolve some trend, but there were no significant differences to speak of.

    These trials are not drift studies, so we cannot say that the adjuvant has or doesn’t have an effect on particle drift. However, according to the water sensitive cards, there is no apparent impact on droplet size or deposition. This suggests that some property of airblast application has reduced or negated the benefit of using the adjuvant. As such, the use of InterLock in an airblast sprayer cannot be recommended. It supports our position that unless an adjuvant has been tested with airblast equipment, you should not assume it will perform as it does in a boom sprayer.

    Thanks to Winfield for the educational donation of InterLock, to TeeJet for the nozzles and to Provide Agro for use of the Hol sprayer. Special thanks to Donald Murdoch of the University of Guelph for operating the sprayers.