Category: Drift

Hort articles about spray drift and mitigation.

  • The Label Summary Sheet Proposal

    The Label Summary Sheet Proposal

    We’ve identified and discussed shortcomings in the content and design of today’s pesticide labels in an earlier article. From the perspective of the spray applicator, the information needed most often can be difficult to locate, anachronistic, contradictory, subjective or even missing from the label altogether. To truly encourage an applicator to read and follow the label we need a consistent, concise and clear format that summarizes critical content.

    To that end, we have worked with growers, university/government extension and industry to develop a prototype we’re calling the “Label Summary Sheet”, or LSS for short. We presented the concept in a series of public presentations in western Canada as part of the RealAgriculture TechTour Live event in 2018. You can watch a recording of part of that event at the end of this article.

    The LSS does not replace or interpret the current label, which is a legal document. It is a summary intended to accompany it. At this stage the LSS is simply a proposal. These documents are not intended for use right now; we hope they will grow and change for the better as they stimulate discussion.

    Consider this metaphor: You have just purchased a laptop. When you unbox it, you get an in-depth instruction guide that covers everything from operation to trouble shooting and includes all the legal riders. It’s a daunting technical document that you likely won’t read unless something goes wrong. Knowing that, manufacturers include a graphic and accessible quick start-up guide that summarizes the most common and critical issues. It doesn’t replace the instruction manual, it just augments it. If you can’t find what you need in the quick start-up guide, you are referred to the more fulsome description in the instruction manual. Think of the pesticide label as the instruction manual and the LSS as the quick start-up guide.

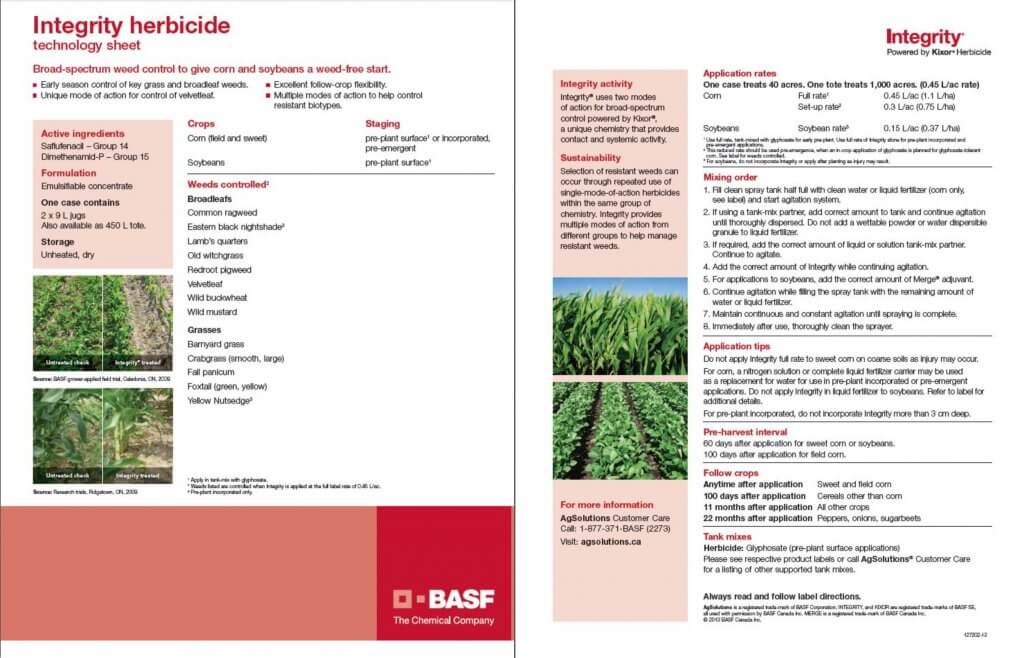
    Some agrichemcial companies recognize this need and have developed short documents to summarize key aspects of the label, but they are inconsistent and brand-specific marketing documents that do not always contain the information we are proposing. Here, for example, is the technology sheet for Integrity herbicide.

    We tested the versatility of our LSS format by summarizing four diverse pesticide labels. Our selections are not intended to imply that these labels are particularly deficient. Only that they are commonly used, somewhat complicated and represent the spectrum of pesticide categories and application methods.

    Download and look at the variety of labels we have summarized as examples. They are available here:

    • Pristine (LSS: 3 pages. Pesticide Label: 25 pages)
    • Dual II Magnum (LSS: 3 pages. Pesticide Label: 38 pages)
    • Liberty 150 (LSS: 2 pages. Pesticide Label 20 pages)
    • Traxos (LSS: 2 pages. Pesticide Label: 12 pages)

    Note that each LSS features the same section headings and a relatively consistent layout, no matter the manufacturer. Generic icons are used to illustrate content and make it easier for users to navigate without language barriers. The LSS are black and white to facilitate reproduction and refer back to their respective pesticide labels (i.e. the online PDF, not the booklets that come with the pesticides).

    LSS Sections

    Here is the Pristine LSS broken down by section to highlight the key features.

    1. Banner Section

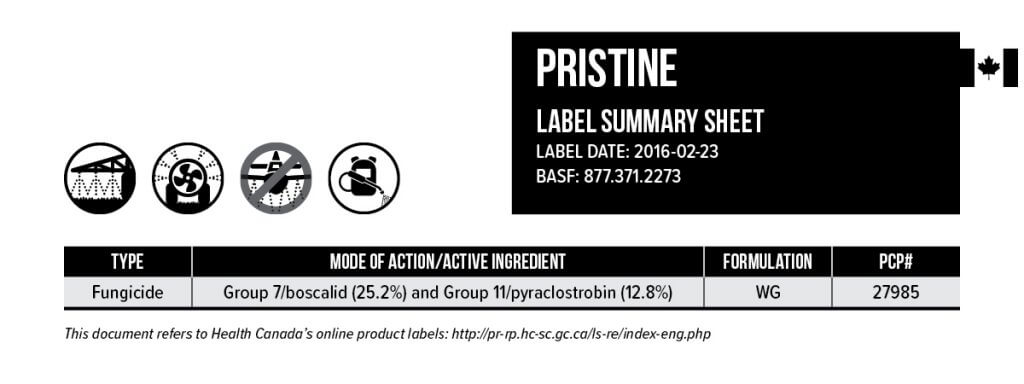
    The banner is at the top of every LSS. It gives the commercial product name and the date to ensure the LSS reflects the current pesticide label. Four icons represent the most common application technologies: Horizontal boom sprayer, airblast, aerial and handheld. If an application method is prohibited, a banned symbol appears (such as aerial in this case). Note we have left room for RPAAS (UAV’s) anticipating the day we have products registered for that technology. The table notes the type of pesticide (e.g. fungicide, insecticide, adjuvant, etc.). The mode of action and active ingredient(s) are noted, as well as the formulation and the Pest Control Product number.

    2. Resistance Management / Planting Restrictions

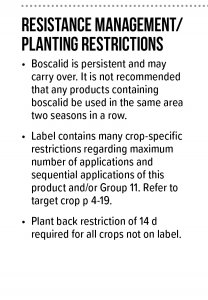
    Intended to provide key information on managing pesticide resistance, this section reflects label content about carry over and the rotation of active ingredients. Further, to aid in application decisions, it reflects any restrictions around maximum number of applications, sequential applications or plant back issues following use.

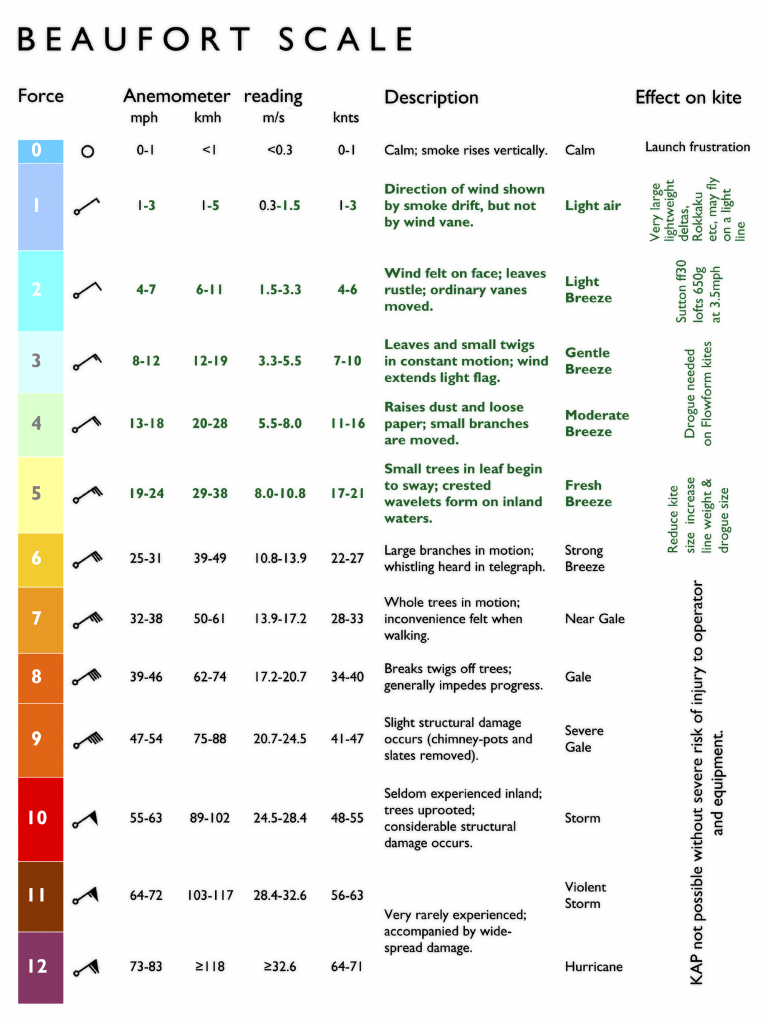
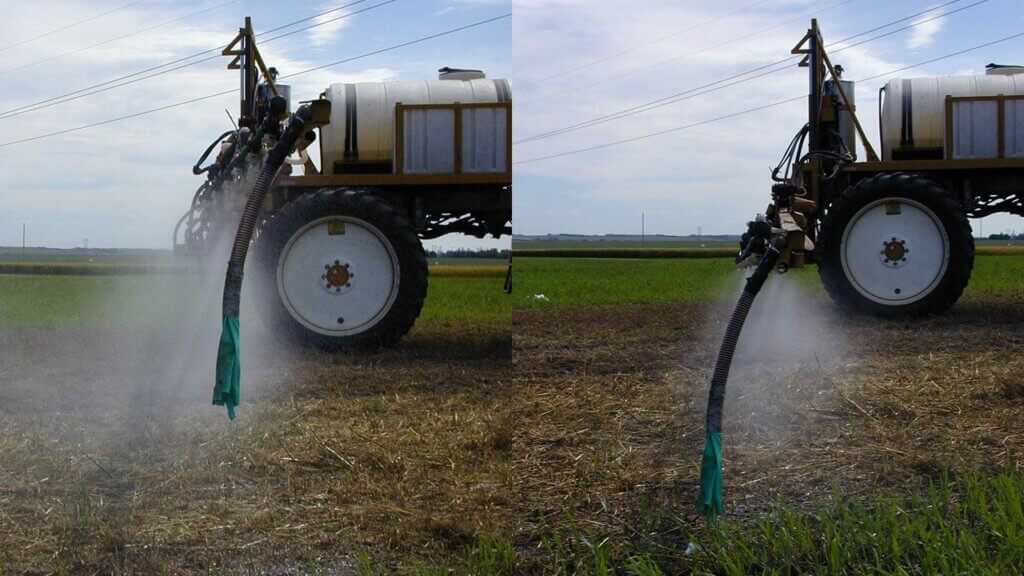
    3. Environmental Conditions


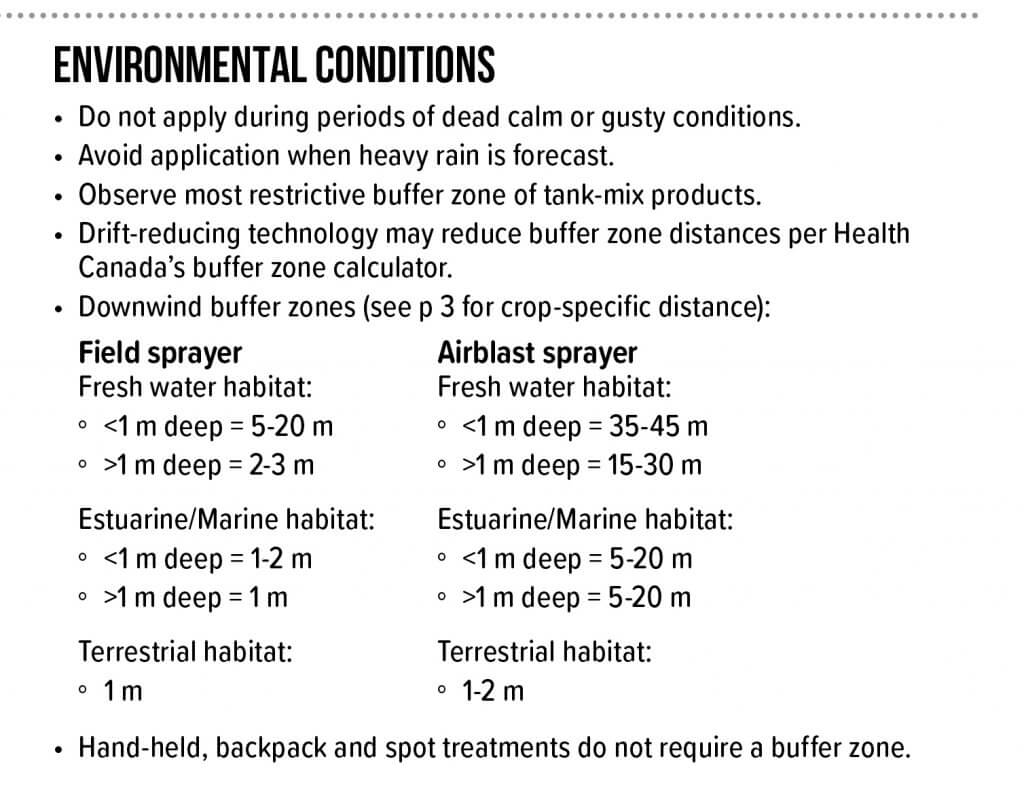
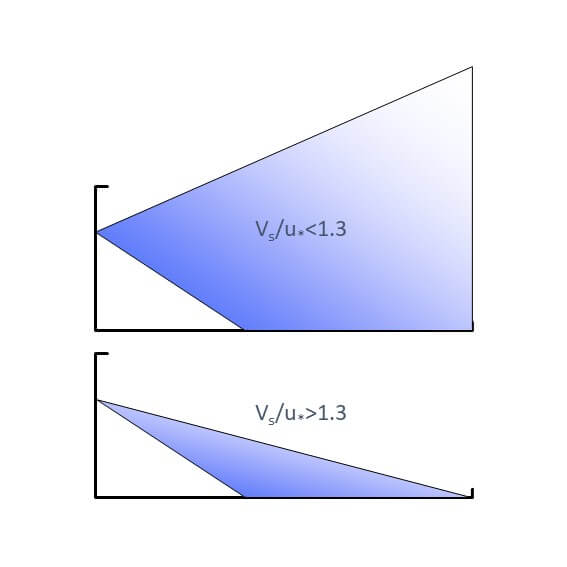
    Any restrictions regarding weather conditions during or after application are noted here. This includes set-backs or buffer zones that reflect method of application and the nature of the adjacent or downwind area in question.
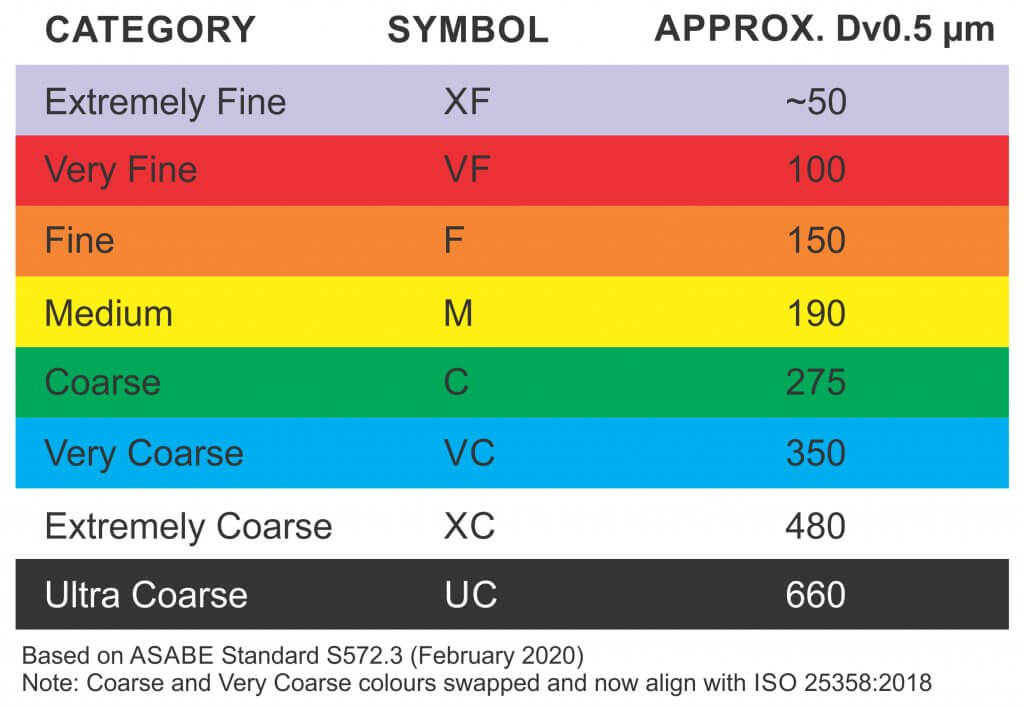
    4. Sprayer Settings

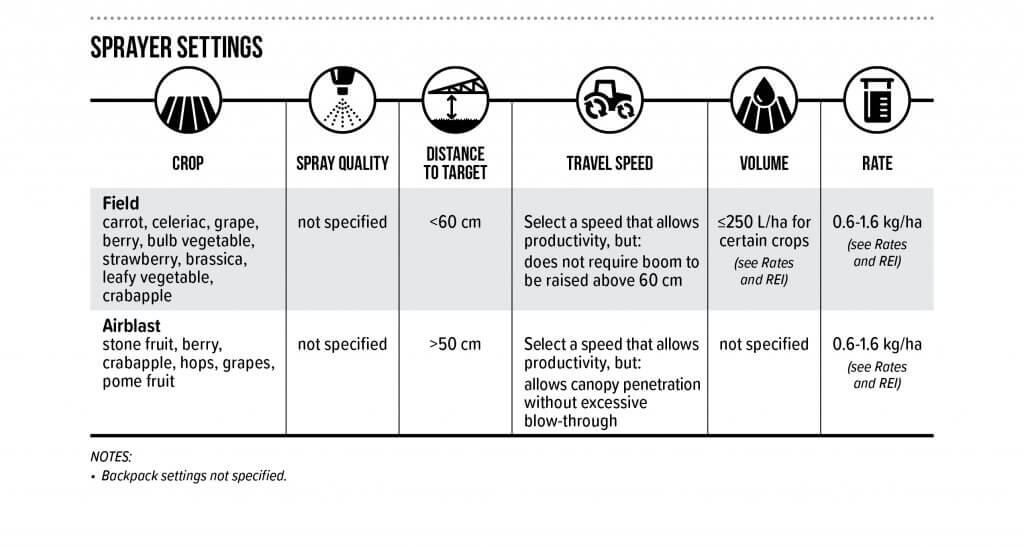
    This section includes the six most commonly asked questions an applicator has when calibrating or adjusting their sprayer prior to use. It is organized by target crop and method of application. When the label provides a high level of detail, the user is referred to the correct page. Note the use of graphics to quickly direct the reader to the information they need. Any additional qualifications found in the label relating to sprayer settings are indicated in the notes beneath the table.

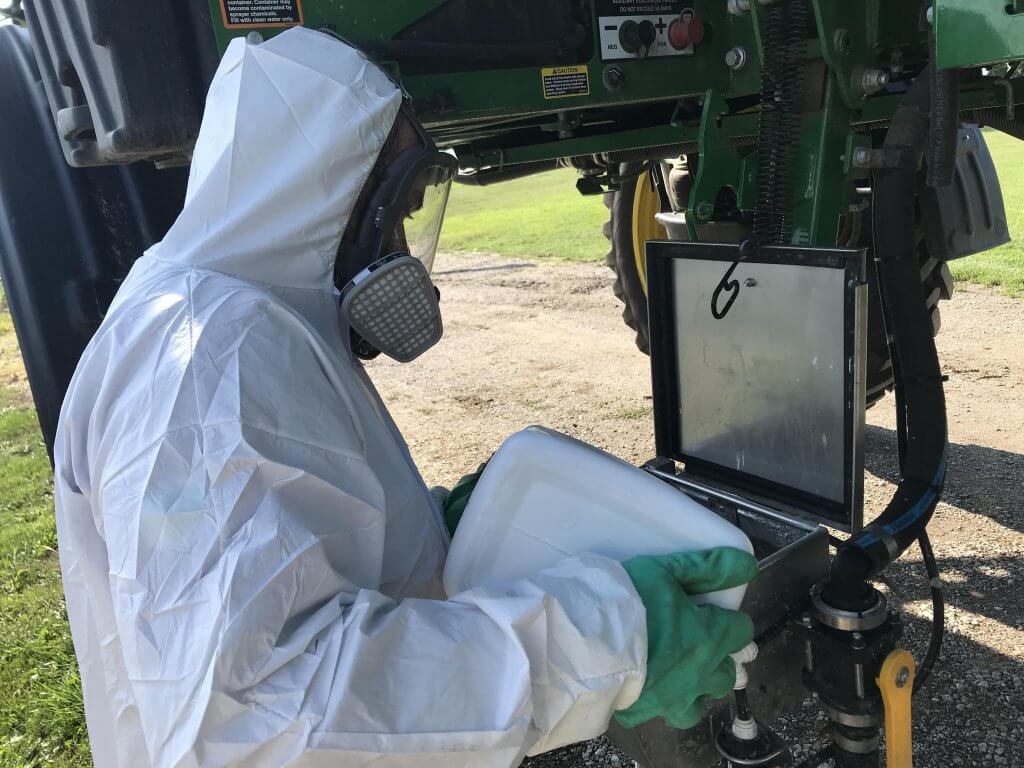
    5. Handling Safety (PPE)

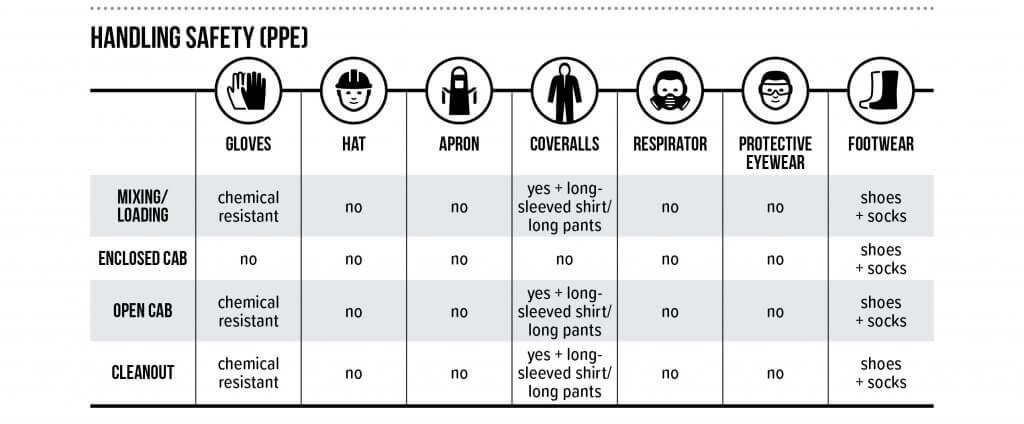
    The concept for this simple and graphic table originated in France, and was communicated to us by Dr. Carol Black of Washington State University. This unambiguous  format encourages the use of PPE while ensuring the handler uses the appropriate level of protection for each activity.
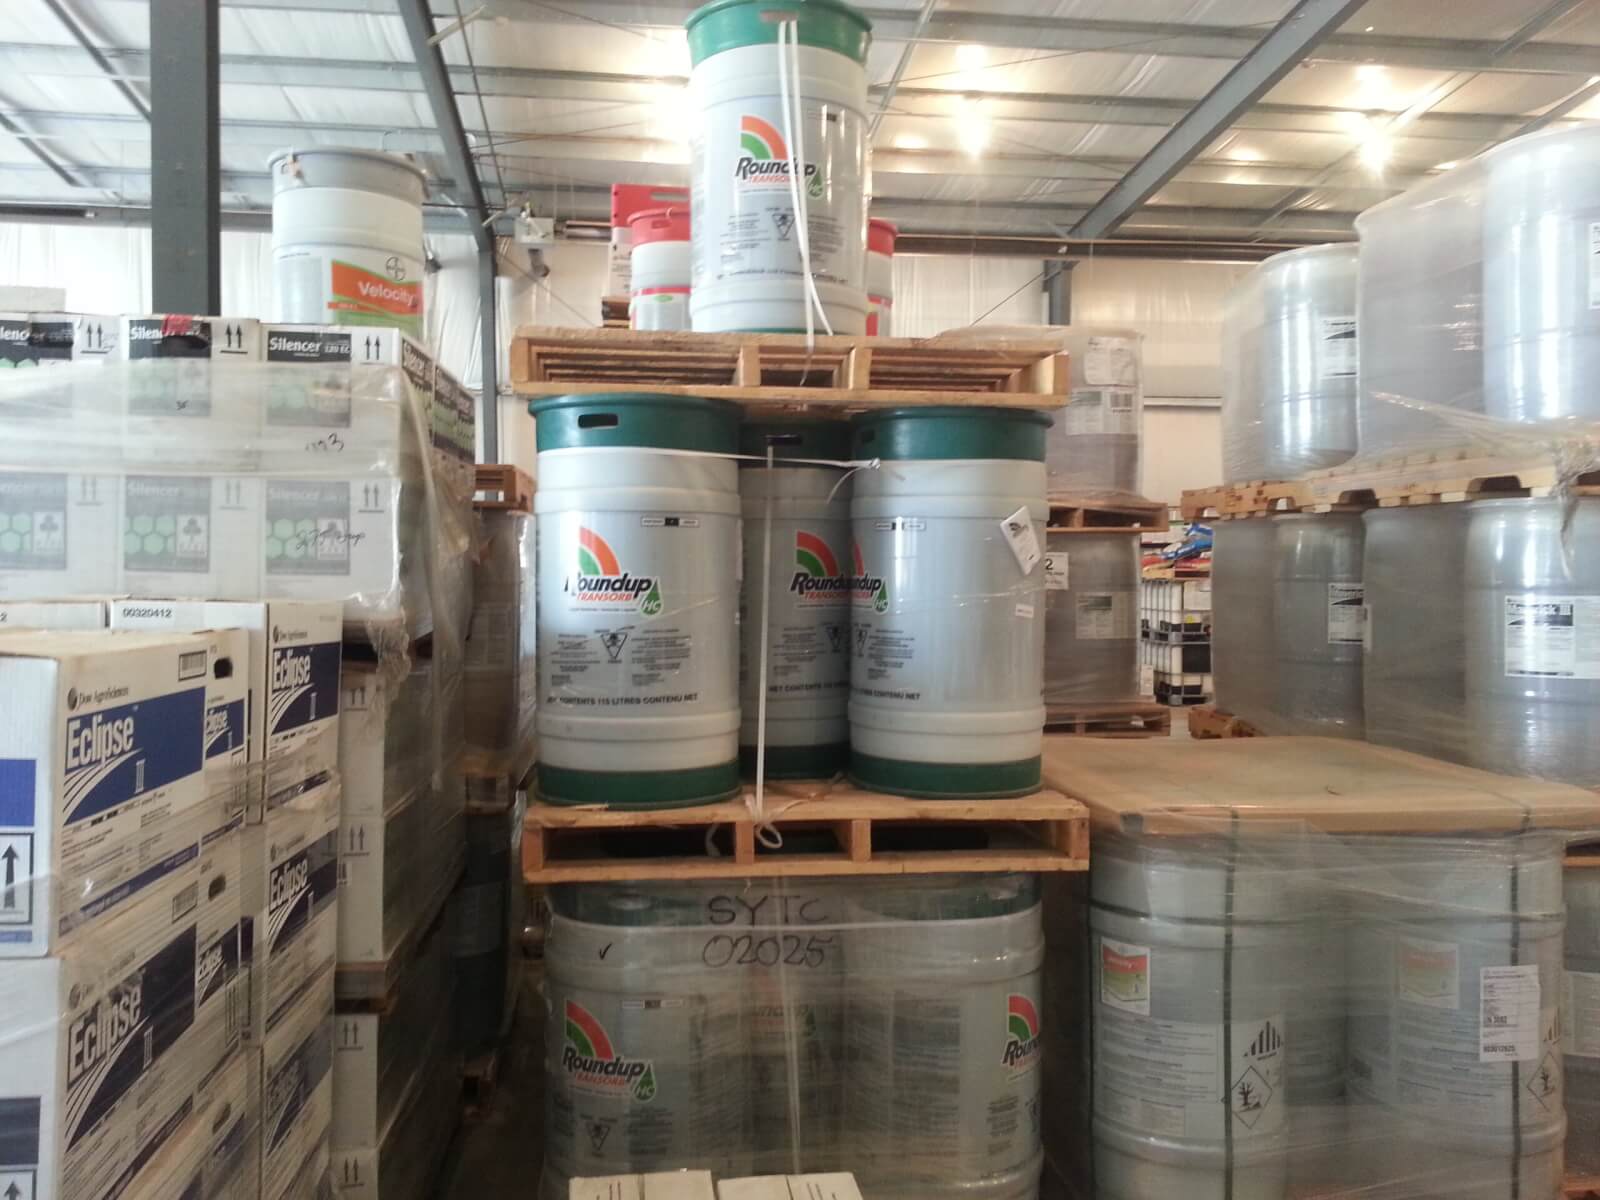
    6. Mixing


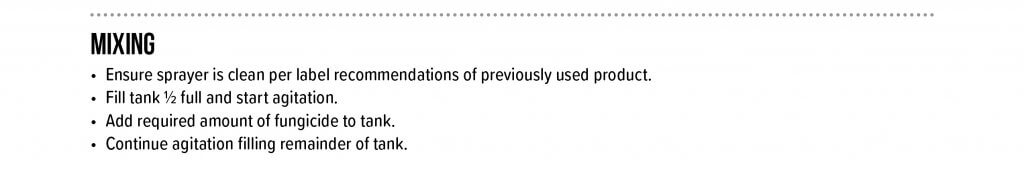
    As operators tank mix more products to curtail resistance, improve efficacy or improve productivity, there is a greater chance of chemical or physical incompatibility. This section summarizes any restrictions noted in the label. Learn more by downloading Purdue Universities’ publication “Avoid Tank Mixing Errors“.

    7. Rates and Restricted Entry Intervals

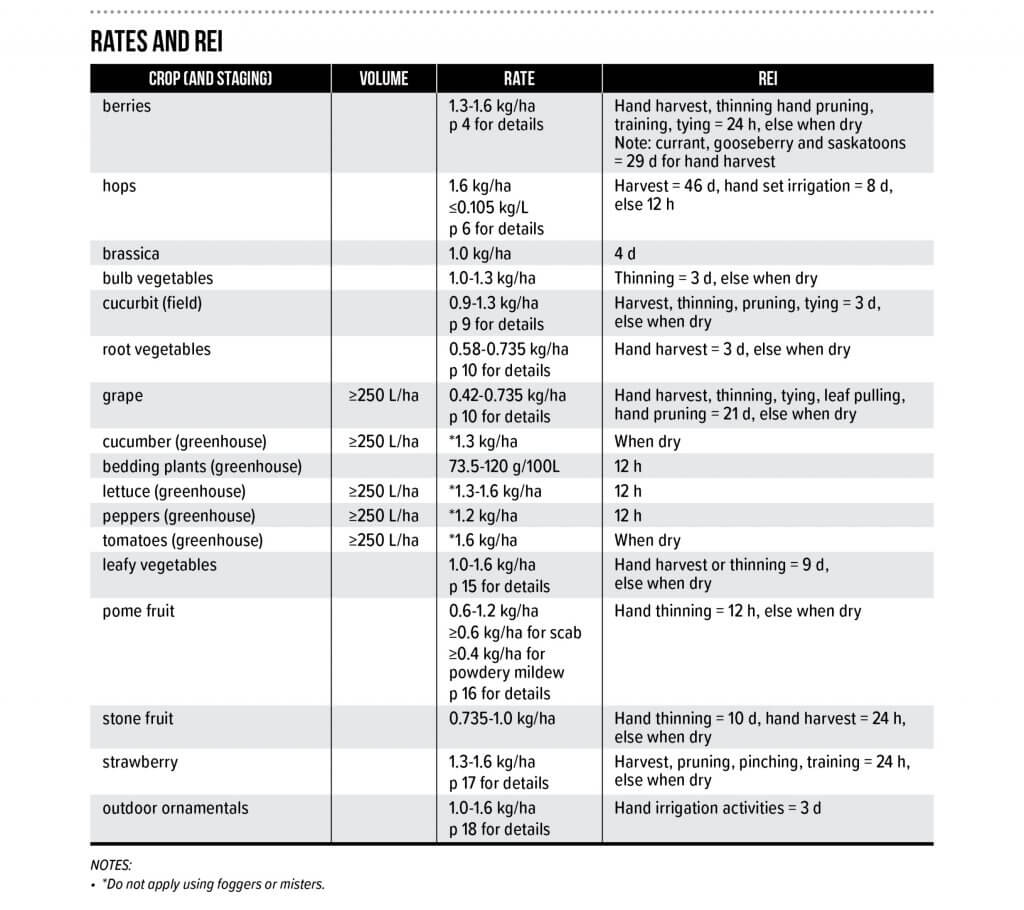
    This table can be quite complicated depending on the pesticide label. It summarizes the rates, volumes and restricted entry intervals by crop. It reflects the broadest range of product rates listed in the label. Restricted entry duration is affected by the post application activity, and this is captured in the REI column. If more detail is required, the user is referred to the appropriate page(s) of the label. Any additional qualifications found in the label relating to rates, volumes or REI are indicated in the notes beneath the table.

    8. Equipment Cleanout

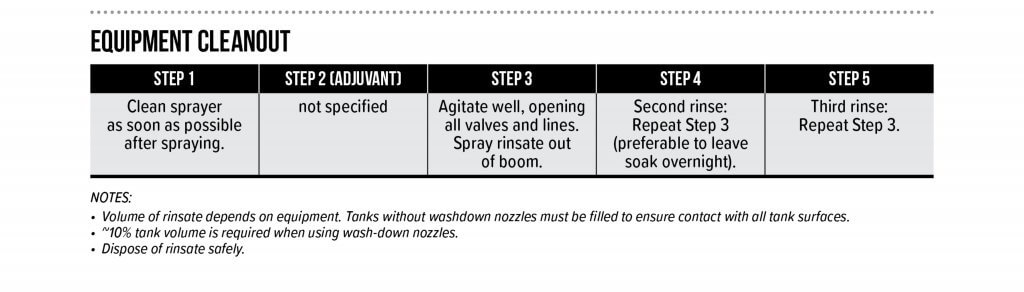
    Finally, equipment cleanout is summarized (where possible) in a sequence of steps. When the pesticide label is silent on the cleanout procedure, the user is provided with the triple rinse protocol, which is generally held to be the industry best-practice.

    Adoption

    To date, this proposal has been made to Croplife Canada, the American Society of Agricultural and Biological Engineers (ASABE), an International Organization for Standardization (ISO) mirror committee (Equipment for crop protection) and more than 1,400 growers and stakeholders across Canada.

    Our suggestion for adoption of the LSS (in its current form or something similar)  is that regulatory agencies commission a working group comprised of representatives from grower groups, industry and government to oversee the process. The working group would support registrants as they populate (or update) the LSS template when a new product is submitted for registration, or as part of the natural review cycle.

    Should the registrant encounter duplicate, missing or contradictory information while completing the LSS, it should be considered an opportunity to remedy the problem on the pesticide label. This will clarify the safest and most effective use of the pesticide for the applicator, who is currently forced to selectively ignore or interpret such errors. To our minds, this was the intent of the original labelling system, and the inclusion of the LSS is a simple and effective way to achieve that goal.

    The Confusicol Sketch

    In 2018 we participated in Real Agriculture’s TechTour Live event that toured four major cities in Western Canada in four days. We presented the “Confusicol sketch” as a light-hearted way to open a discussion with the audience on the strengths and weaknesses of Canadian pesticide labels and how the Label Summary Sheet might be a viable supplement. Here’s one of the live takes, warts and all. Turns out live sketch comedy is tricky…

  • Three Manageable Factors that Affect Spray Drift

    Three Manageable Factors that Affect Spray Drift

    In 2014 one of our OMAFRA summer students designed a short-and-gritty demonstration using a backpack sprayer, a variable-speed fan and some water-sensitive paper positioned downwind at 1.5 metre intervals. The intent was to illustrate how sprayer operators could reduce the potential for off-target drift by recognizing and accounting for three factors:

    • Apparent wind speed (i.e. the sum of wind speed and travel speed)
    • Boom height (i.e. release height)
    • Droplet size (i.e. nozzle spray quality)

    Apparent Wind Speed

    Spray operators know they should not spray when the air is calm or when the wind is too high, but they often forget that the nozzles experience “apparent wind speed” which means driving 10 km/h into a 10 km/h headwind is essentially spraying in a 20 km/h wind.

    The result of spraying with a Medium spray quality in 10 km/h and 15 km/h wind: water-sensitive papers indicated that there is more downwind drift in higher winds.

    Boom Height

    Spray operators raise their booms to ensure their nozzles clear the crops, but this contributes to off target drift and greatly reduces coverage – particularly when using twin-fan style tips. Dr. Tom Wolf explains how to set your boom height here, or you could watch one of our Exploding Sprayer Myths videos on the subject.

    The result of spraying with a Medium spray quality in a 10 km/h wind at 50 cm and 100 cm from the ground: water-sensitive papers indicated that downwind drift increases as the boom gets higher.

    Droplet Size

    The coarser the spray quality, the less likely the spray will drift off target. Remember, for a given volume, shifting to larger droplets means fewer droplets. Application volumes may have to increase to compensate for potentially reduced coverage.

    The result of spraying with a Medium spray quality versus spraying with an Extremely Coarse spray quality: water-sensitive papers indicated that there is more downwind drift from smaller droplets.

    Take-Home

    This demo used percent coverage as a metric, which is convenient but greatly underestimates drift. So even when the spray window is small and the spray has to go on, take a moment to drop the boom, use a coarser droplet size and if it’s too windy, just don’t spray.

    WUR Drift Calculator

    There are many drift calculators available for home use. Some require more expertise than others to get a reliable result. This free downloadable calculator from Wageningen University & Research was made available in 2021. It can quantify spray drift deposits onto surface waters and non-target terrestrial areas near a sprayed field or orchard

    The calculator uses statistically obtained regression curves to calculate spray deposition next to the sprayed field. The spray drift curves are based on the latest experimental data for field crops, fruit orchards and avenue tree nurseries.

    Download your copy here.


  • Ten Tips for Spraying in the Wind

    Ten Tips for Spraying in the Wind

    Choosing the right time to spray can be tricky. Our gut tells us that spraying when it’s windy is wrong.  The experts tell us that spraying when it’s calm is wrong. So when can you actually spray?

    I’ve always advised my clients to spray in some wind, because it has a few advantages. The main one is that wind helps disperse the spray upward and downward, diluting the spray cloud fairly rapidly. Another advantage is that winds tend to be reasonably steady in their direction and velocity (or at least that can be forecast), so downwind areas can be identified and potential impacts are known or predictable. It helps if it’s sunny, because that improves the dispersion of the cloud even more.

    First, let’s define “windy”. The classic wind scale is the Beaufort Scale, intended for the sea, but also used on land. The upper limit for spraying is probably Force 3 or Force 4, with upper limits of 20 – 25 km/h or so.  The Beaufort Scale calls these “Gentle or Moderate Breezes” (they had to save the alarming words for hurricanes), and the scale provides good visual clues such as what wind does to flags, leaves, or dust.

    Beaufort Scale-1

    Spraying under breezy conditions can be done fairly safely if you follow specific steps. The idea is to understand what the risks are and to manage them.

    The cornerstone is to use a low-drift spray and match it to a pesticide that will work well with larger droplets. But there are other important aspects to consider. Below are the top ten to think about:

    • Choose a herbicide that can handle large droplets. Glyphosate products are well suited to coarse droplets. But glyphosate commonly has contact actives in the mix, members of Group 6, 14, and 15, and these are less likely to perform well with big droplets than those that contain Group 2 and 4 mixes. Actives with soil activity also have more tolerance for larger droplets.
    • Use a low-drift nozzle and operate it so it produces a Coarse (C) to Very Coarse (VC) spray quality, as described by the manufacturer. Dicamba labels call for Extremely Coarse (XC) to Ultra-Coarse (UC) sprays, and Enlist requires at least Coarse. To achieve these you may need to purchase new nozzles. Low-pressure air-induced nozzles operated at about 50 – 60 psi will generally be very low-drift, but lower drift models are available. If you need a finer spray, produce it either by increasing the pressure or moving to a finer tip. Do this when the weather improves, for contact modes of action.
    The name, symbol and range of droplet sizes used to describe the median droplet diameter produced by nozzles according to ASABE S572.3
    • Keep your boom low. Lowering the boom ranks as the second-most effective way to reduce drift, after coarser sprays. But there’s a limit. For low-drift sprays, you need at least 100% overlap (more for PWM), which is for the edge of one nozzle pattern to spray into the centre of the adjacent pattern. In other words, the spray pattern should be twice as wide as your nozzle spacing at target height.  For most nozzles, a boom height of close to 20 inches is enough to achieve this overlap. That’s pretty low by current standards from suspended booms on self-propelled sprayers, so being too low for a good pattern will only happen due to boom sway.
    • Maintain reasonably slow travel speeds. These reduce the amount of fine droplets that hang behind the spray boom, reduce turbulence from sprayer wheels, and they also make low booms more practical. An added bonus is less dust generation.
    • Know what’s downwind and what harms it. Survey the fields on all sides of the parcel you’re treating. When you have a choice, avoid spraying fields that have sensitive areas downwind such as water, shelterbelts, pastures, people, etc. If you can’t avoid being upwind of these areas, make sure you check and obey the buffer zone restrictions on the label. These will also give you an idea if the product can cause harm in water or on land, or both.
    • Consider a dicamba tip for special situations, even if you don’t use dicamba. If you’re in a situation where quitting and waiting is a poor option, these tips allow you to finish the job with minimal drift risk and with only slight reductions in product performance due to poor coverage.
    • Use a low-drift adjuvant. Specific products such as Interlock or Valid have been shown to reduce driftable fines (<150 microns) by between 40 – 60%, without adding significant volume in coarser droplets. The response will depend on the nozzle and the tank mix, but can be very noticeable.
    • Study drift and how it forms and moves. It’s about more than wind speed and droplet size. Knowledge in this area can help you work out the best strategies.
    • Invest in productivity. You may not need it every day, but on occasions when you have a small window to avoid bad weather, it pays dividends.
    • If you feel that drift is unavoidable and someone might be impacted by it, talk to those people first. It’s one of the most important things you can do.

    Keeping pesticide sprays on target continues to be one of our top responsibilities.

  • Fundamentals of Spray Drift

    Fundamentals of Spray Drift

    The year 1989 marked my first spray drift trial under the watchful eye of Dr. Raj Grover and John Maybank. We evaluated the performance of several spray shrouds, Flexi-Coil, AgShield, Brandt, and Rogers, and wanted to measure just how effective they were. But in my heart I wasn’t interested in drift. I wanted to study herbicide efficacy. Anyway, I thought, we’ll do this trial and I’m pretty sure we won’t have to revisit the topic.

    It’s now thirty-two years later and spray drift has interwoven itself into all my projects, remains one of the most powerful drivers of regulatory activity, is likely the most visible consequence of poor stewardship, and will stay as one of the dominant creators of public opinion around modern agricultural practice.

    Drift has not gone away. And yet our understanding of it is far from complete.

    Spray drift is defined as the wind-induced movement of the spray cloud away from the treated swath. Droplet drift can occur for all sprays, and it happens within minutes of the spray pass. Its cousin, vapour drift, is limited to active ingredients that are volatile, that is, they can evaporate from dry deposits after application. Vapour drift happens after the spray application is complete and can last several days.

    Droplet Drift

    Droplet drift can be divided into two phases that are separated by about 1 second and that are measured differently. “Initial drift” happens first and refers to the product that leaves the treated area immediately after atomization. It is airborne and can be measured by placing air-samplers (any device that can capture droplets in air) close to the downwind edge of the spray swath.

    Figure 1: Initial vs Secondary drift. Once the drift cloud leaves the treated swath, the relative strengths of turbulence and sedimentation determine the amount that remains airborne and the amount that lands downwind.

    Secondary drift describes the airborne spray cloud that continues to move downwind from the swath edge, where it either remains aloft or deposits on the surface below it. It is typically measured using samplers placed on the ground that capture sedimenting spray droplets. The difference in method is important because it goes to the heart of the problem of understanding spray drift.

    Figure 2: Droplet drift occurs when displacement energy exceeds droplet energy. The droplet’s combination of mass and velocity cannot withstand the energy presented by moving air.

    Initial drift is actually quite easy to understand because its creation is intuitive. The displacement of droplets from the spray plume is a function of balancing two types of energy. The first, droplet energy, is the product of droplet diameter and velocity. The more energy in the droplets, the more difficult they are to displace, and that’s why larger, heavier droplets or fast-moving air assist are useful drift reducing tools.  The second, displacement energy, comes from relative air movement, either from forward travel speed or wind and the associated turbulence. More wind or turbulence means more power to displace.

     Figure 3: Initial drift follows an expected response to greater wind speeds and coarser sprays. Data from a pull-type sprayer travelling 13 km/h with 60 cm boom height.

    Because initial drift is easier to understand, our most common advice for reducing drift is based on maximizing droplet energy and minimizing displacement energy. Lower booms, larger droplets, slower travel speeds, shrouds, or properly implemented air assist all help reduce initial drift. It makes sense that creating less initial drift will also reduce downwind deposition arising from secondary drift.

    Figure 4: Management of initial drift is intuitive. We reduce drift by adding energy to the droplet and by protecting the droplet from exposure to moving air.

    Downwind Deposition

    After leaving the spray swath, the moving secondary drift cloud has two main options. It can deposit or it can remain airborne. Basic physics suggest that all objects eventually fall to the ground, and since smaller objects need more time, they drift further. But when atmospheric turbulence and topography are considered, it’s not quite that simple. These two complicating factors control what proportion of the drift cloud remains airborne, and what proportion deposits.

    Drift trials show that about 20% of the initial drift amount returns to the surface within the first 100 m or so of the sprayer. The rest remains and rises in the atmosphere where it evaporates and gets mixed further.

    Figure 5: The majority of secondary drift remains airborne. Data are for Medium spray quality from a pull-type sprayer with 60 cm boom height and 13 km/h travel speed

    It happens quickly. Just 5 m downwind of the spray swath, the cloud is already 4 m tall. At 100 m downwind, we’ve measured its height to be 30 m.

    The proportion of the spray that remains airborne depends on the spray quality and the nature of the atmosphere. If it’s windy and sunny, or if the spray is finer, turbulence sends more into the air. If it’s cloudy and the wind is low, we have little atmospheric mixing. As a result, a smaller proportion will remain airborne and more will sediment, and overall, we may actually have more potential to damage downwind areas.

    When we graph spray drift deposit data from a windy day, the deposit amount decreases exponentially with downwind distance. Usually, drift damage follows the same pattern. The larger droplets that contain the majority of the dose deposit first. The smaller droplets go further and are more likely to mix in the atmosphere and rise with thermals.

    Figure 6: Deposited drift decreases logarithmically with distance. Top, linear axes. Bottom, log axes.

    Under temperature inversion conditions that are common on calm summer evenings, overnight, and early mornings, the damage from the drift cloud does not decrease the same way. The cloud containing the buoyant mist lingers over a large area. Without atmospheric mixing and its resulting dilution with time and distance, large areas can be damaged.

    The Effect of Turbulence on Deposition

    We’ve established that the more atmospheric mixing we have, the less spray will deposit on the ground, at least in the short term. How does this affect our thinking on the role of wind?

    When we evaluated drift data from a number of trials, we always saw more initial drift with higher wind speeds, as expected. However, the downwind deposit did not usually increase significantly. We attributed this observation to turbulence generated by wind which lifted more of the initial drift higher into the atmosphere. To be clear, deposited drift did not go down with higher wind. It just didn’t rise as fast as initial drift.

    Figure 7: The effect of wind speed on airborne drift (top line) vs deposited drift (bottom line) from a high clearance sprayer travelling 23 km/h and emitting a Very Coarse spray.

    The effect of turbulence can be viewed as a good thing because it protects downwind objects. Rapid dilution reduces immediate drift damage. We can use turbulence to protect objects on the ground. It’s certainly better than the alternative, emitting sprays when the atmosphere can’t dilute them, such as in an inversion. In that case, downwind areas remain at risk for a long distance, and for a long time.

    But we have to also consider what happens to airborne spray droplets. Some pesticides degrade in sunlight and stop being a problem. But others are more stable and may persist in the atmosphere for days or longer. During that time, they may move significant distances, ultimately returning to the earth’s surface in precipitation or in dust. Even though the atmosphere has diluted them, these deposits are measurable, and will show up in environmental monitoring of air, soil, and water.  We may not be able to find out where they originate, but the public knows who to blame. Agriculture.

    Vapour Drift

    Vapour drift is another issue altogether. It occurs hours and days after application, as long as the volatile product remains on a surface and conditions that allow formation of vapours persist. Vapour pressure is related to surface temperature, and losses increase with warmer surfaces. Some products enter the vapour phase when in contact with water, and release vapour after a rainfall.

    In situations where vapour is released for several days after application, it becomes impossible to control its subsequent movement. For droplet drift, if we know the wind direction at the time of spraying, we know where the impact is likely to be. But vapour movement depends on conditions that may occur between now and three days from now, and these could include high temperatures, various wind directions, and even inversions in which vapours accumulate. Ultimately, the best way to avoid off-target vapour movement is to avoid using volatile products.

    The Public Good

    Spray drift is one of agriculture’s most important stewardship challenges, and our industry needs to continue to improve its track record. Sprayers have a difficult task of converting a relatively small volume of liquid into a spray that offers good target coverage yet doesn’t move off the treated area. Favourable weather combined with droplet size management are at the heart of making this system work, but there isn’t a lot of wiggle room. Once again, an emphasis on sprayer productivity is one of the most fruitful areas to invest in, as this makes the best of the sometimes rare conditions in which spraying conditions are optimal.

  • What’s the Relationship Between Vapour Drift and Inversions?

    What’s the Relationship Between Vapour Drift and Inversions?

    Drift symptoms can take a few weeks to be discovered, and to figure out the cause, people need to reconstruct the conditions during the application in question. Wind direction is the easiest. But when we consider factors like inversions, volatility, calm conditions, and others used to explain the movement of pesticides, it can quickly become quite confusing.

    Let’s review how and why pesticides move.

    There are about six main ways that pesticides can move off-target.

    1. Droplet drift at the time of application;
    2. Vapour drift at or after the time of application;
    3. Pesticide movement in water (precipitation or runoff) after application;
    4. Dislodgeable residues from plant surfaces after application;
    5. Pesticide-containing soil movement after application;
    6. Pesticide residue in sprayers applied to another site.

    Whenever we find pesticides in a place where they do not belong, usually first indicated by plant symptoms specific to that herbicide, we need to find out the possible reasons and take steps to prevent that from happening again. We’ll focus on the first two items from the above list because those two are the most common.

    Droplet Drift: Sprayer nozzles produce droplet sizes ranging from 5 to 1000 µm, some up to 2500 µm. All nozzles, even the venerable low-drift tips recommended for dicamba application, will have a fraction of their volume in driftable droplets, say, less than 150 to 200 µm. For the low-drift sprays, that fraction is indeed very low, only a few percent of the total spray volume. For conventional nozzles, the driftable fraction may be 10 to 20% or more if high pressures are used.

    Tiny droplets have no energy of their own and move with the air mass they’re released into. If it’s windy, they move downwind. If the air is turbulent, they move up and down. If the atmosphere is stable, the buoyant fraction stays aloft and concentrated. So in order to understand their movement, we need to understand the atmosphere.

    Vapour Drift: Some chemicals are inherently volatile. This means they convert from the liquid or solid phase to a vapour phase on their own in accordance with temperature. Water is a great example, it is highly volatile. It is also able to sublimate, which means it can convert from a solid directly to a vapour without going through the liquid phase. An example of that is freezer burn, in which ice cubes shrink due to water escaping as a vapour.

    Volatile pesticides can also sublimate. On landing on a leaf or soil, a significant portion of a droplet is absorbed or adsorbed. Some fraction may dry on the leaf surface. This remaining solid can volatilize (form a vapour) for hours or days after application. The rate of evaporation is driven by two factors, (a) the background vapour pressure of the substance in the atmosphere, and (b) the surface temperature of the object the chemical is resting on. For water, the atmospheric vapour pressure can be expressed as relative humidity. Droplets evaporate slower when the atmosphere is already full of water.

    Pesticide evaporation is driven primarily by surface temperature. The background concentration of pesticide in the air is much lower than saturation, and has no effect. Pesticide evaporation is not directly affected by relative humidity because vapour pressures are independent of each other. In other words, most active ingredients will evaporate at the same rate whether the RH is 30% or 100% (it’s actually a bit more complicated than that. See the Note on Evaporation at the bottom of this article). This will be on the test, kids.

    Vapour losses can be minimized by choosing low-volatile pesticides and also by making the application on cooler days. We also need to watch the forecast and avoid spraying when tomorrow or the day after is forecast to be hot.

    Sometimes a rainfall can affect vapour losses, prompting a release of pesticide into the atmosphere. This behaviour can be predicted by the Henry’s Law Constant of a chemical.

    Inversions:  There are two types of turbulence, mechanical and thermal. Mechanical turbulence results from air encountering friction as it moves across a landscape. Taller objects and stronger winds result in greater mechanical turbulence. This turbulence creates small eddies that allow different layers of the atmosphere to communicate with each other and transfer momentum and contents up and down. More mechanical turbulence means more mixing and more sedimentation and dilution of a contaminant. In other words, the downwind impact of drift particles is reduced with greater mechanical turbulence. Mechanical turbulence happens whenever it’s windy, day or night, and it tends to counteract thermal turbulence.

    Thermal turbulence is more powerful than mechanical turbulence for dispersion of pollutants. Driven by the solar heating of the earth’s surface, that causes the lower atmosphere to be much warmer than the air higher up. The atmosphere normally cools the higher you go (at about 1°C/100 m, called the dry adiabatic lapse rate), but when it’s sunny, the gradient is greater. In other words, it cools faster because the air at the ground is warmer.

    Thermal effects move large parcels of air up and down, and we call this an unstable  or a turbulent atmosphere. When parcels of air rise and fall great distances, we get a powerful diluting effect which is usually associated with a breeze but can also happen under calm conditions. An unstable atmosphere is great at dispersing drift, minimizing its downwind impact. This can only happen during the daytime, is most powerful when it’s sunny, and almost never happens at night.

    By the way, a neutral atmosphere occurs when the rate of air cooling with height equals the adiabatic lapse rate described above. A neutral atmosphere can occur on cloudy days just before a rain, or on windy nights. There are no thermal effects in a neutral atmosphere, and the only dispersion occurs due to mechanical turbulence (windy conditions).

    A stable atmosphere (inversion) happens when there is no solar heating of the soil. In other words, it can only happen when the sun is low in the sky or at night. In this case, soil cools off and the cold soil cools air near it. As a result, the air temperature rises with elevation. Since it’s normal for air to cool with elevation (at the dry adiabatic laps rate mentioned earlier), the temperature profile is now…inverted. Hence the name “inversion”. To be clear (write this down kids, it’s on the test), an inversion describes an atmospheric condition in which (potential) temperature rises with elevation. That’s it. It rarely happens during the day, but is common on clear calm nights. (btw, “potential temperature is the temperature adjusted by its normal rate of cooling with height. To have thermal effects, the rate of cooling needs to be different from this rate.)

    The atmosphere is called stable because there is no thermal mixing. Air parcels stay put. Suspended particles such as tiny droplets stay put. Drift clouds stay concentrated, potent. If you make a fire, smoke hangs around. Cool, dense air is near the ground, and moves laterally very slowly, and might run downhill, like water, in a sloped setting. This situation is dangerous because it can move pesticide particles or vapours great distances without them becoming diluted or dispersed. An additional danger is that relative humidity is higher at night, delaying evaporation of water from the droplets. They stay potent.

    In Summary: Pesticides move in the atmosphere and are rapidly diluted by mechanical, and especially thermal, turbulence. That is why we like to see spray applications on sunny days with a nice breeze, which moves the product in a predictable direction and dilutes any drift rapidly along the way. We minimize particle drift through the usual measures such as the use of low booms, protective shields, slow travel speeds, and coarser sprays. We avoid spray application of volatile pesticides on or preceding hot days to minimize the risk of vapour drift. We do not apply pesticides when the atmosphere is stable (inversion), which usually means from just before sunset to just after dawn on a clear night.

    OK, that’s the basics. Now let’s explore some common questions.

    1. Can all pesticides move as particles and vapours? All pesticides that are atomized through a nozzle can move as particles. Only pesticides that are considered “volatile” can form significant amounts of vapour and move in that form. Dicamba is volatile. New dicamba formulations such as Xtendimax, FeXapan, and Engenia are much less volatile than older formulations, but they’re still capable of moving as vapours. Glyphosate and many other pesticides are not considered volatile and are not known to cause vapour drift.
    2. Are inversions only a problem for dicamba? Inversions affect droplet drift from all pesticides equally. The key difference is the amount of harm that any given droplet or vapour cloud can impart. Dicamba can harm conventional soybeans, many vegetable crops, and many trees and shrubs at extremely low doses. That means that even a weak inversion or a small amount of drift can cause great harm for long distances. In comparison, most other products are not as harmful to most of our crops in such small doses (I’m generalizing, forgive me). Tiny amounts may never be noticed, but they are there. Dicamba lets us notice these tiny amounts.
    3. Does vapour drift move only by inversions? No, although its movement is more damaging under inversions. Vapour drift clouds form above a recently sprayed canopy on hot days when leaf or soil surfaces contain a volatile product. On a sunny day (no inversion), this vapour will likely disperse rapidly downwind, causing diminishing damage with increased distance in relation to the sensitivity of the non-target plant. But towards evening, the dispersion (caused by thermal turbulence) ends as the sun sets and the atmosphere becomes stable. Now, the residual vapour cloud above the crop is no longer diluted, and may move in an unpredictable direction based on the slope of the land or a very gentle evening breeze. This movement may be significant, extending for miles in some cases, and potentially causing harm along the way.
    4. How long after application can vapour drift occur? Under most conditions, vapour losses diminish rapidly and will likely be gone within a few days as the pesticide is taken up by plants, metabolized, converted to a non-volatile form, etc. For some products, a light rainfall event can release a new wave of vapour drift because these products would rather be vapours than be dissolved in water, in accordance with their Henry’s Law Constant.
    5. Do some products drift further than others? Yes and no, but mostly no. Spray drift is a physical process governed by the behaviour of droplets in the atmosphere. Droplet diameter determines its mass and this mass controls the time it takes the droplet to sediment to the ground. The substance dissolved or suspended in that droplet has no bearing on this behaviour. But there are two key exceptions to consider. First, we know that some formulations generate more fine droplets than others even when atomized through the same nozzles. The greater abundance of small droplets will create more drift damage at any given distance, and also extend further downwind. And secondly, some formulations change the rate of water evaporation from the droplets. As a result, droplets moving downwind may shrink faster, in effect making them more drift prone and causing them to move further downwind. The same droplet size drifts the same distance, but droplet size changes. Question for the final: If you spray dicamba and glyphosate on the same day using the same nozzle, and the formulation has no impact on droplet size or evaporation, which one drifts further over a soybean crop? The answer is at the bottom of this article.
    6. Do calm conditions indicate an inversion? Inversions are defined as a temperature profile, not a wind condition. But the two are associated. An inversion is most pronounced and persists the longest under calm conditions, and because it suppresses atmospheric mixing, an inversion does prevent a windier upper atmosphere from reaching the ground. But it can be calm in the middle of the day with an unstable atmosphere. The calm condition eliminates mechanical turbulence, and therefore reduces the dispersion of the spray cloud. Calm conditions are also undesirable because the winds that follow a calm period are often unpredictable in direction, force, or duration. So it’s not a great idea to spray when it’s completely calm, even on a sunny day.
    7. Can inversions occur during the day? Yes, but it’s rare. Sometimes a large cold air mass moves into an area, say from a cool body of water, pushing warm air above it. So technically the air at the ground is cooler than the air above it, suppressing dispersion through that cap. Another situation is an inversion layer that forms at the top of a transpiring plant canopy. The air at ground level is warm, and cools suddenly where the crop evaporates water from its leaves. Air temperature rises with elevation above this transpiring layer, then cools again in accordance with an expected profile. So we have a thin layer in which vertical mixing is suppressed. This is most common in dense, thick canopies with adequate soil moisture on hot days.
    8. Is there an inversion every night? No. Cloud cover suppresses the rapid cooling of the soil, and the air at soil level stays warmer longer. Wind mixes the cold air layer into a warmer air layer, returning a more neutral condition. Inversions are most likely on clear nights with little wind. Recent data in inversion frequency from Missouri and North Dakota shows that inversions occur on the majority of nights, but the frequency depends on the location.
    9. Can drift be eliminated? Yes, we can eliminate spray drift by atomizing the spray in droplets (or, for dry soil-active products on carrier particles) large enough to resist movement in wind. We would need to be sure that absolutely no fine droplets or particles are produced, and that they don’t dislodge after application. That will require different atomizers and significantly more water volume and possibly new adjuvants. Some will argue that drift can also be eliminated by protecting the fine droplets with shields or air assist, but again, the protection would need to be 100%. Drift control has not been a high enough priority for these technologies to be developed and made available to applicators. Vapour drift can be eliminated by not applying volatile products.

    Pesticide movement in the atmosphere is complicated. But pesticides don’t just move as a result of vapour or droplet drift. Consider all the options when investigating an affected field. And let’s all work together to better understand pesticide movement and to prevent it.

    Answer: Both drift equally. But assuming the beans are susceptible to both herbicides, the dicamba damage will appear further downwind due to the greater sensitivity of the beans to this herbicide. This does not mean it drifted further.

    Note on Evaporation: There is some discussion about the role of relative humidity on vapour loss. Although we stated that RH plays no direct role in pesticide volatility, we need to qualify that.

    (a) Many pesticides dissolve in water. More water moves to plant or soil surfaces during periods of low RH, and this can carry dissolved pesticide with it. The supply of pesticide that can evaporate is thereby replenished.

    (b) Evaporation is driven by temperature and the concentration gradient between the source and the atmosphere. In still air, the air layers closest to the evaporating surface are most concentrated with evaporated pesticide, slowing further evaporation. Air movement will remove these layers, increasing the rate of evaporation.

    (c) co-distillation may occur for some pesticides. This means that the pesticide dissolved in water may evaporate with water, liberating it into the atmosphere. When co-distillation occurs, low RH would increase pesticide losses as well.

    We still have much to learn about these phenomena, especially as it affects new formulations.