This work was performed with Mark Ledebuhr (Application Insight LLC.), Adrian Rivard (Drone Spray Canada) and Adam Pfeffer (Bayer Crop Science – funding partner). Amy Shi is gratefully acknowledged for her assistance with statistical analysis.
Introduction
In June 2017, Transport Canada cleared the general use of drones. In 2018, Health Canada clarified that the use of Remote Piloted Aircraft Systems (RPAS) for pesticide application is not permitted under the Pest Control Products Act without sufficient data to characterize any associated risk. Currently, there are no liquid pest control products registered for application by drone in Canada.
Stakeholders want to use drones to apply pest control products in Canada. To that end, several research trials have been approved by Health Canada. However, multi-rotor drones represent a unique application technology more akin to air-assisted ground sprayers than manned aircraft. As such, conventional models for drift, exposure and efficacy may not apply. Fundamental questions surrounding the utility of drones must be addressed before efficacy and residue can be considered in any relevant context.
Research and user experience has identified, and is beginning to understand the relative influence of, external factors such as crop morphology, planting architecture, topography, and environmental conditions. Considered with the product mode of action, these factors inform operational settings such as altitude, travel speed, nozzle choice, and application volume to optimize applications. This collective “Use Case” depends on drone design, which is highly variable and rapidly evolving.
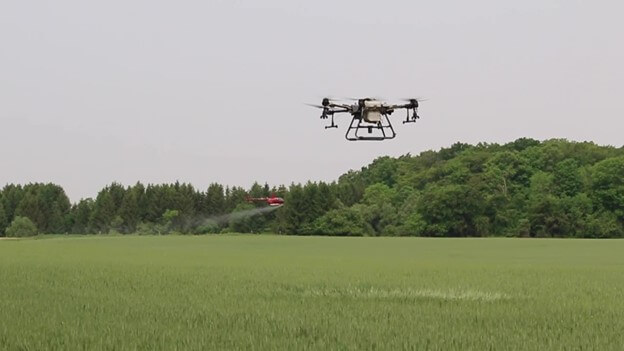
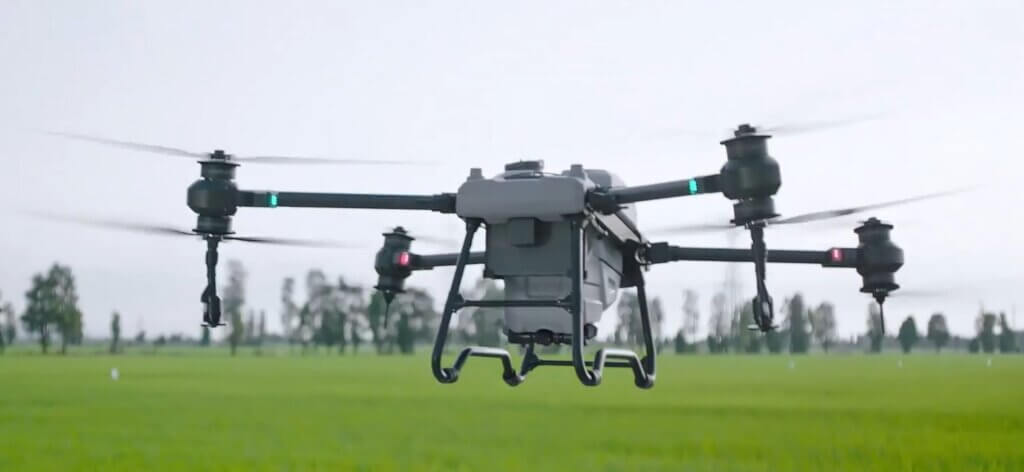
Having performed preliminary work characterizing effective swath width, and recognizing its popularity in North America, we used DJI’s Agras T10 in this study. Our objective was to evaluate fungicide efficacy on Northern Corn Leaf Blight, Tar Spot, Grey Spot and Common Rust in field corn, as applied using the T10. Drift and coverage would be characterized to provide context for the efficacy analysis, but also to develop data to inform best practices and possibly regulatory decisions surrounding risk. Aspects of the study would be repeated using conventional ground sprayer technologies to form a basis for comparison.
Objectives
- Quantify spray coverage in field corn at three canopy depths, on adaxial and abaxial surfaces, as recovered tracer dye (indexed to % of applied rate ac-1), area covered (%) and deposit density (deposits cm-2).
- Quantify drift as recovered tracer dye (indexed to % applied rate ac-1) collected using the horizontal flux method up to eight meters high on the immediate downwind edge of the application.
- Evaluate the fungicide efficacy, applied using the T10, at 2 and 5 gpa as compared to a conventional overhead broadcast treatment at 16.7 gpa.
Material and Methods
Design
Trials were conducted between July and August of 2022 in three Ontario corn fields. The locations, the application methods and data collected are detailed in Table 1.
| Field | Location | Corn Variety | Application Method | Rate (gpa) | Data Collected |
| 1 | Jaffa (42°45’56.6″N 81°02’06.5″W) | DKC45-65RIB | Agras T10 | 2 and 5 | Drift, Coverage, Efficacy |
| Overhead Broadcast | 16.7 | Coverage, Efficacy | |||
| 2 | Fingal (42°42’17.9″N 81°15’15.3″W) | DKC49-09RIB | Agras T10 | 2 and 5 | Drift, Coverage, Efficacy |
| Overhead Broadcast | 16.7 | Efficacy | |||
| 3 | Port Rowan (42°35’53.6″N 80°30’43.2″W) | P0720AM | Directed (Drop hoses) | 20 | Coverage |
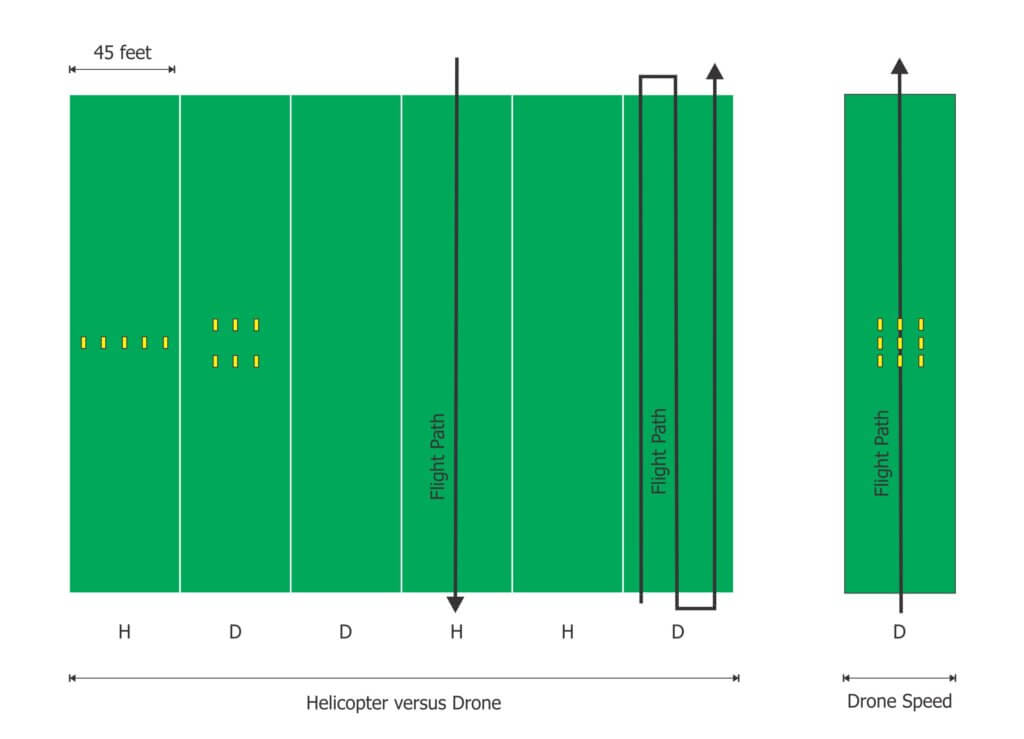
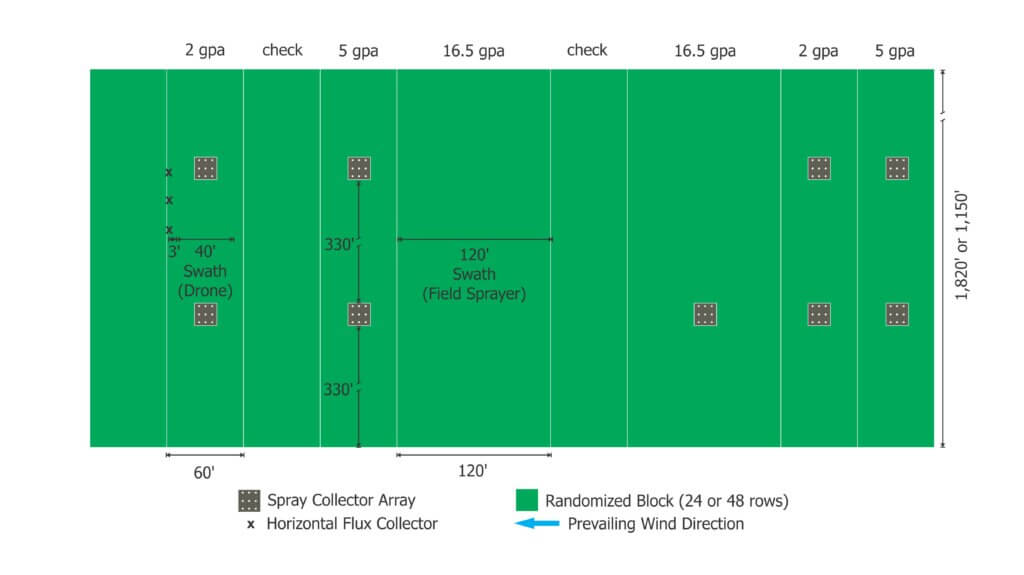
Treatments were arranged in a randomized complete block design (Figure 1). Corn was planted on 30″ centres, with about 6” in-row spacing between stalks. We targeted spray for the R1 stage of development (approx. 8’ high). Fields 1 and 2 each hosted two replicated treatments of 2 gpa, 5 gpa, and 16.7 gpa, as well as two unsprayed checks. In field 1, blocks were 60’ (24 rows) wide by 1,150’ long for the T10, and 120’ (48 rows wide) by 1,150’ long for the broadcast field sprayers. A single, 120’ swath was applied using the field sprayers, and four 10’ (4 row) swaths were required to spray the centre 40’ (16 rows) of corn using the T10. This was based on a 10’ effective swath width determined in previous research. Field 2 had a similar layout but was 1,820’ long.
Coverage Analysis
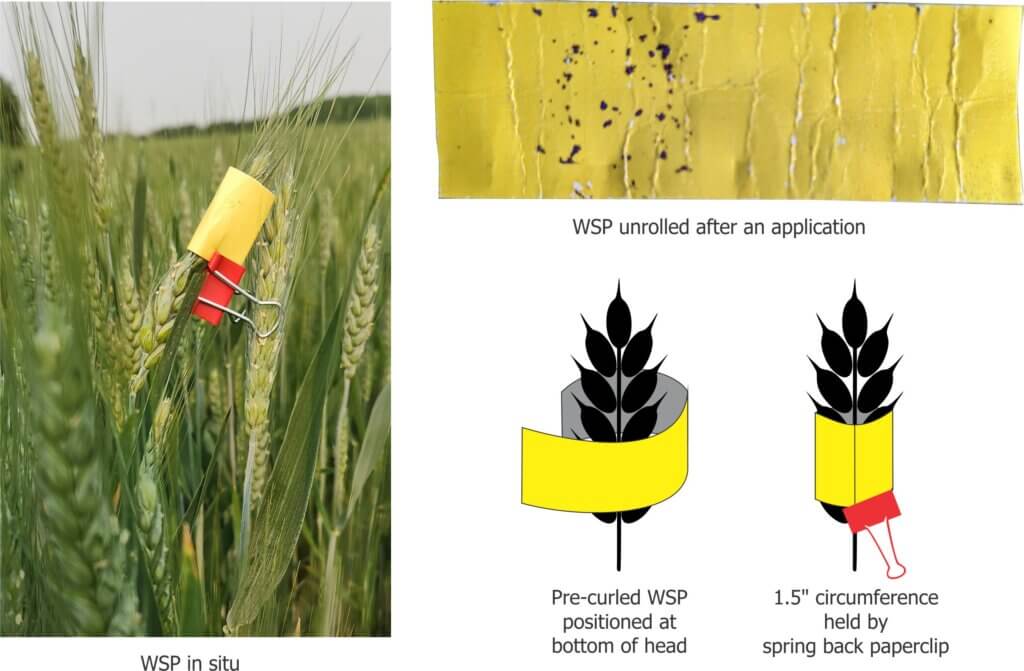
To account for variability, each treatment block was subdivided into two regions, each containing an array of nine spray collectors. Each spray collector (Figure 2) consisted of a vertical, 8’ pole in-row between corn plants. Samplers were attached at three depths to span the silking region: Top: 1.5’-2’ below the tassel. Bottom: 1.5’-2’ from the ground. Middle: halfway between them. Samplers were parallel with the ground to ensure the highest degree of spray interception. On one side, two 1”x3” water sensitive papers (WSP; Innoquest Inc.) were clipped back-to-back with a sensitive side positioned up (adaxial) and facing down (abaxial). The other clip held two 4” square sheets of Mylar in the same orientation. Sampler type was alternated vertically (e.g. Mylar – WSP – Mylar or WSP – Mylar – WSP).
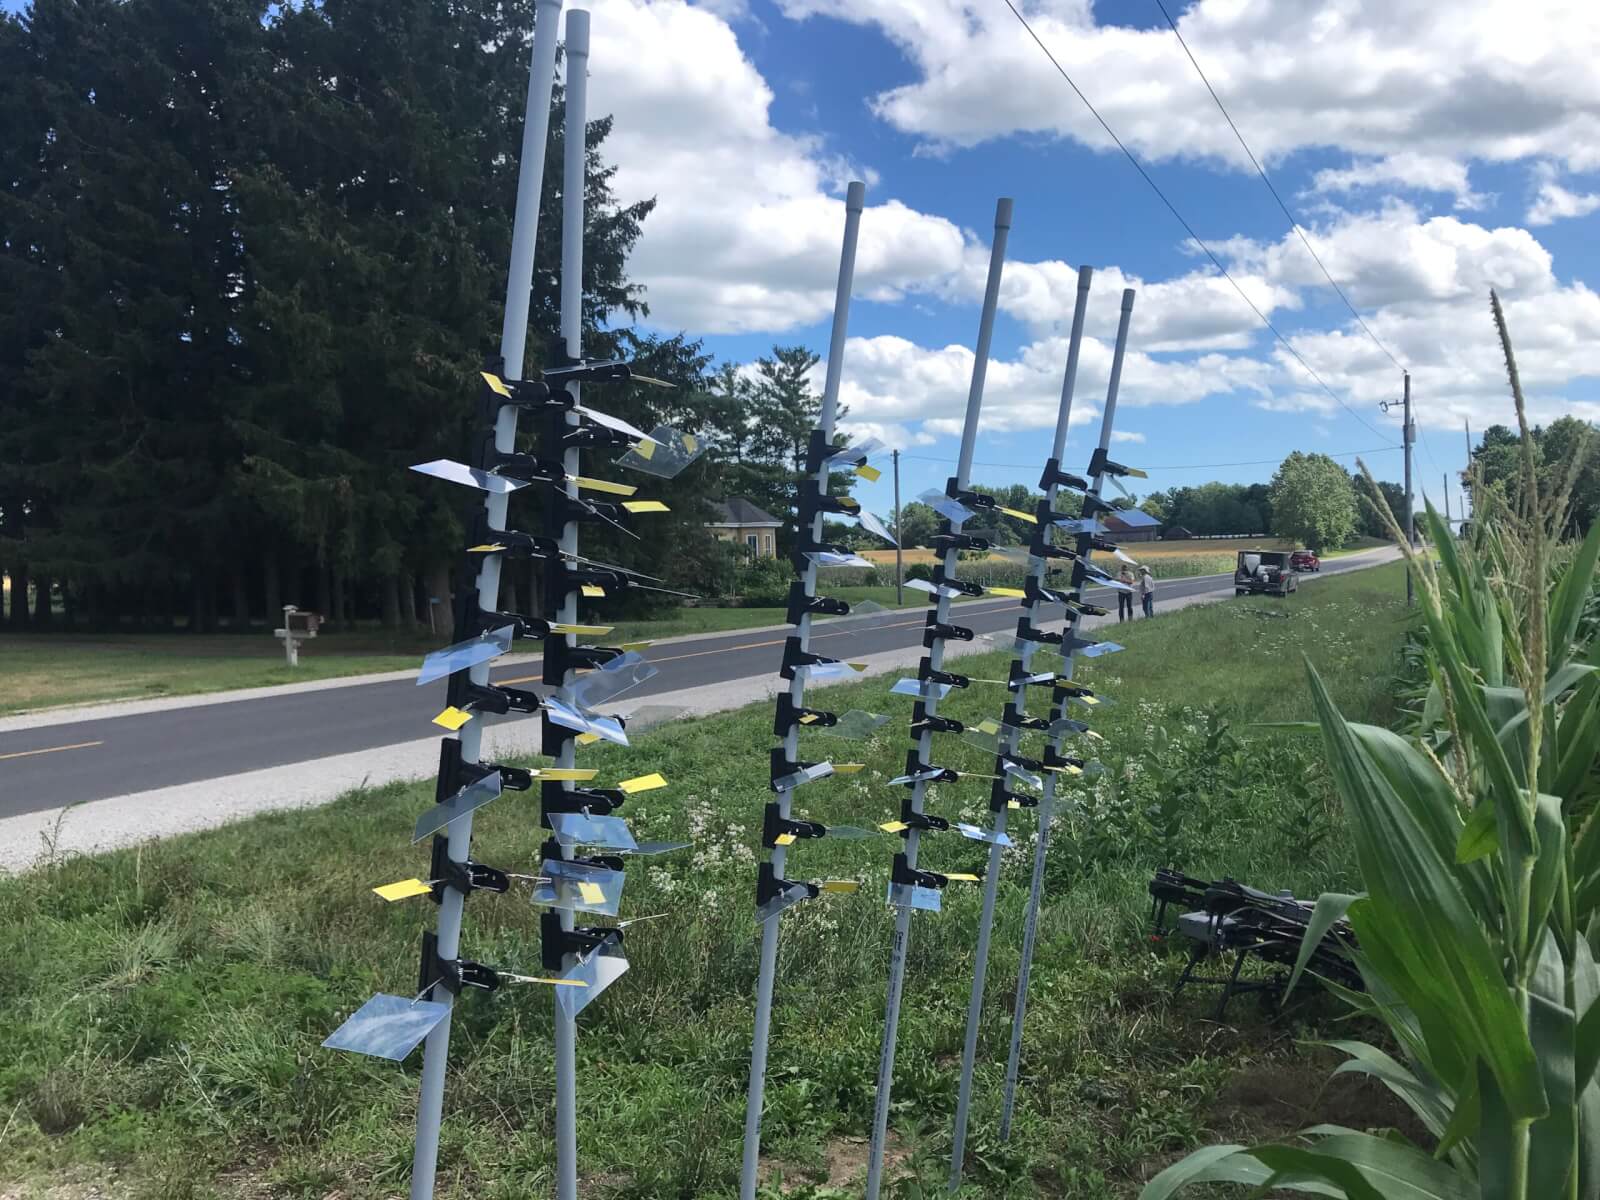
This study used 864 WSP and 864 Mylar samplers for the RPAS treatments, and 162 WSP for the overhead broadcast and directed applications. Following the application, samplers were retrieved as soon as they were dry enough to handle (about 30 minutes) and individually placed into pre-labeled sealable plastic bags, each uniquely coded to the exact position and orientation of the collector.
Operational Use Cases
- 5 gpa: DJI Agras T10 was operated at 3.3 m/s, 2 m above tassels. TeeJet 11002 AIXR nozzles equipped with 50 mesh filters were operated at 70 psi.
- 2 gpa: DJI Agras T10 was operated at 7.0 m/s, 2 m above tassels. TeeJet 11002 AIXR nozzles equipped with 50 mesh filters were operated at 45 psi.
- 16.7 gpa: Overhead broadcast condition. Field 1 ran a John Deere 4038R operated at approx. 10 mph with TeeJet XR11006 nozzles on 20” spacing. Pulse width modulation (ExactApply) was engaged. Field 2 ran a New Holland 345 front-mounted boom sprayer with TeeJet XR11006 nozzles on 20” spacing.
- 20 gpa: Directed condition. John Deere R4038 operated at approx. 4.5 mph with Beluga drop hoses suspended on 30” centres to correspond with alley spacing. Two nozzle bodies were positioned 15″ apart equipped with Greenleaf Spray Max 110015 nozzles to span the silking area.
Drift Analysis
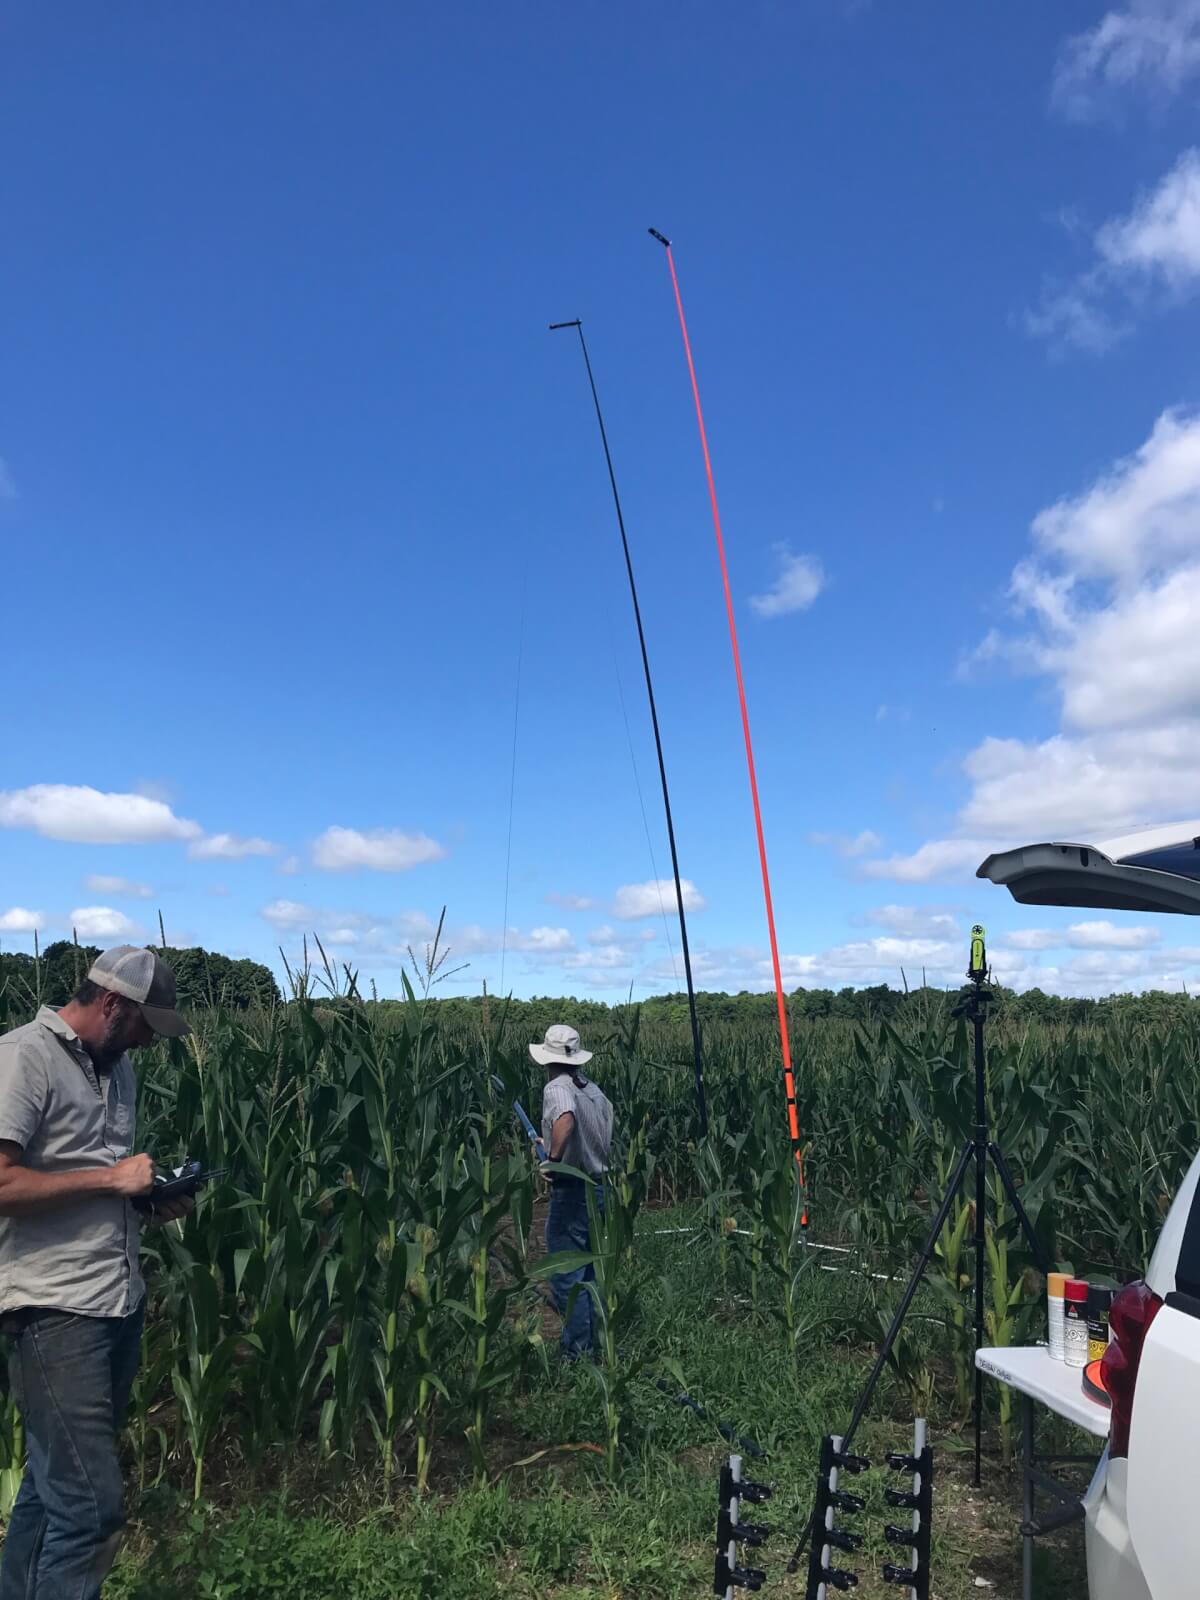
Three free-standing 26’ (8 m) horizontal flux collectors were positioned in the corn field approximately 3’, or 1.5 rows from the downwind edge of the spray plot downwind of the area treated by drone (Figure 3). The sampling poles were positioned about 30’ apart parallel to the treatment block. Sterilized, 1.8 mm braided polyethylene collector line was run up the poles on pulleys just prior to application. Following applications, the line was collected in 1 m lengths into sealed bags.
The assumption was that by placing the horizontal flux samplers as close to the “zero” downwind edge position as possible, nearly the entire off-swath movement of drift would be captured. A compromise of placing the samplers in the middle of the first row past the downwind swath edge was made due to the scale of the sample and the relative low swath precision of the drone. Placing the samplers closer to the zero downwind line was deemed to be too high a risk of inadvertently sampling in-swath.
Spray Solution (Formulated Product plus Tracer)
Fungicide was applied at field rates (8 oz/ac or 586 mL/ha). The field sprayer applied this at 16.7 gpa. The drone applied it at 2 or 5 gpa but also included tracer solution at 0.2% (20 ml/10L solution) vol./vol. of a 20% mass/mass solution of PTSA in dH2O. PTSA residue data assumes 100% recovery and 0% degradation of the tracer. Tests of PTSA with fungicide prior to the study showed no physical antagonism and >98% tracer recovery. Prior testing of PTSA showed an acceptable 1-2% solar degradation in the timeframe required to collect samplers. Tank samples were drawn from the drone at the beginning and end of each trial and used to confirm tank concentration and to establish fluorescence curves.
Weather Conditions
Weather data was collected using a Kestrel 3550AG weather meter (Kestrel Instruments) in a vane mount positioned 1 m above the tassel (approximately 1 m below drone altitude). Data was logged every 5 seconds. Issues with data loss required us to supplement local data with Field Level Weather Summary data (Table 2).
| Date (2022) | Field | Vol. (gpa) | Avg. Temp. (°C) | Avg. Windspeed (km/h) | Start Time | Duration (min.) |
| Jul 25 | 1 | 5* | 22.3 | 6.2 | 13:00 | 35 |
| Jul 25 | 1 | 5 | 21.4 | 7.5 | 18:45 | 35 |
| Jul 26 | 1 | 16.7 | 18.8 | 5.4 | 10:00 | 45 |
| Jul 26 | 1 | 2 | 23.9 | 7.7 | 15:30 | 25 |
| Jul 29 | 2 | 5** | n/a | 16.4 | 11:00 | 35 |
| Jul 29 | 2 | 2*** | 23.6 | 21.0 | 14:00 | 25 |
| Aug 12 | 3 | 20**** | 25.4 | 6.3 | 13:30 | 15 |
*Trial pass over spray collectors only – no horizontal flux collectors employed.
**All bottom-level water sensitive paper samplers spoiled by high humidity. Wind changeable and horizontal flux poles moved 2x before application to orient downwind.
***Noted flocculation in tank samples likely from rainfastness adjuvant. Did not affect analysis.
****Coverage data from a single array of nine spray collectors with water sensitive paper samplers.
Results
Statistics
The % applied rate ac-1, % area covered, and deposits cm-2 were subjected to analysis of variance using SAS® OnDemand for Academics PROC GLM. When a significant treatment effect was found, means were compared using Tukey’s honest significant difference test (HSD) at p=0.05.
Data Collation
Each spray collector was a vertical structure that supported Mylar samplers at three depths. Each depth held two samplers oriented abaxially or adaxially, in parallel with the ground. When discussing the amount of PTSA recovered by sampler depth or by sampler orientation, the % applied rate ac-1 of each of the nine related samplers were averaged within each array (n=2 arrays per block times two replicates equal n=4 per treatment).
When considered from above, the six Mylar samplers are vertical cross-sections of the same area of ground. Therefore, the % applied rate ac-1 from each sampler was added to represent the total mass of tracer intercepted per collector. When these nine sub-samples are averaged, we arrive at the average % applied rate ac-1 per array.
Similarly, the % applied rate ac-1 from each 1 m length of string on a horizontal flux collector could be averaged across collectors by relative position to explore drift by height (n=3 poles per block times two replicates equal n=6 per treatment). Alternately, the total PTSA recovered per pole could be calculated (n=3 poles per block times two replicates equal n=6 per treatment). This interpretation allowed us to perform a mass balance accounting of residue in-canopy and as drift compared to the known applied rate ac-1.
It was not possible to collate the data in this fashion for the WSP because it was not possible to index % area or deposits cm-2 on a 1”x3” area to a theoretical maximum. Therefore, we averaged the nine samplers within an array relative to their position and orientation (n=2 arrays per block times two replicates equal n=4 per treatment) or averaged the six samplers per collector prior to averaging all collectors in an array (n=2 arrays per block times two replicates equal n=4 per treatment).
RPAS Coverage – Mylar Samplers
There is a negative linear relationship (r2=0.997) between the depth of the sampler and the average % applied rate ac-1 (Table 3). The deeper the sampler, the less tracer recovered. The sum of the average % applied rate ac-1 at each depth was 17.7% of known rate applied rate ac-1.
| Sampler Depth | Avg. % Applied Rate ac-1 | Significance |
| Top | 9.6 | A |
| Middle | 5.7 | B |
| Bottom | 2.4 | C |
| Total: | 17.7 | – |
The orientation of the sampler significantly affected the overall average amount of tracer recovered (Table 4). The abaxial surfaces intercepted an average 11.1 % applied rate ac-1 less (a 97% difference) than adaxial surfaces. Note: When Mylar was retrieved a few had physically shifted, potentially exposing the back side of abaxial collectors to primary deposition from above. Therefore, it is assumed that the actual deposit is lower than reported here.
| Sampler Orientation | Avg. % Applied Rate ac-1 | Significance |
| Adaxial | 11.4 | A |
| Abaxial | 0.3 | B |
When we separate the data to focus on the volume applied, we see volume had a significant impact on the amount of tracer recovered (Table 5). The average % applied rate ac-1 was 2.1% less (a 58% difference) in the 2 gpa condition compared to the 5 gpa condition.
| Field | Avg. % Applied Rate ac-1 | Significance |
| 1 | 7.1 | A |
| 2 | 4.6 | B |
When we isolate the volume applied by field, the 2 gpa treatment resulted in less coverage in field 2 (average 1.4 % applied rate ac-1 or 28% less) and significantly for the 5 gpa treatment (average 3.6 % applied rate ac-1 or 41% less: Table 6).
| Date | Field | Volume (gpa) | Avg. % Applied Rate ac-1 | Significance |
| Jul 25 | 1 | 5 | 9.2 | A |
| Jul 26 | 1 | 2 | 5.0 | B |
| Jul 29 | 2 | 5 | 5.6 | C |
| Jul 29 | 2 | 2 | 3.6 | B |
When sampler depth is included in the field analysis (Table 7), we see similar deposition patterns; a negative linear relationship between coverage and canopy depth in all treatments save the 5 gpa treatment in field 2. Closer inspection confirms a reduction in coverage for the 2 gpa condition in field 2 versus field 1, and a significant reduction for the 5 gpa condition in field 2 versus field 1.
| Sampler Depth | Field 1 – Jul 25: 5 gpa. Avg. % Applied Rate ac-1 (Sig.) | Field 1 – Jul 26: 2 gpa. Avg. % Applied Rate ac-1 (Sig.) | Field 2 – Jul 25: 5 gpa. Avg. % Applied Rate ac-1 (Sig.) | Field 2 – Jul 29: 2 gpa. Avg. % Applied Rate ac-1 (Sig.) |
| Top | 15.2 (A) | 8.3 (A) | 8.0 (A) | 6.7 (A) |
| Middle | 9.1 (B) | 4.7 (B) | 6.1 (AB) | 2.9 (B) |
| Bottom | 3.5 (B) | 1.9 (C) | 2.6 (B) | 1.5 (B) |
| Total: | 27.8 | 14.9 | 16.7 | 11.1 |
RPAS Drift – Horizontal Flux
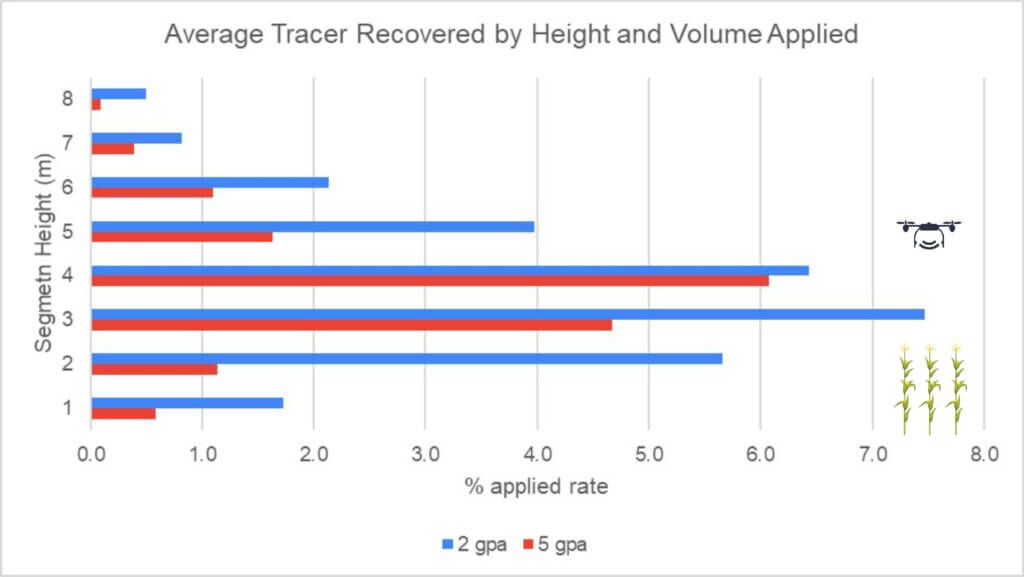
Overall, the volume applied had a significant impact on drift, where the 2 gpa treatment resulted in an average increase of 1.6 % applied rate ac-1 (44% difference: Table 8) versus the 5 gpa treatment.
| Volume Applied (gpa) | Avg. % Applied Rate ac-1 | Significance |
| 2 | 3.6 | A |
| 5 | 2.0 | B |
As with the Mylar samplers, there was a “field effect” where the field had a statistically significant impact on the amount of tracer recovered (Table 9). However, unlike the Mylar samplers in the crop, more tracer was recovered in field 2 (average increase of 3.2 applied rate ac-1 or a 67% difference) than in field 1.
| Field | Avg. % Applied Rate ac-1 | Significance |
| 1 | 1.4 | A |
| 2 | 4.2 | B |
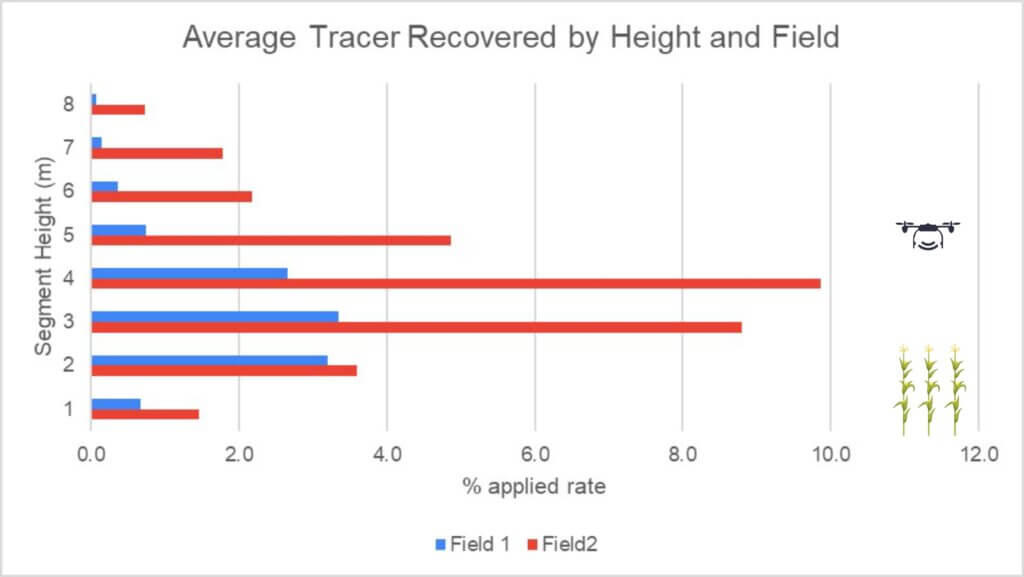
The pattern of deposition by height was similar across all treatments. For context, note that the first 2.5-3 m of string were within the corn canopy and drone altitude was approximately 5 m off the ground (2 m over the tassels) per Figure 4 and 5. The differences were only statistically significant in field 2 (Table 10) where an average 33% applied rate ac-1 was intercepted compared to 11% in field 1.
| Height (1m segment in m from ground) | Field 1: Avg. % Applied Rate ac-1 | Sig. | Field 2: Avg. % Applied Rate ac-1 | Sig. |
| 8 | 0.7 | A | 1.5 | C |
| 7 | 3.2 | A | 3.6 | BC |
| 6 | 3.3 | A | 8.8 | A |
| 5 | 2.7 | A | 9.9 | A |
| 4 | 0.7 | A | 4.9 | AB |
| 3 | 0.4 | A | 2.2 | BC |
| 2 | 0.1 | A | 1.8 | C |
| 1 | 0.1 | A | 0.7 | C |
| Total: | 11.2 | – | 33.3 | – |
The volume applied had a significant effect on the total PTSA tracer detected in both fields, with an average 4.4% applied rate ac-1 more (a 59% difference) recovered in the 2 gpa treatment (Table 11 and Figure 5). Separated by fields, the 5 gpa treatment had an average 1.4% % applied rate ac-1 more (a 77% difference) in field 2 and the 2 gpa treatment had an average 2.8% % applied rate ac-1 more (a 76% difference) in field 2.
| Volume Applied (gpa) | Field 1: Avg. % Applied Rate ac-1 | Sig. | Field 2: Avg. % Applied Rate ac-1 | Sig. |
| 2 | 2.2 | A | 5.0 | A |
| 5 | 0.7 | B | 2.1 | B |
Mass Balance Accounting
It is never possible to entirely “close mass” in spray studies because there are other surfaces (e.g. leaves) within the vertical profile that intercept spray, as well as off-swath deposition and the ground itself (not measured in this study). Nevertheless, the exercise does allow us to estimate and compare how much spray was captured and how much remains unaccounted for (Table 12). We see that the 2 gpa treatment in field 1 had the highest unaccounted-for fraction, and on average we were able to account for an average 53% of the applied rate ac-1 in this study.
| Field (Volume in gpa) | Coverage: Avg % Applied Rate ac-1 (A) | Drift: Avg % Applied Rate ac-1 (B) | Total % Detected (A+B) | Unaccounted Fraction [100-(A+B)] |
| 1 (5) | 51 | 5 | 56 | 44 |
| 1 (2) | 26.5 | 17 | 43.5 | 56.5 |
| 2 (5) | 30 | 24 | 54 | 46 |
| 2 (5) | 19.5 | 40 | 59.5 | 40.5 |
RPAS and ground rig coverage – Water Sensitive Paper
The depth of the sampler had a significant effect on the overall average % area covered at all depths (Table 13). However, there was no significant difference at the two lower depths for deposit density (Table 14). In both cases, the negative linear relationship between coverage and sampler depth corresponds closely to the PTSA recovered on the Mylar samplers (see Table 3).
| Sampler Depth | Avg. Coverage (% Area) | Significance |
| Top | 2.80 | A |
| Middle | 1.28 | B |
| Bottom | 0.62 | C |
| Sampler Depth | Avg. Coverage (Deposits cm-2) | Significance |
| Top | 44.5 | A |
| Middle | 17.9 | B |
| Bottom | 7.2 | C |
The sampler orientation had a significant effect on both overall average % area covered (Table 15) and deposits cm‑2 (Table 16).
| Sampler Orientation | Avg. Coverage (% Area) | Significance |
| Adaxial | 3.03 | A |
| Abaxial | 0.12 | B |
| Sampler Orientation | Avg. Coverage (Deposits cm-2) | Significance |
| Adaxial | 43.5 | A |
| Abaxial | 3.1 | B |
The treatment had a significant effect on the overall % coverage (Table 17) with the overhead broadcast condition covering an average 3.31% more sampler surface (a 60% difference) compared to the next highest treatment value. The directed application delivered a significantly higher 67 deposits cm-2 (a 72% difference) compared to the next highest treatment value (Table 18).
| Treatment (gpa) | Avg. Coverage (% Area) | Significance |
| Broadcast (16.7) | 5.91 | A |
| Directed (20) | 2.32 | B |
| Drone (5) | 1.34 | BC |
| Drone (2) | 0.55 | C |
| Treatment (gpa) | Avg. Coverage (Deposits cm-2) | Significance |
| Broadcast (16.7) | 92.6 | A |
| Directed (20) | 25.8 | B |
| Drone (5) | 22.9 | B |
| Drone (2) | 5.9 | B |
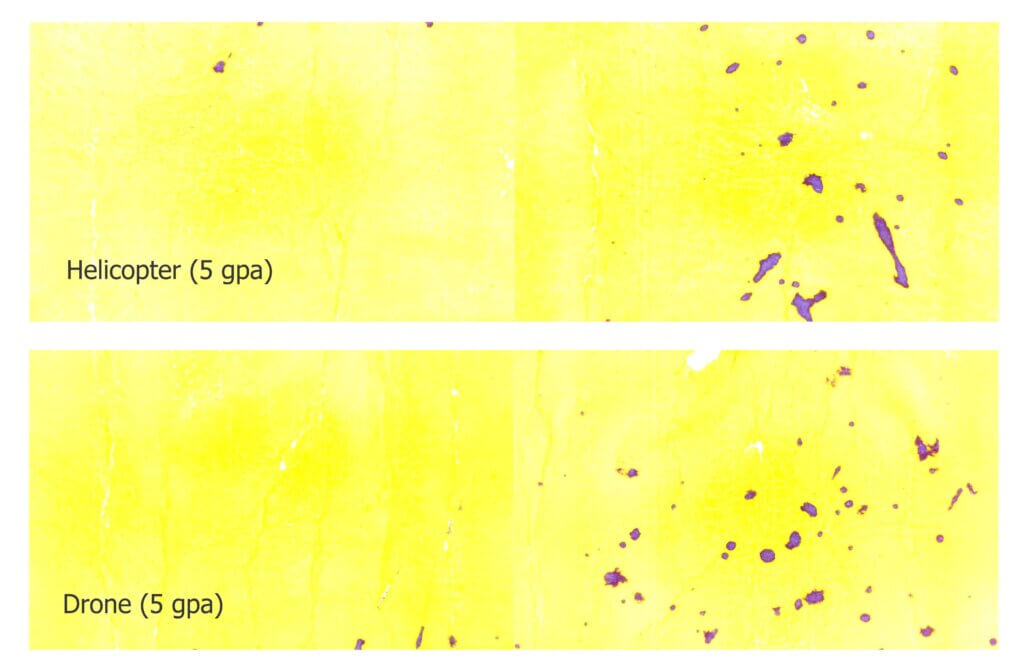
When we increase resolution to include sampler orientation, we see high standard errors typical of the variability inherent to spray coverage analysis (Figures 6 and 7). The broadcast treatment had the highest average adaxial % area coverage and the second highest average deposit density. The directed treatment had the second highest average adaxial % area coverage and the highest average deposit density but had the highest overall average coverage on the abaxial samplers. RPAS coverage on all samplers was lowest overall and was relative to the volumes applied.
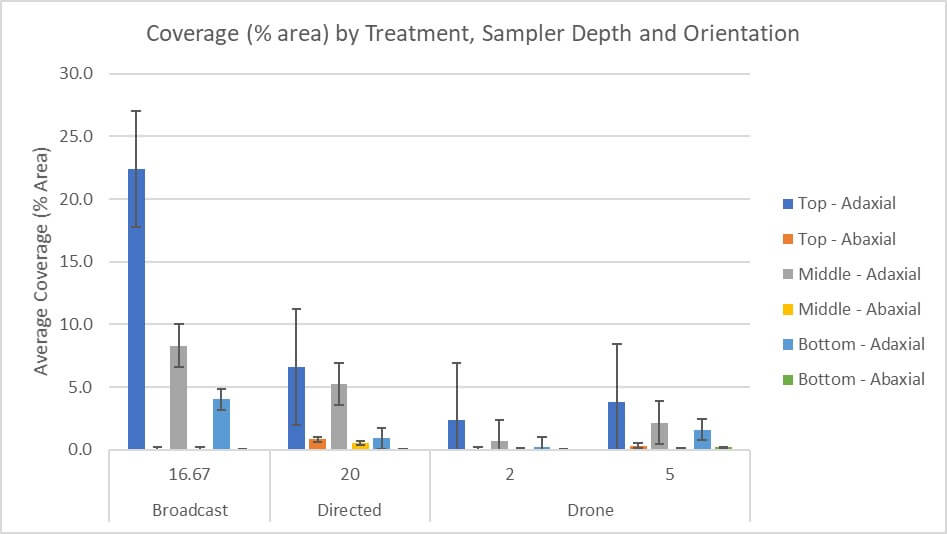
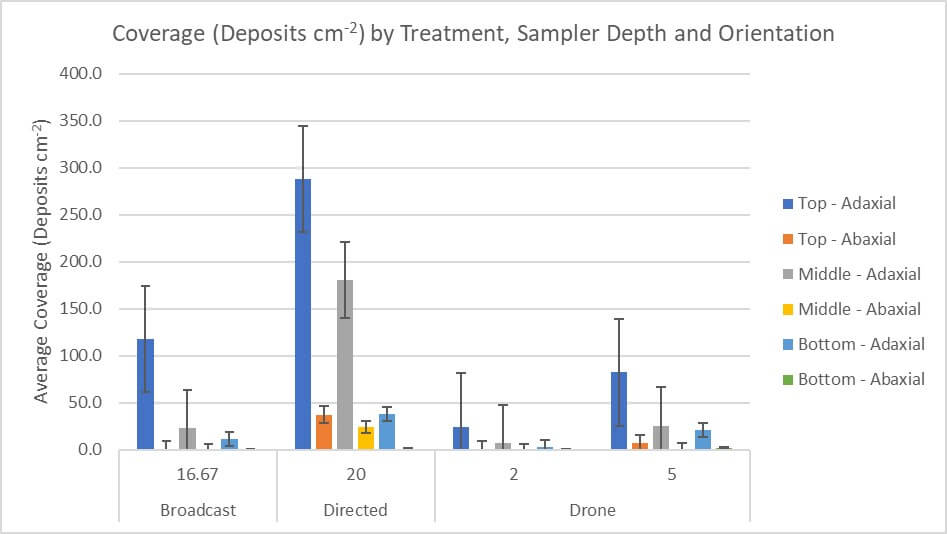
Focusing on RPAS treatments, the orientation of the sampler significantly affected coverage (Tables 19 and 20).
| Sampler Orientation | Avg. Coverage (% Area) | Sig. | Avg. Coverage (Deposits cm-2) | Sig. |
| Adaxial | 1.1 | A | 11.6 | A |
| Abaxial | 0.0 | B | 0.4 | B |
| Sampler Orientation | Avg. Coverage (% Area) | Sig. | Avg. Coverage (Deposits cm-2) | Sig. |
| Adaxial | 2.5 | A | 47.3 | A |
| Abaxial | 0.2 | B | 7.5 | B |
Continuing to focus on the RPAS treatments, the depth of the sampler had a significant effect on overall average coverage at both 2 gpa (Table 21) and 5 gpa (Table 22). Just as with the average % applied rate ac-1 (included here for comparison), the overall average coverage on the top adaxial sampler was significantly higher than the other two depths for % area covered and deposits cm-2.
| Sampler Depth | Avg. Coverage (% Area) | Sig. | Avg. Coverage (Deposits cm-2) | Sig. | Avg. % Applied Rate ac-1 | Sig. |
| Top | 1.2 | A | 12.8 | A | 7.5 | A |
| Middle | 0.4 | B | 3.9 | B | 3.8 | B |
| Bottom | 0.1 | B | 1.3 | B | 1.7 | B |
| Sampler Depth | Avg. Coverage (% Area) | Sig. | Avg. Coverage (Deposits cm-2) | Sig. | Avg. % Applied Rate ac-1 | Sig. |
| Top | 2.1 | A | 48.3 | A | 9.2 | A |
| Middle | 1.1 | B | 17.6 | B | 5.8 | B |
| Bottom | 0.9 | B | 16.4 | B | 2.3 | B |
Comparing data from WSP to Mylar Samplers
There was a correlation between the % area coverage detected using WSP and the tracer recovered from the Mylar samplers. Deposit density provides valuable information about the distribution of spray over the target surface but does not always correlate with % area covered, and it is therefore omitted from this comparison. When we plot the average % area covered from the adaxial WSP against the average % applied rate ac-1 from the Mylar samplers, we see the same near-linear pattern of decay with depth (Figure 8).
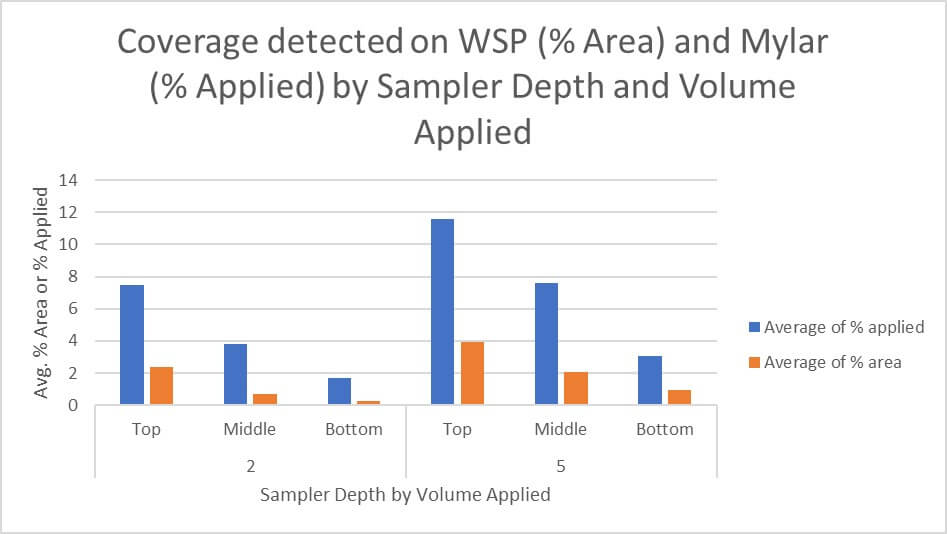
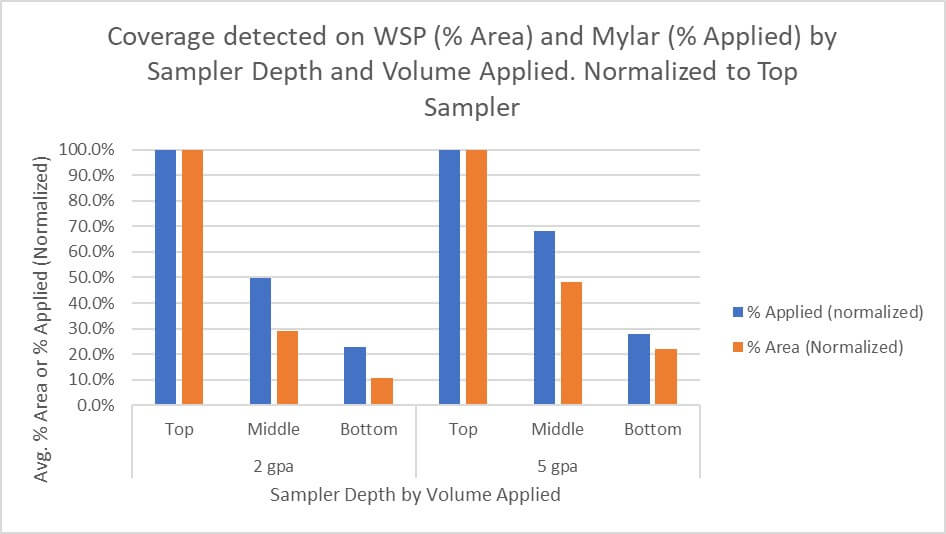
If we assume each top, adaxial sampler (irrespective of sampler material) represents the highest degree of coverage, we can assign it a value of 100% and index the data to this value. This allows us to visualize and compare the two sampler types directly (Figure 9) and illustrates similar relative coverage, but perhaps a greater rate of decay for the WSP.
Net Revenue and Disease Pressure
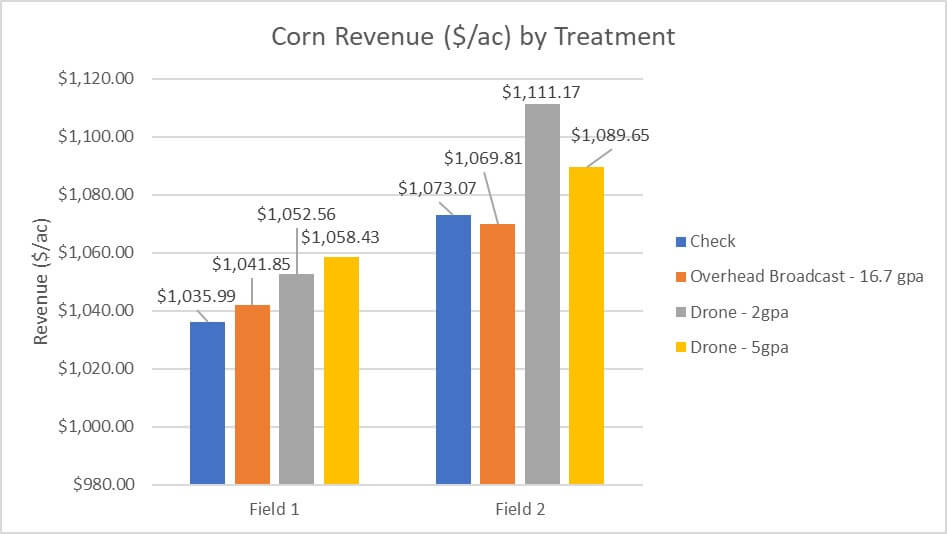
Crops were harvested at the R4 stage of development. There was no disease pressure detected in any field and no clear impact of application method on net revenue (Figure 10). Results based on the following formula: (CAD $/ac) = (Seed Yield × Corn Sale Price) – Drying Cost. No conclusions regarding efficacy can be drawn from this data.
Key Observations
- Water Sensitive Paper (WSP) measurements of percent area covered (% area) and deposit density (deposits cm-2), and Mylar samplers measuring mass deposit (% applied rate ac-1), revealed similar coverage patterns, making both samplers viable methods for RPAS coverage analysis. These are complimentary methods that reveal different aspects of coverage. When possible, they should be used simultaneously to produce a more complete analysis.
- RPAS and conventional overhead broadcast applications produced similar deposition patterns in the corn canopy: A negative linear relationship between coverage and adaxial sampler depth was observed for most treatments (r2=0.997) and abaxial coverage was very low or more often, nonexistent. Further, overall coverage shared a direct relationship with volume for RPAS and conventional overhead broadcast applications.
- Directed applications in this study employed a finer spray quality, released laterally from within the canopy. This produced a different coverage pattern than the RPAS and overhead broadcast applications. Per WSP, this treatment resulted in the highest overall deposit density and was the only treatment to produce significant deposition on abaxial surfaces.
- For RPAS, spray coverage was significantly reduced by -58% (based on avg. applied rate ac-1), by -59% (based on avg. % covered) and by -74% (based on avg. deposits cm-2) and drift was significantly increased by +73% for the 2 gpa treatments versus the 5 gpa. We attribute this primarily to drone travel speed, which increased from 3.3 m/s at 5 gpa to 7 m/s at 2 gpa. For context, and with certain exceptions, travel speed shares a negative relationship with spray coverage and a direct relationship with drift in airblast and field sprayer applications.
- There was a “field effect” where field 2 had lower overall RPAS coverage for both 2 and 5 gpa treatments. Compared to field 1, by -28% for the 2 gpa treatment, and by -41% for 5 gpa. Average drift increased by +76% for 2 gpa and by +77% for 5 gpa. We attribute this to the significantly higher wind conditions in field 2.
- Given the lack of disease pressure in the two fields, and the lack of any significant difference in revenue by treatment within each field, efficacy is inconclusive. This study represented only two of eight fields in a larger RPAS efficacy trial where five locations had disease pressure high enough to rate. Preliminary results suggest that Tar Spot control from a 5 gpa drone application may be comparable to that of a 16.7 gpa overhead broadcast application from a field sprayer (data not shown).
Summary
Drone and conventional overhead broadcast treatments deposited spray in a similar pattern (a negative linear relationship with canopy depth and very low or no abaxial coverage), irrespective of the method used to analyze coverage. RPAS produced significantly lower coverage than the conventional overhead broadcast treatment, which is attributed primarily to the low volumes employed, per the direct relationship between volume applied and overall coverage (up to some point of diminishing return). High ambient windspeed significantly increased drift in both the 2 and 5 gpa conditions and reduced spray coverage. High travel speeds (required to apply 2 gpa) likely contributed to the significantly increased drift and reduced coverage in that treatment versus 5 gpa. For the use cases explored in this study, low volumes and high travel speeds are not advisable for RPAS, particularly in high wind conditions. Future work separating the travel speed and ambient wind speed variables would clarify their relative influence on RPAS drift and coverage.
This video presentation is covers the highlights of the study. And disregard the verbal slip-up: we didn’t travel 110 mph.