Calibration is a fundamental step in any spray application. To apply the correct product rate, we need to know how much liquid per unit land area is deposited under the sprayer.
To conduct the calculations, either manually or through the drone software, we need to know the width of the spray swath. This task requires the operation of the sprayer under typical conditions, some kind of sampler capture the spray deposit, and a means of quantifying that deposit so the spray pattern becomes apparent. Here’s how we do it:
1. Confirm the accuracy of the flow meter
Drones don’t typically report the spray pressure of the spray mix. Instead, they report the flow rate using a built-in flow meter. The drone maintains the desired application rate by using the flow rate to adjust pump speed and engage nozzles over a range of travel speeds. Because everything depends on the flow meter, its accuracy needs to be verified.
- Fill the spray tank with clean water and flush all the lines.
- Install nozzles required for task, ensuring all nozzles are identical and in good working order.
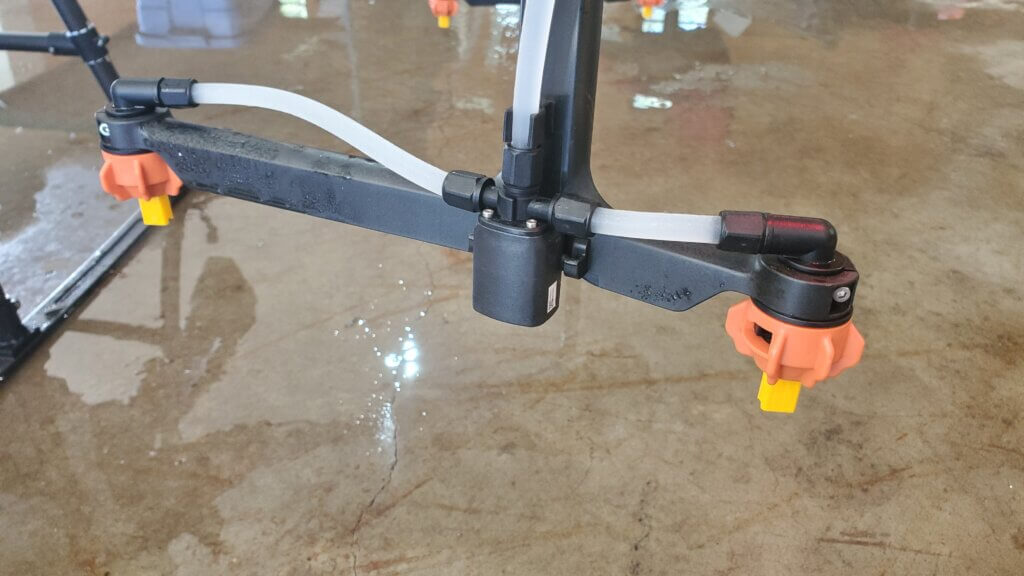
- Select the nozzle size you installed on the spray monitor.
- Purge the air from the system.
- Activate the spray and wait for the flow rate to stabilize on the spray monitor. This may take a few moments.
- With the nozzles flowing, place collectors under each nozzle and collect the spray liquid for a fixed time, say one minute.
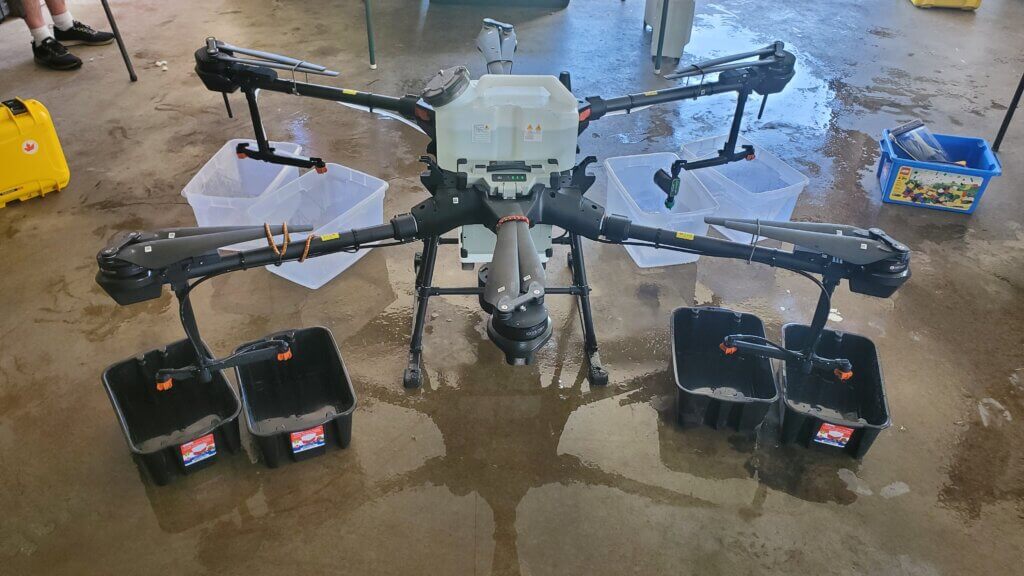
- Ensure the collector catches all the spray. Buckets often create turbulence. Rotary atomizers make this more difficult.
- When the time elapses, remove the collectors and then shut off the spray.
- Unless the shutoff is very fast and positive, leaving the collectors in place during shutoff can introduce error as the flow diminishes.
- Confirm that the volume collected from each nozzle was identical, and that the flow rate reported by the drone flow meter is accurate.
- Repeat to ensure consistency.
2. Measure the effective swath width
Spray swath width is variable. For a measurement to be relevant we must evaluate spray deposition under environmental conditions that are similar to the planned spray operation, as well as use the same operational settings such as altitude, travel speed, nozzle choice, and application volume.
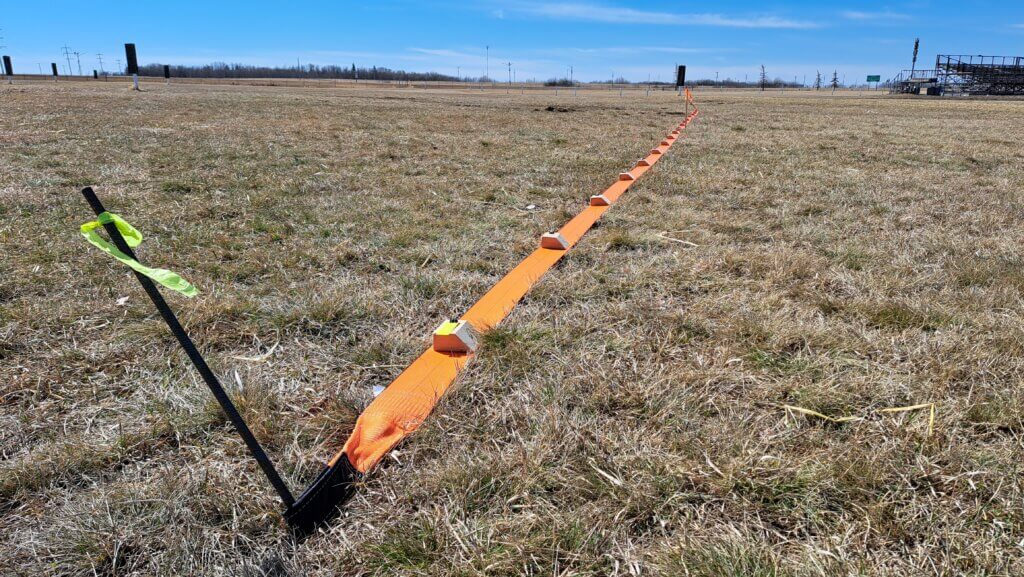
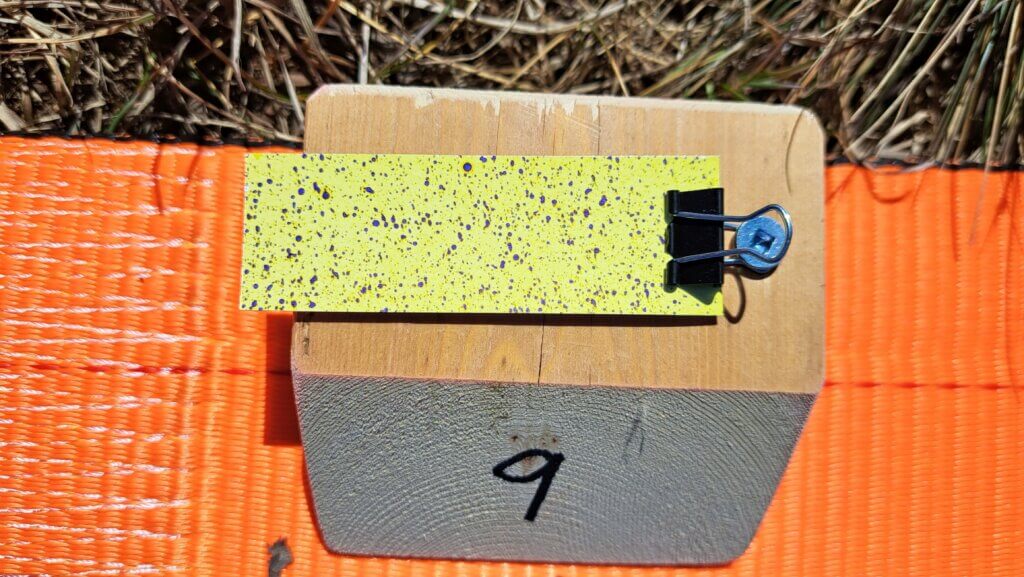
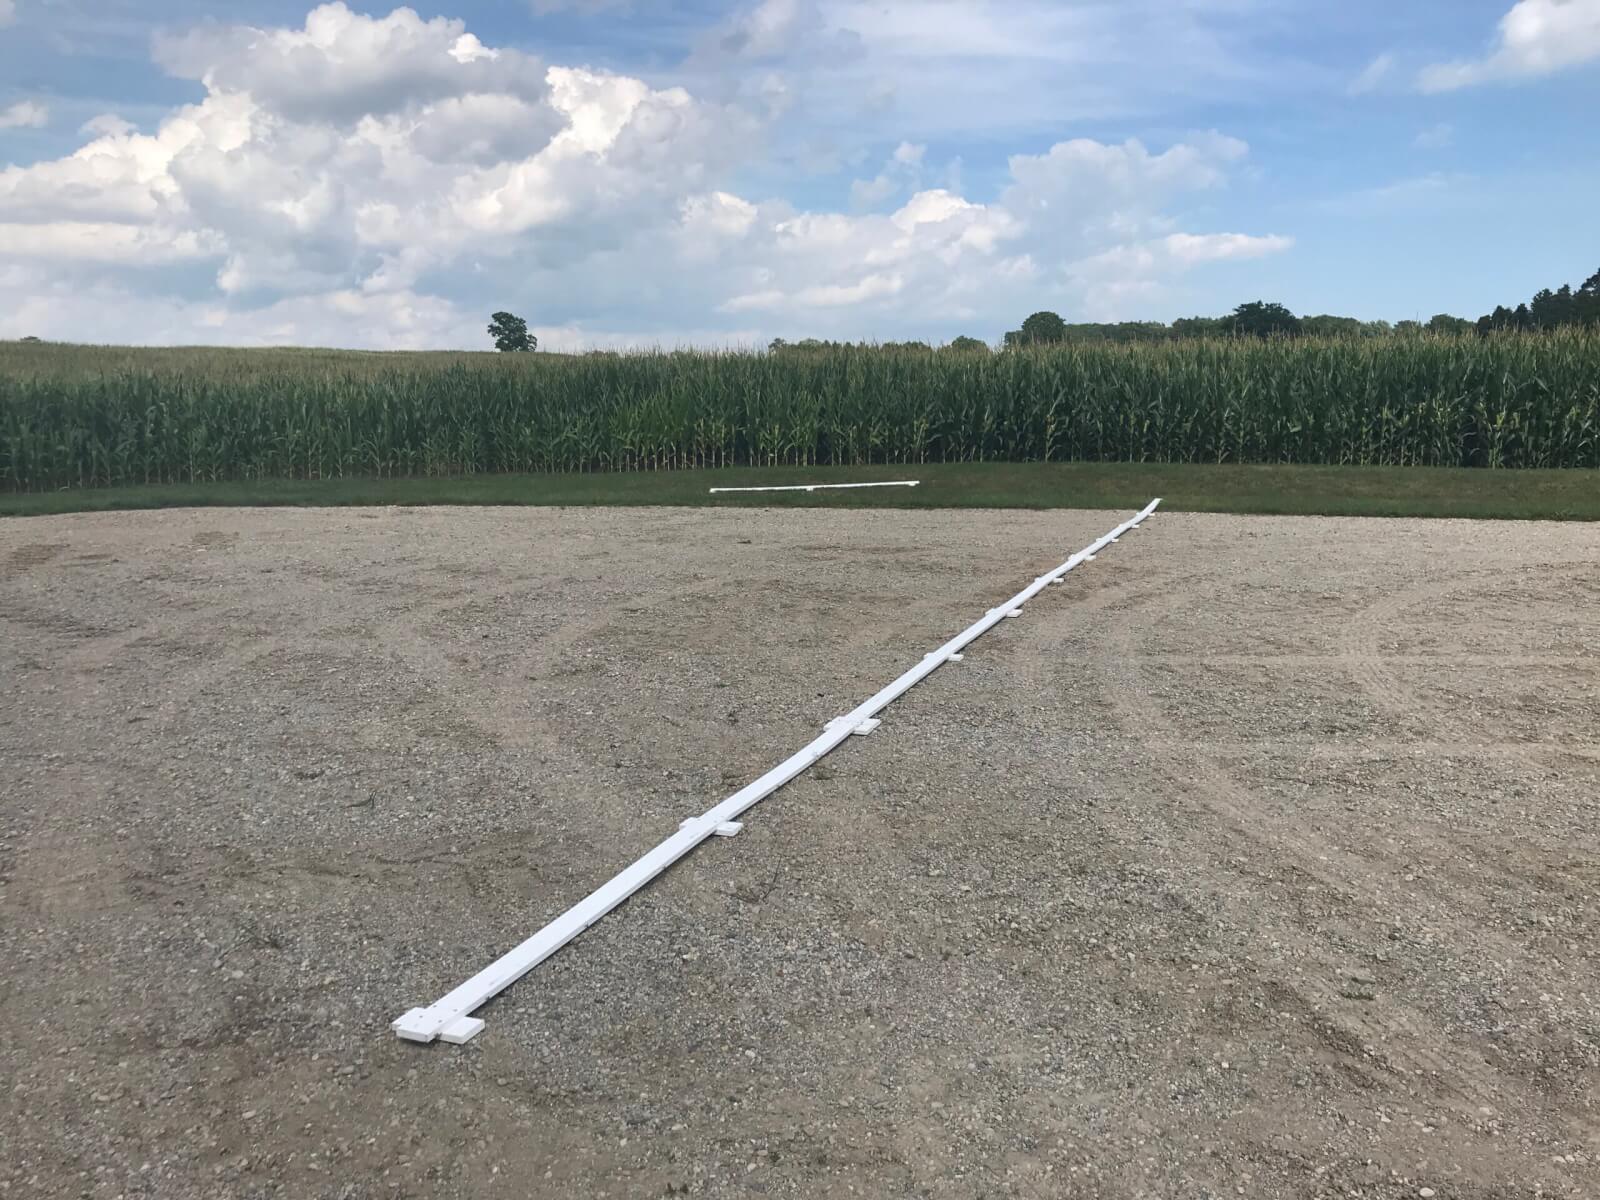
Spray samplers are positioned along the ground, perpendicular to the flight path. We use water-sensitive paper (WSP) because it’s readily available, fast and easy to use, and the deposits can be analyzed visually or using simple apps that calculate coverage. We create a sampling line of WSP positioned a 1 m intervals (or maybe 0.5 m for narrow swaths). The samplers should extend to twice the expected swath width to account for any swath displacement from sidewinds.
- Choose a day with light, consistent winds.
- Find an open space free of obstruction in the direction of the prevailing wind.
- Install a weather station to document conditions during flight.
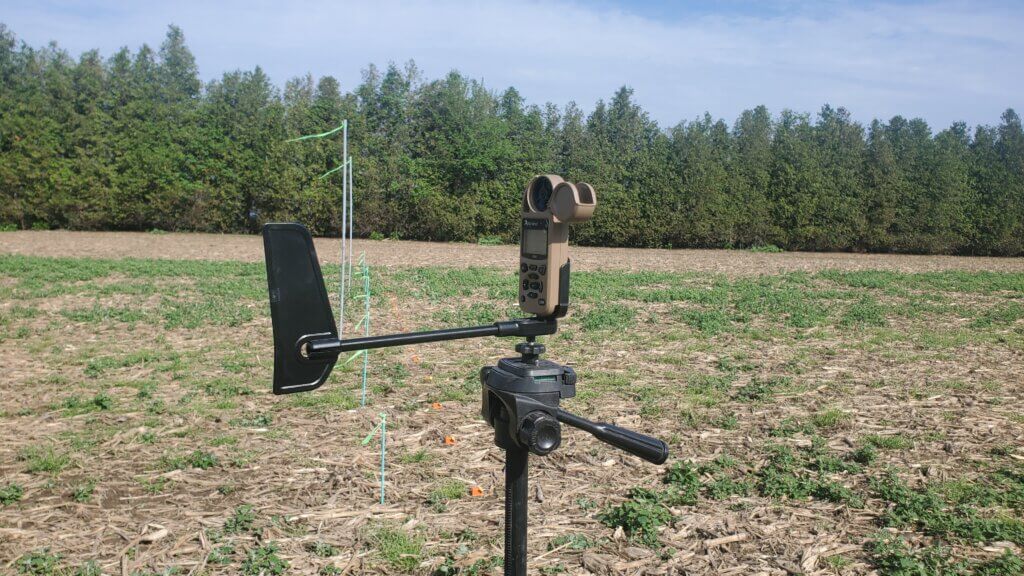
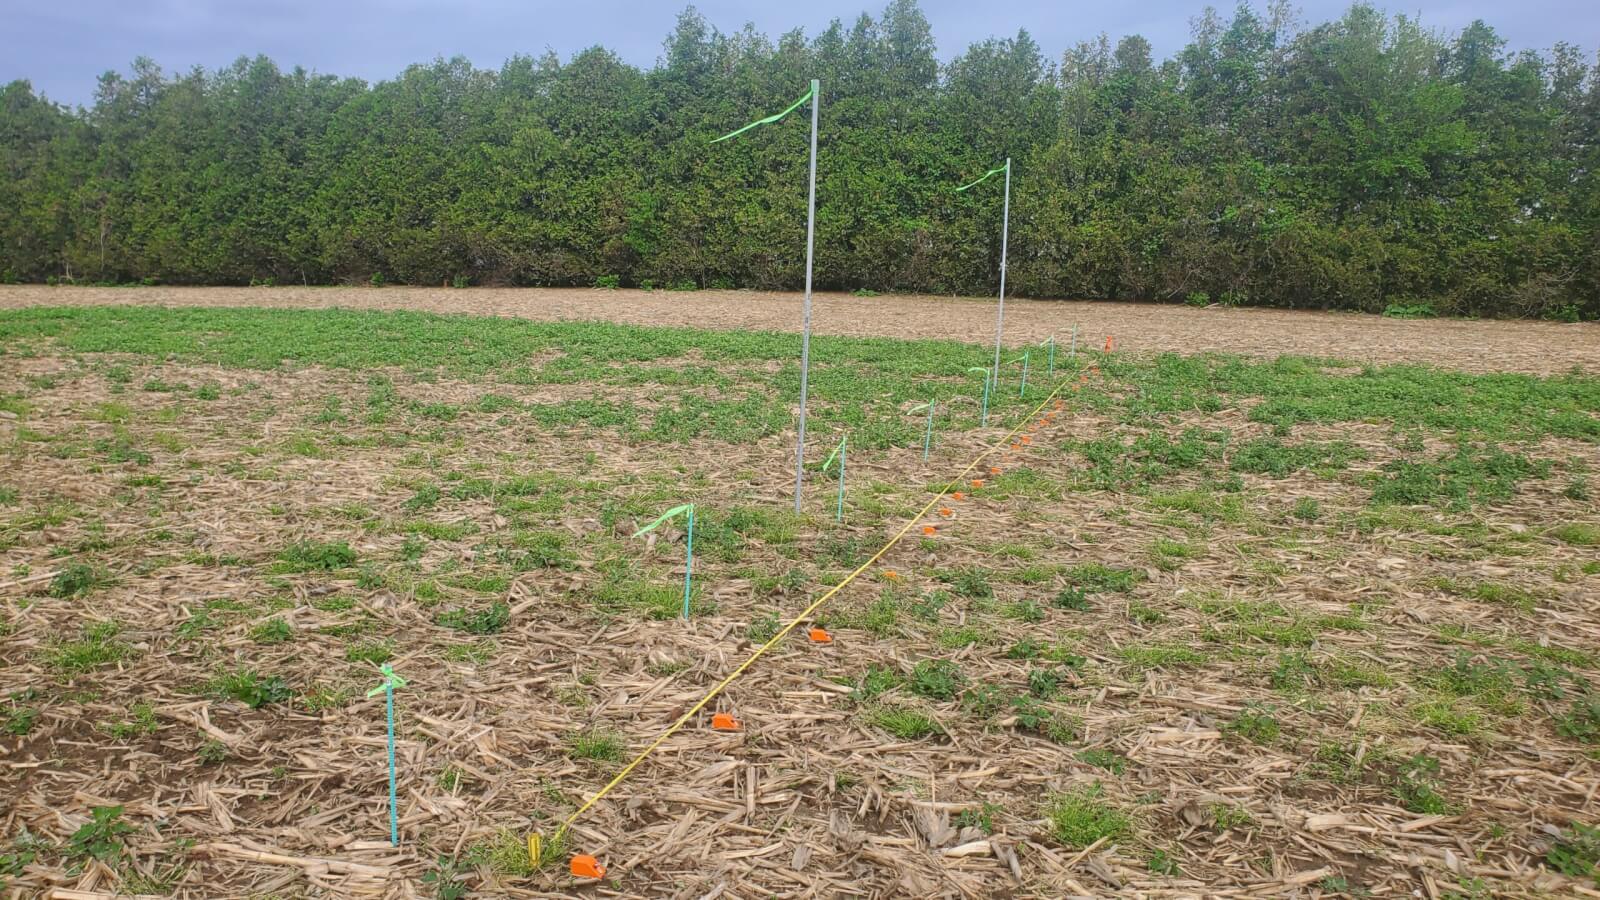
- Mark an approximately 200 m long flight line into the prevailing wind direction by placing wire flags every 50 m.
- At the 150 m mark, use wire flags to centre a sampler line perpendicular to the flight path. Sampler line length should be about twice the expected swath width.
- Wooden blocks with paper clips can be used to secure WSP at regular intervals along the sampler line.
- Manually fly the drone along the entire flight line. The spray pressure, flow rate and altitude of the drone should be stable before it reaches the sampler line (generally takes about 5 seconds).
- Fly 50 m past the sampling line without any drone maneuvering to avoid affecting the deposit.
- Land the drone and walk along the sampler line.
- Note the deposits in the central region. Walk along line as the deposits taper off, looking for deposits that are approximately 50% of the average central deposits.
- Estimate the distance between these deposits on both edges of the swath. This is the estimated swath width that can be entered for the second flight.
- Replace the WSP with a fresh set and repeat the flight two more times.
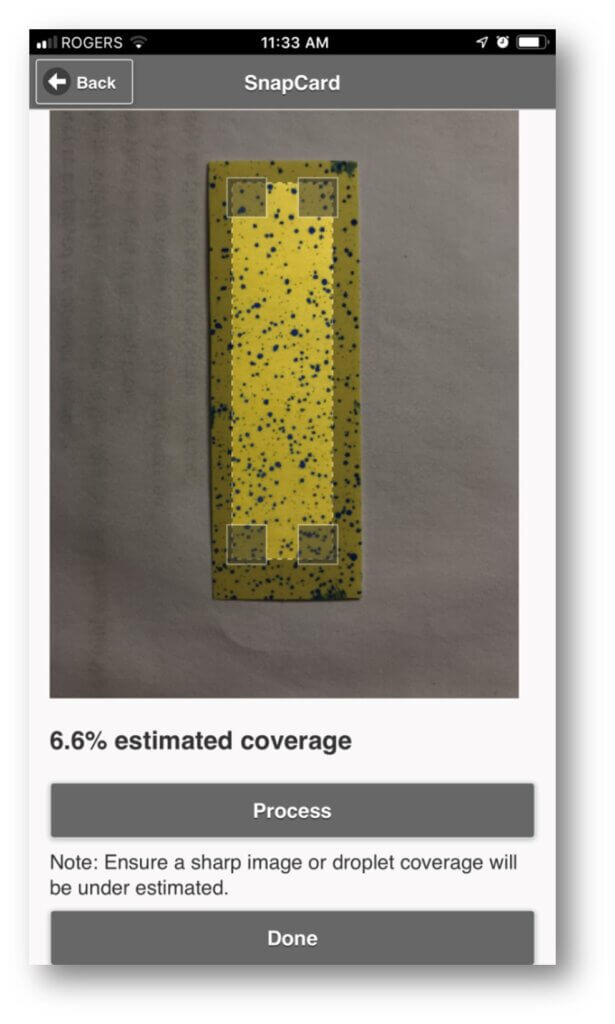
Establishing the effective swath width is critical to the proper operation of the drone, so a more detailed analysis of deposit uniformity is needed to ensure best performance. A simple tool for quantifying the deposit on WSP is the SnapCard app. It calculates the percent coverage and can be used to assess the relative deposit on each card.
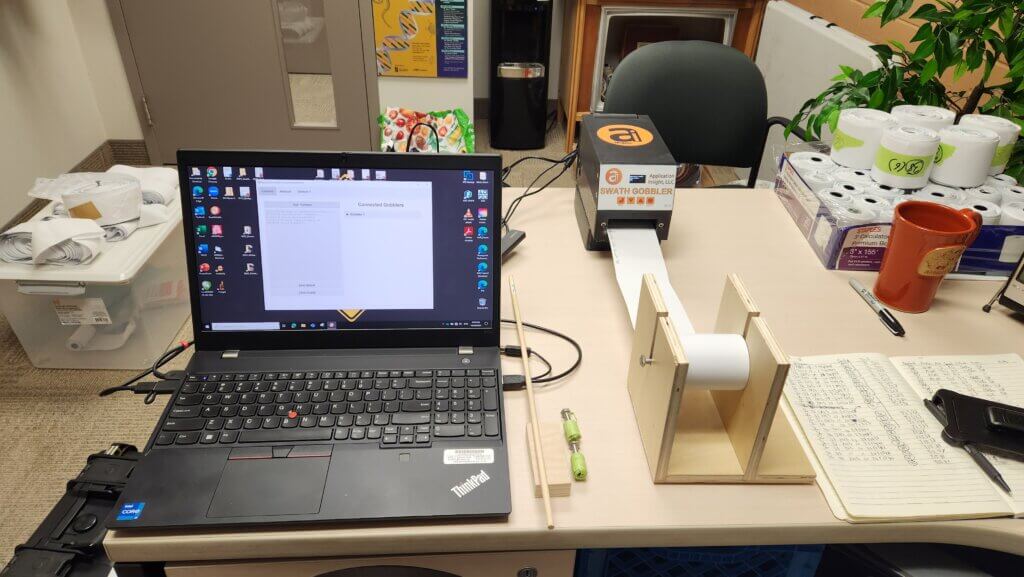
Other methods perform a more advanced assessment by analyzing the entire swath, and not just intervals. These methods use dyes and dedicated hardware to quantify the deposits along strings or paper samplers.
3. Analyze the Pattern
The nearest approximation for drone swathing is that of a manned aircraft. The spray pattern of an aircraft is tapered, meaning the highest deposition is near the centre of the swath, and the edges of the swath fade to zero deposit. In order to achieve consistent coverage, we need the edges of the spray swath to overlap so the cumulative coverage at the edges is closer to that in the centre. Too little overlap leaves gaps and too much overlap results in excessive deposit.
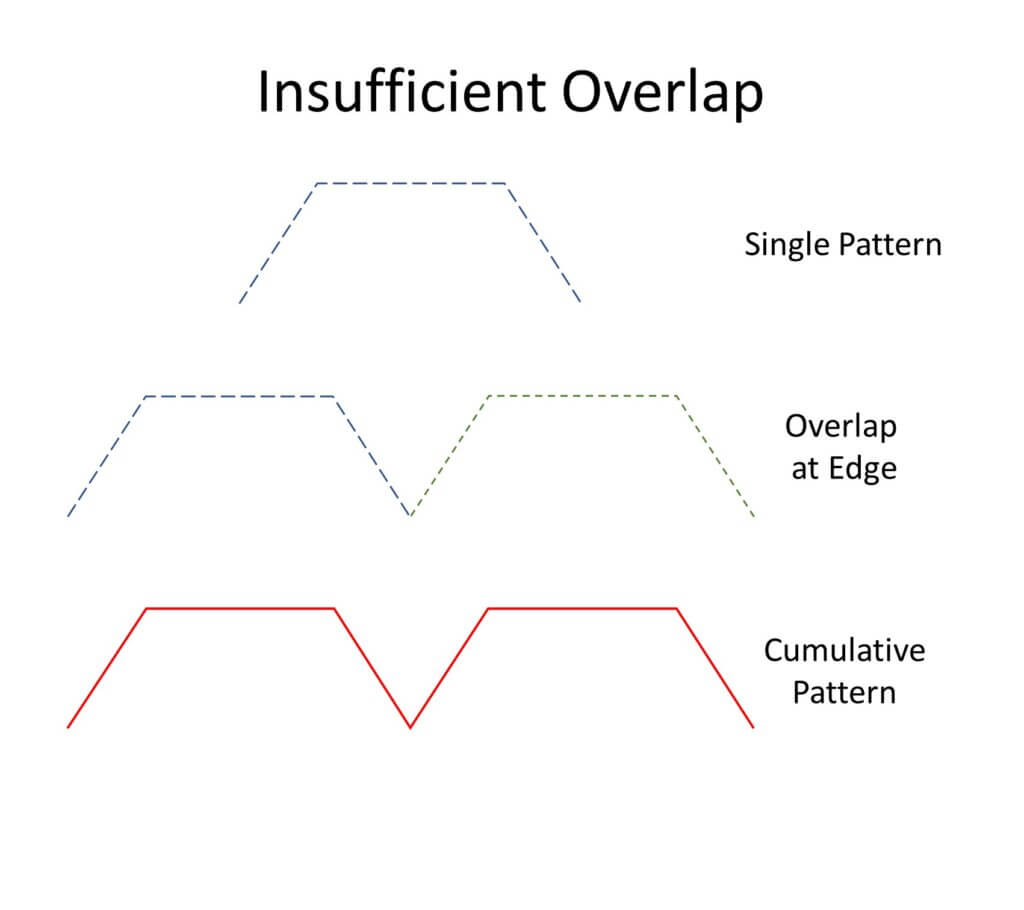
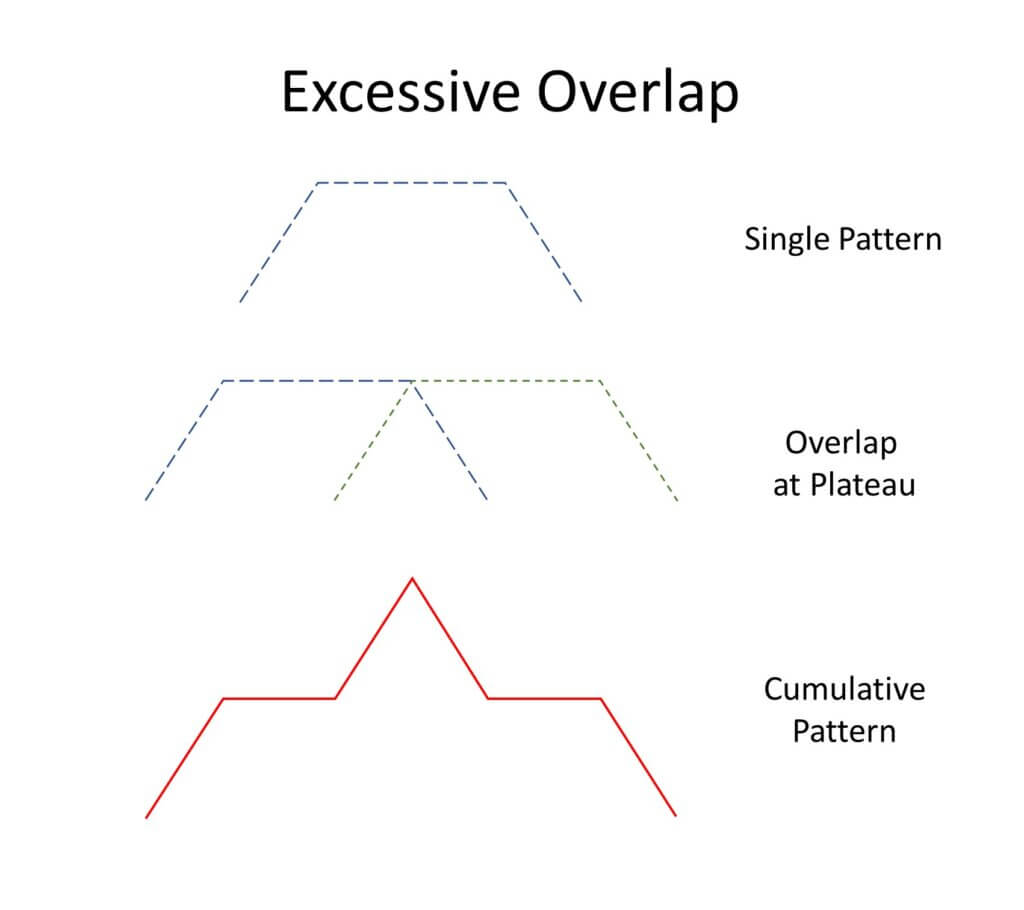
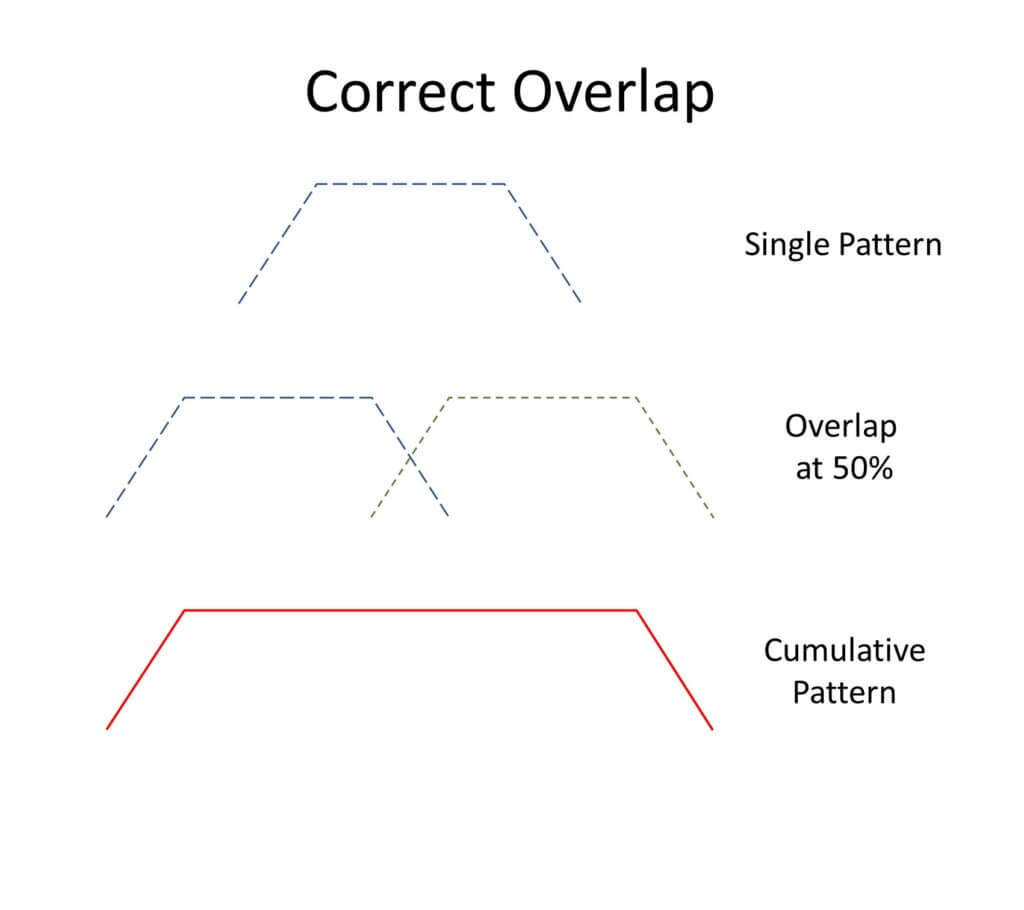
Deposits from drones can be highly variable. The challenge is to find an overlap distance that minimizes this variability, minimizes both over- and under-application, and maximizes swath width. Download a copy of our Excel spreadsheet to help you with this process.
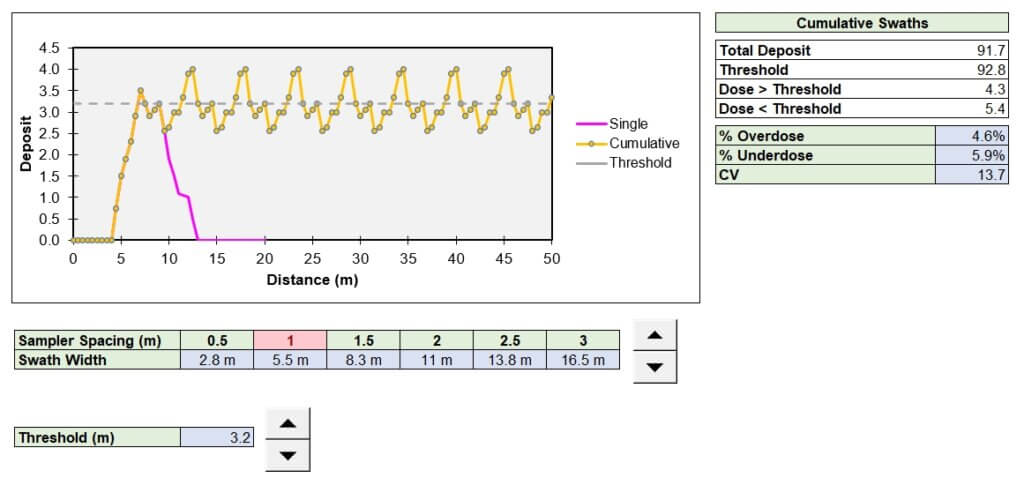
The first step is to estimate a reasonable average deposit, called “Threshold”. Graph the deposits from each sampler, and estimate a point on the Y axis (Relative Deposition) that represents the average maximum deposit. This could be the maximum value of the plateau, or a midpoint between the maximum and a nearby dip. This is the Threshold. We then take 50% of this estimated average deposit, and find the two distances on the X axis (Sampler Locations) that intersect the curve at these points. The distance between these two points is our first estimate of the swath width. If two adjacent swaths are spaced so the edge of one overlaps 50% with the next, the overall cumulative deposit should be relatively even.
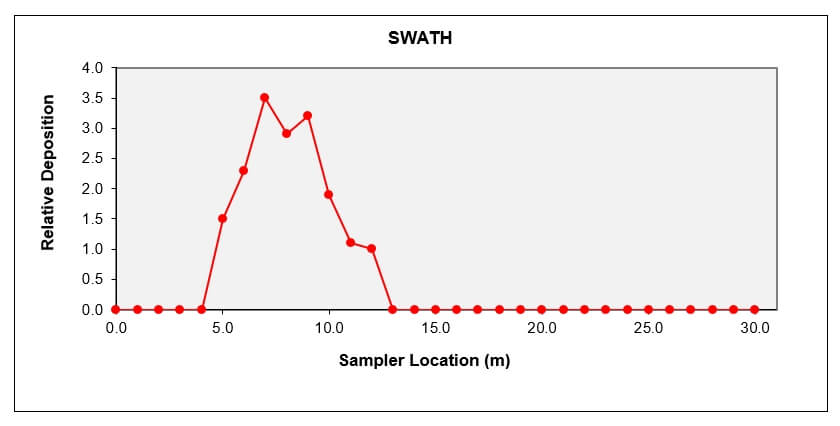
We can alter the amount of overlap to improve the apparent uniformity, but be cautious. For example, even though we can often improve the uniformity by narrowing the swath width, this can add deposit to the area under the drone and raise the overall deposit amount. Plus, the narrower swath also lowers the productivity of the drone. Use the Excel model to establish a swath width that has the lowest variability (Coefficient of Variability or CV) AND results in a balance between over- and under-dosing.
Operational settings affect swath width
Swath width is affected by altitude, speed, water volume and spray quality. Generally, higher altitudes, lower volumes, and finer sprays will result in a wider swath. Unfortunately, the same configuration also results in greater drift. It is recommended that swath widths be determined for each spray volume and nozzle arrangement that will be used.
Drones will be applying low water volumes and this requires a critical assessment of coverage to ensure the deposit density is sufficient to achieve the desired result. A low volume will require a finer spray for minimum coverage to be realized. Coarser sprays that reduce drift and evaporation will need higher water volumes and result in narrower swaths. Significant time may need to be invested to understand the effects of operational settings and environmental conditions on spray deposit uniformity and swath width.
Additional pointers
Here are a few tips and tricks to help you be successful when calibrating your drone.
- Drone patterns will have deposit peaks and valleys in the central region. Repeated runs are needed to confirm that these are real and persistent. If so, then adjustments in flying height, spray quality, or water volume may be needed to eliminate them.
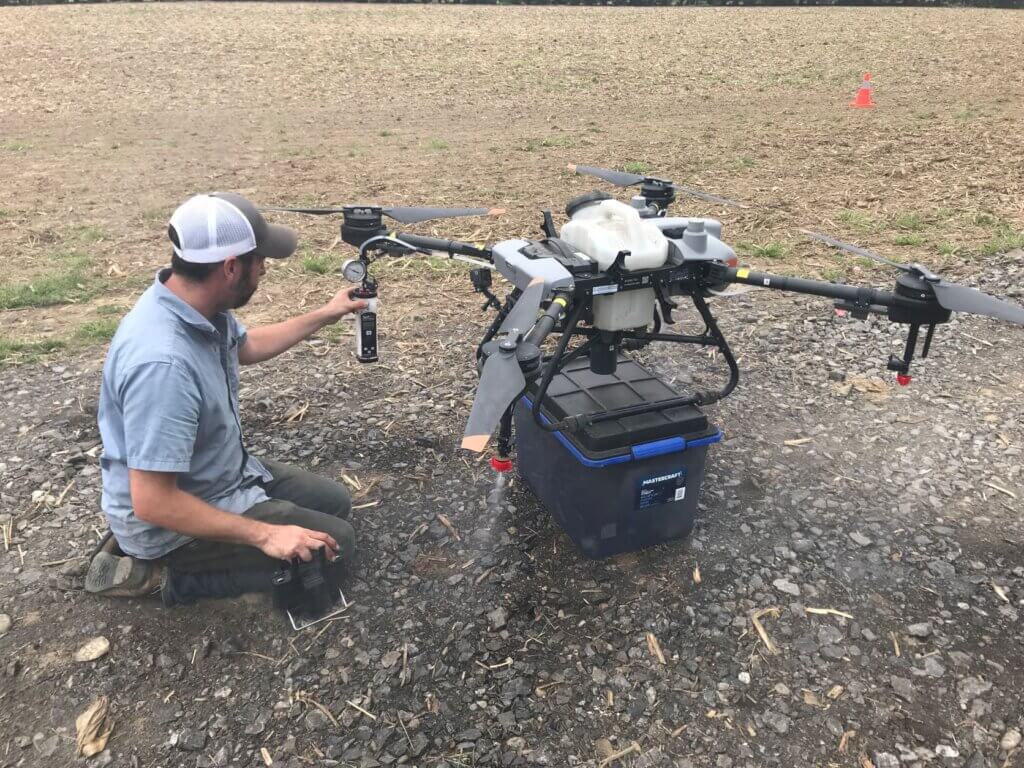
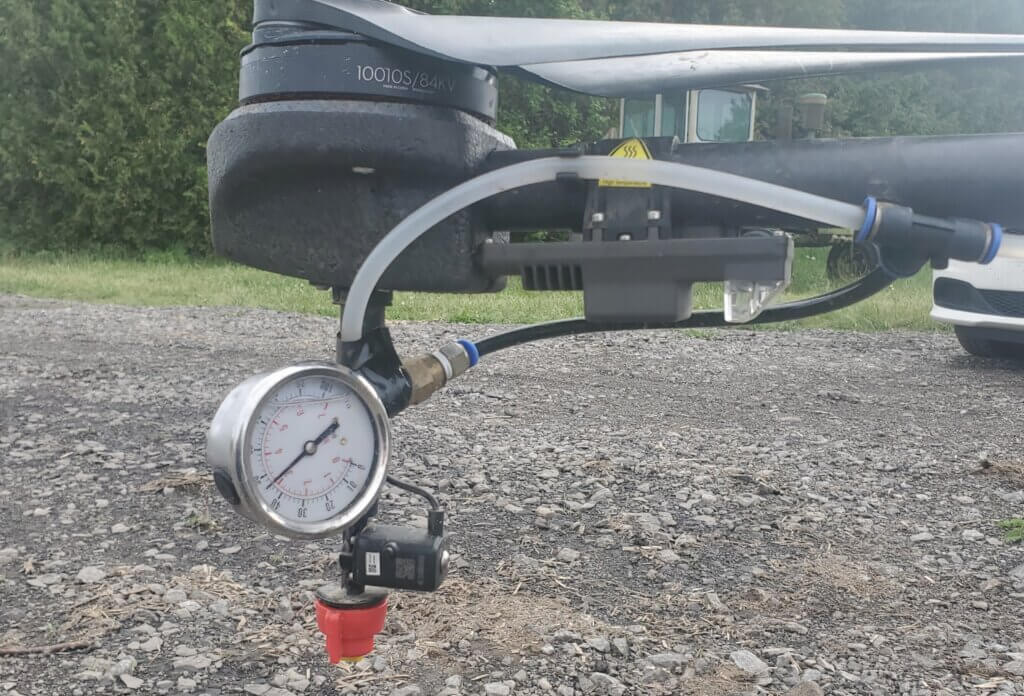
- The absence of pressure gauges on drones can be corrected by installing an analog gauge in-line with one of the spray nozzles. If may be necessary to mount an auxiliary camera on the drone to record this gauge. We have observed strong fluctuations in spray pressure, particularly on starting a spray swath, that were not reflected in the reported flow rate.
- Many drones have the option of recording the flight screen during a mission. This will provide a record of the performance of the drone, and can be valuable should performance problems arise.
- Although swath width calibration is done by flying into a headwind, the actual spray application should be done with a side wind. Start at the downwind edge of the field and turn into the wind. The drone is symmetrical and the tapered spray patterns should equalize the deposits. Alternately, flying into a headwind and returning with a tailwind can alter the aerodynamics of the spray deposition process.
Drone spraying will walk a razor’s edge of sorts – there is little room for error when using scant water and fine droplets. Getting the basics right has never been more important.