- Drone (50 L/ha) produced similar or slightly higher percent coverage than helicopter, with 64% higher deposit density.
- Higher drone ground speed did not change percent area covered but reduced deposit density, increased stain diameter, and likely increased drift.
- Higher application volume increased coverage; field sprayer at 175 L/ha achieved much greater wheat head coverage than 50 L/ha aerial applications.
- Downwash, dwell time, and wheat movement influence coverage and product placement to the head, but their exact relationships remain unclear.
This text was generated by OpenAI GPT 5 Mini
Editor’s Note: This work was performed in 2023. A more recent exploration into wheat head coverage was performed in 2025. This article is not obsolete as it introduces concepts and makes foundational observations. Read on, then read the 2025 article afterwards.
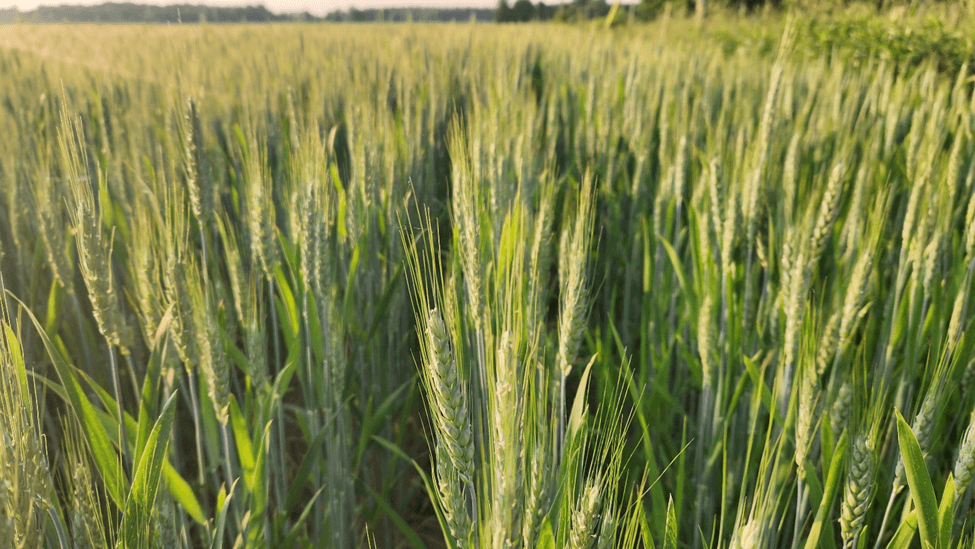
Fusarium head blight is one of the most economically important diseases in winter wheat. Application timing is arguably the most critical aspect of effective crop protection. The application window stretches some two to five days following the point where 75% of the wheat heads are fully emerged and coinciding with the beginning of flowering (Figure 1). Product placement is the second most critical aspect, where the wheat head represents the primary target, and the flag and penultimate leaf are somewhat incidental, secondary targets.
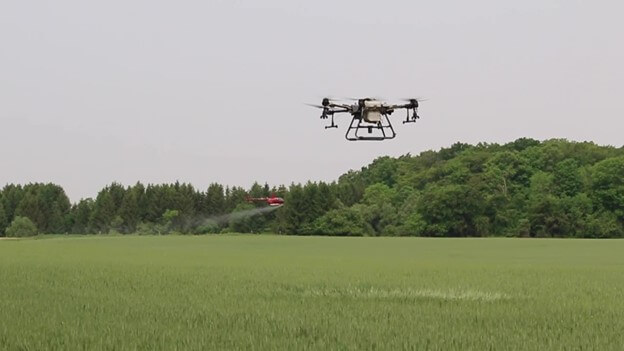
This article describes the results of two experiments exploring wheat head spray coverage from a rotary drone. The first compares wheat head coverage from a drone to that of a helicopter (Figure 2). The second explores the effect of drone ground speed, and the related downwash, on wheat head coverage. All work was performed under PMRA research authorization. As of the date of this publication, there are no crop protection products permitted for application by RPAS in Canada.
Experimental Design
Wheat field
The wheat field was clay/loam located at 42°47’12.6″N 81°03’06.4″W near New Sarum, Ontario. Wheat was “common seed” planted on October 2nd, 2022, at 1.8 million seed/ac on 19 cm (7.5 in) row spacing. It was sprayed on June 5th, 2023, and at the time the wheat heads were about 0.7 m (2.5 ft) high.
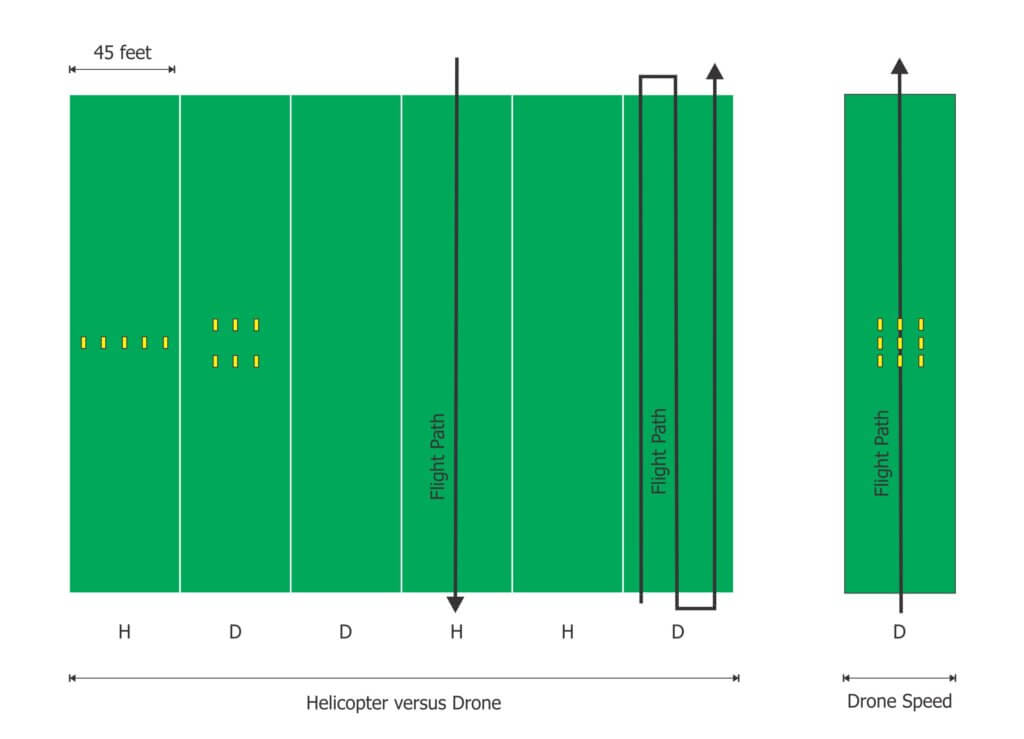
Treatments were laid out parallel with the planting direction in a randomized design. The helicopter pilot reported an effective swath width of 13.7 m (45 ft), which formed the basis for the treatment block widths (Figure 3). The helicopter made a single pass. The drone pilot reported an effective swath width of 4.5 m (14.75 ft). It made three passes per treatment block in the helicopter versus drone experiment but made only a single pass centred on the treatment block for the speed experiment.
Both the helicopter and drone applied fungicide at label rate plus 0.125% Activate in a final volume of 50 L/ha (5 gpa). For the helicopter this was about 20 ac. per jug, and for the drone we created an equivalent tank mix using 450 ml fungicide and 37.75 ml Activate diluted with water to fill the 30 L spray tank.
Helicopter versus drone experiment
For the helicopter treatments, five water sensitive papers (WSP) were spaced 1.75 m (5.75 ft) apart, centred on the treatment block. For the rotary drone passes, two rows of WSP were spaced 1.75 m (5.75 ft) apart, centred on the treatment block. Application volume was 50 L/ha (5 gpa)
The helicopter had a 20 foot boom with CP-03-05 nozzles on 12” spacing, alternating between a 0.062 (smallest) orifice and a 0.172 (largest) orifice. Ground speed was 96.5 km/h (60 mph) and altitude ranged from 1.5-3 m (5-10 ft) above the wheat heads. The contractor company calibrated the helicopter according to their standard operating practices.
The rotary drone was a DJI Agras T30 equipped with TeeJet TT110015’s. It flew at 5.1 m/s at 3 m above the wheat heads and applied three adjacent swaths of 4.5 m. The contractor company calibrated the drone according to their standard operating practices. A similar methodology can be found here.
Drone speed experiment
A single pass was made over three rows of WSP spaced 1.75 m apart, centred on the treatment block. The drone made two separate passes (n=2) for each speed. Samplers were retrieved and replaced after each pass and the same plot was used for all six passes. Application volume was 30 L/ha (3 gpa). Drone was refilled after every two passes to maintain a consistent weight.
The rotary drone was a DJI Agras T40 programmed to apply an “Extra Coarse” spray quality at 3.5 m above the wheat heads with a swath width of 9 m. Ground speeds were 2 m/s, 4 m/s and 7.2 m/s and were visually confirmed by the RPAS controller. Once again, the contractor company calibrated the drone according to their standard operating practices.
Target Locations
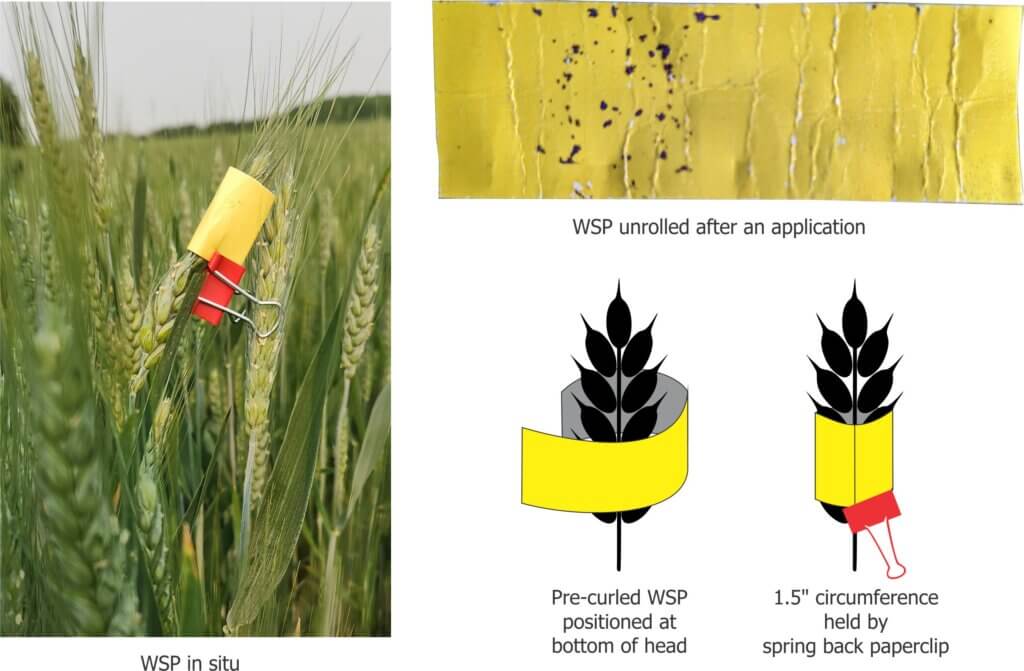
For both experiments, SpotOn brand WSP from the same production run was pre-curled by wrapping it around a pencil, then wrapped around the wheat head and secured at the bottom by a small, spring back paper clip (Figure 4). This left approximately 1.5 x 1 inches (i.e. half) of the surface exposed to spray and provided an indication of panoramic coverage.
The clip distorted the target by flattening it at the bottom and obscured a small portion of the target area, but this area was digitally removed during the analysis. By securing the WSP to the wheat head rather than a surrogate stake, the target moved naturally in the downwash of the drone. The papers were retrieved when dry, placed in individual plastic bags, flattened for scanning, and digitized using a DropScope within 24 hours of retrieval.
Weather and Application Times
Weather data was collected using a Kestrel 3550AG weather meter (Kestrel Instruments) in a vane mount positioned 1.5 m (5 ft) above the wheat heads. Wind speed fluctuated throughout the day, but wind direction remained relatively stable at 90 degrees to the flight path. Targets remained within the swath, despite any offset, as indicated by the consistent coverage observed on the windward WSP compared to other, downwind samplers in each pass.
| Application method | Pass # | Time | Windspeed (km/h) | Temperature (°C) |
| Helicopter | 1 | 8:45 | 2.0 | 17.0 |
| Helicopter | 2 | 10:00 | 4.5 | 17.7 |
| Helicopter | 3 | 10:20 | 4.8 | 19.9 |
| Agras T30 | 1 | 10:20 | 4.8 | 19.9 |
| Agras T30 | 2 | 10:45 | 5.2 | 19.7 |
| Agras T30 | 3 | 11:00 | 8.6 | 20.0 |
| Agras T40 | 1 | 12:25 | 8.2 | 21.6 |
| Agras T40 | 2 | 13:00 | 4.8 | 22.4 |
| Agras T40 | 3 | 13:30 | 5.2 | 22.8 |
Results and Analysis
WSP were scanned and digitized. Coverage was measured as percent surface covered (% area), and deposit density (# deposits/cm2). Given that only ½ of the WSP was exposed to spray, and the remining half was obscured during the wrapping process, the entire card was scanned, and the resulting coverage was doubled.
Helicopter versus drone experiment
For each helicopter pass, a single line of five WSP were averaged to a single data point. Therefore, n=3, but represents 15 WSP samplers. For the drone, two lines of three papers were placed in the block. Each line was averaged to a single data point, for n=2 per pass x 3 passes for a total of n=6, representing 18 WSP samplers. The following image (Figure 5) shows a digitized WSP typical of each method.
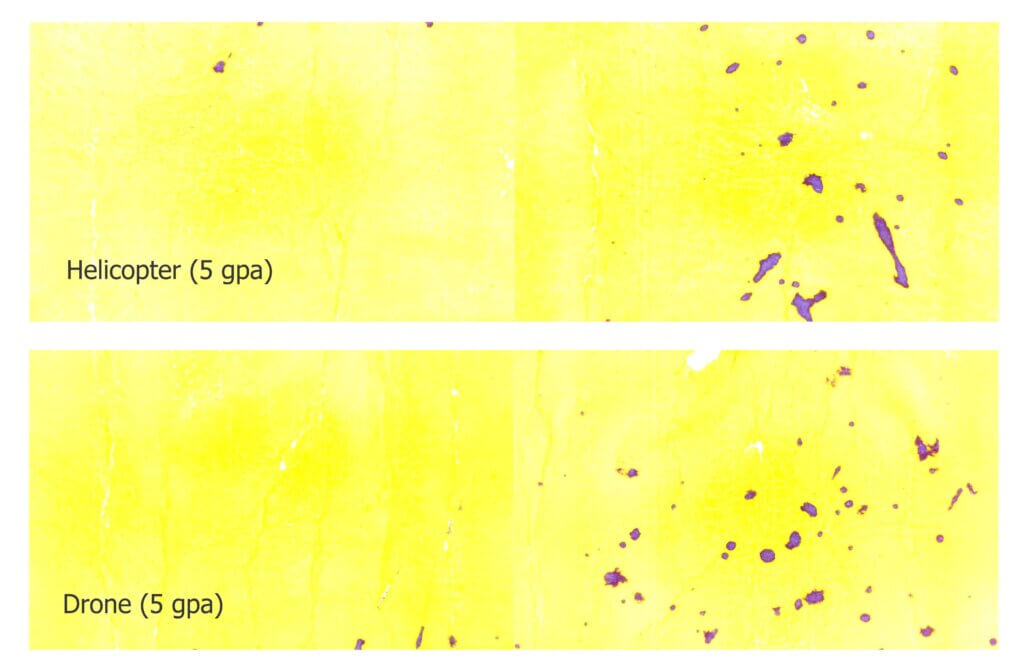
The following histograms (Figure 6 and 7) illustrate the mean coverage for each application method, with standard error.
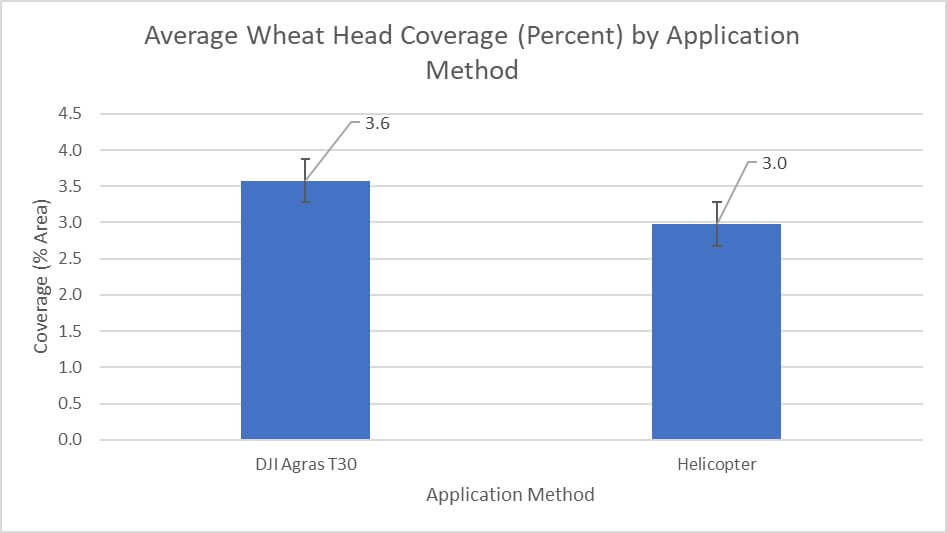
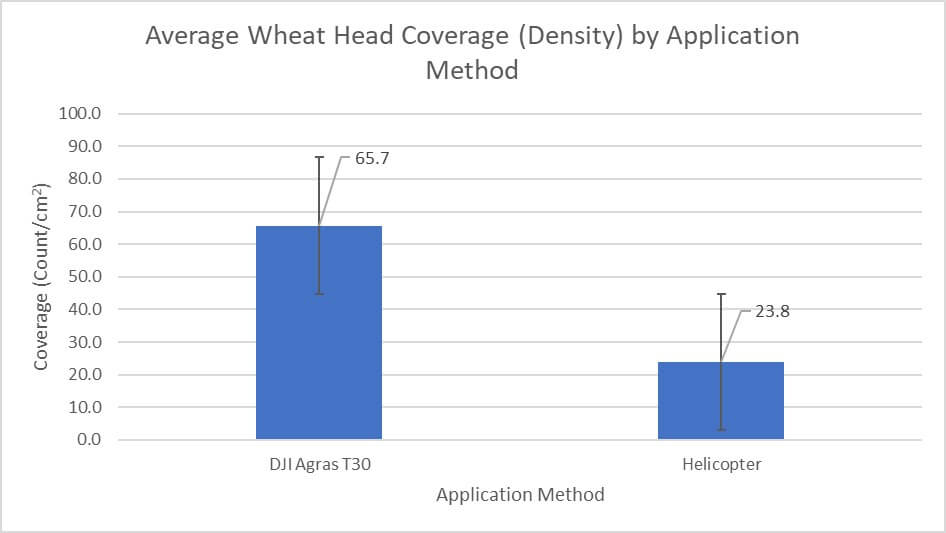
The drone covered an average 17% more surface area than the helicopter. The spray quality was visibly finer, as evidenced by the average 64% higher deposit count. As a matter of context, we ran a similar study four days later with a field sprayer running TeeJet AITTJ60’s on 38 cm (15 in) centres, 50 cm (20 in) above the wheat head. It applied 175 L/ha (19 gpa) compared to the 50 L/ha (5 gpa) applied by the helicopter and drone. The relative percent area covered is shown in Figure 8.
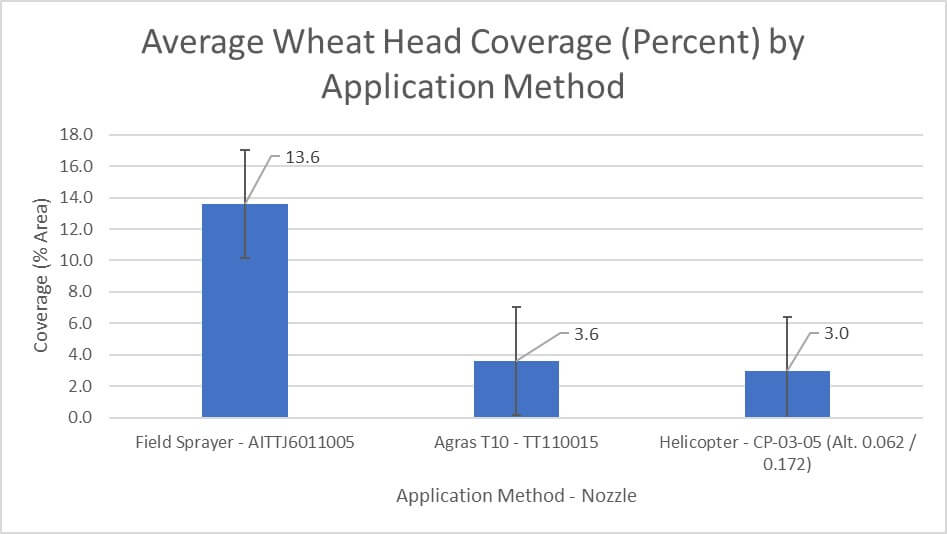
The more than fourfold difference in coverage from ground versus aerial application is significant, but given the relative concentrations of product applied (i.e. the same product rate) residue levels would likely prove equivalent for all treatments. Fungicide efficacy cannot be predicted from coverage data, but the convention is that the more surface area covered, the better the protection.
Drone speed experiment
The drone made two separate passes over each treatment block. For each drone pass, three lines of three WSP were placed in the block. Each line of three papers was averaged to create a single data point, for n=3 per pass and n=6 in total. The following histograms (Figures 9 and 10) illustrate the mean coverage for each application method, with standard error.
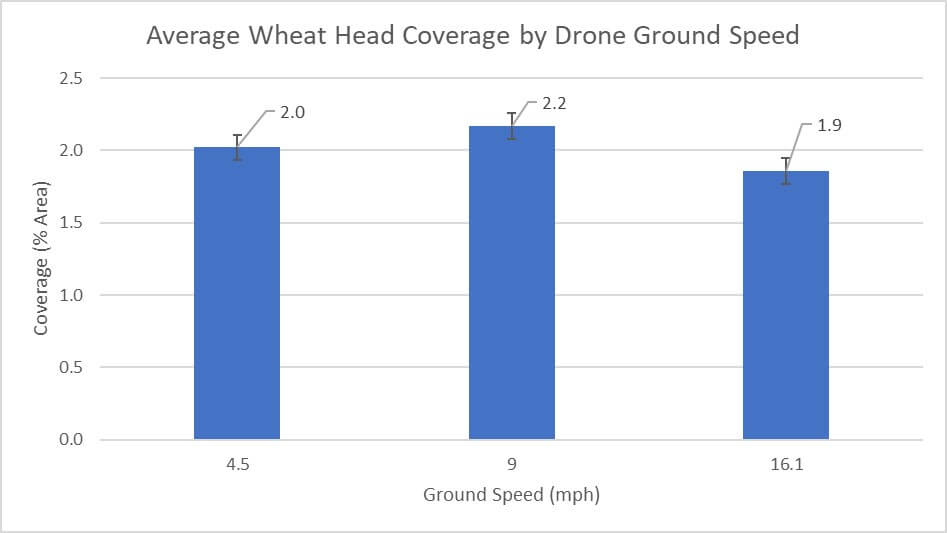
As an aside, note that the average is approximately 2% surface area for these 30 L/ha (3 gpa) applications compared to the 3.6% average at 50 L/ha (5 gpa) in the drove versus helicopter experiment, reflecting the results from many studies that show employing higher water volumes results in improved coverage until some point of diminishing return.
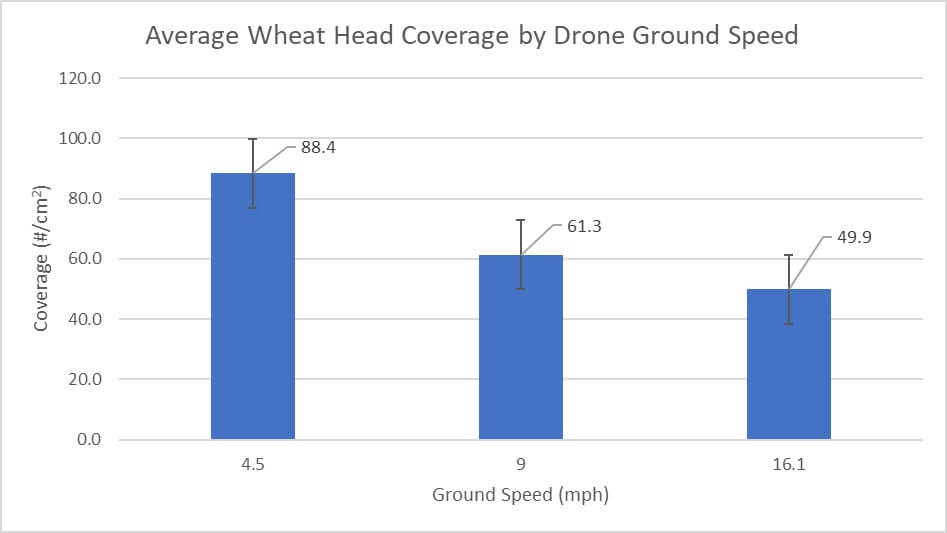
The drone appeared to cover approximately the same surface area at all three speeds. However, when deposit density is considered, the slowest speed deposited 31% more droplets than the medium speed, which in turn deposited 23% more droplets than the fastest speed.
One possibility is that higher speeds, which are known to create wider swaths, dispersed the spray over a larger area. Another possibility is that higher speeds, which are known to increase drift potential, left a greater proportion of droplets aloft, beyond the reach of the samplers. Yet another non-exclusive possibility is that deposit counts increased while overall surface coverage remained approximately equal because the diameter of the stain increased with speed. DropScope reports stain diameter, and this has been graphed alongside the deposit counts in Figure 11.
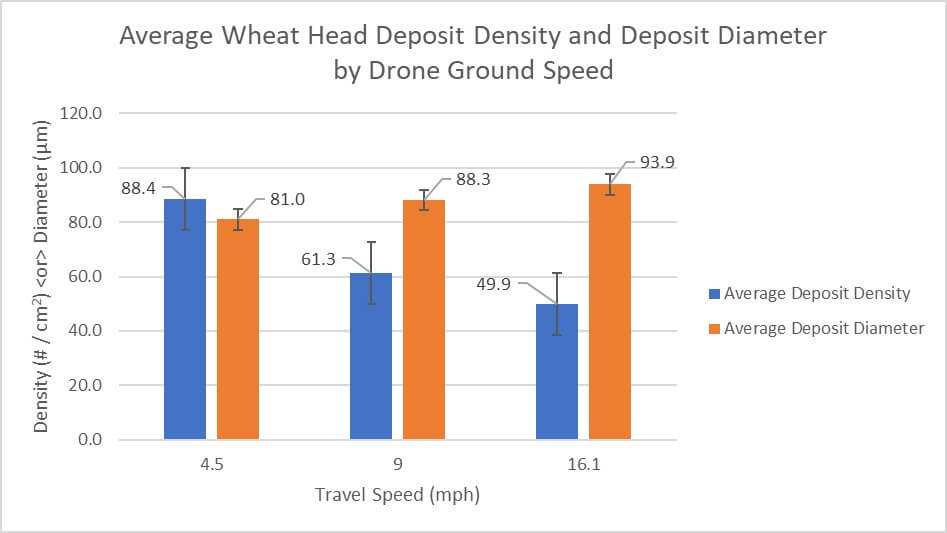
We see an inverse relationship between ground speed and deposit density, but a direct relationship between ground speed and stain diameter. This difference may appear small, but assuming stains are approximately circular, diameter can be used to calculate deposit area, per the following table.
| Drone Ground Speed (mph) | Mean Coverage (%) | Mean Deposit Density (#/cm2) | Mean Stain Diameter (µm) | *Mean Stain Area (µm2) |
| 4.5 | 2.0 | 88.4 | 81 | 5,153.0 |
| 9 | 2.2 | 61.3 | 88.3 | 6,124.0 |
| 16.1 | 1.9 | 49.9 | 93.3 | 6,793.0 |
We see an increase in average deposit area of 16% and 10%, respectively, for each increase in speed. In previous trials conducted in corn in 2022 we saw a decrease in coverage and an increase in drift when drone ground speed was increased. We also observed that as the T40’s ground speed increased, the swath width appeared to increase. We did not measure effective swath width at different speeds, but if this observation is correct then droplet density by area would decrease at higher speeds. The loss of spray to drift and/or through increased swath width would explain why increased speed resulted in fewer deposits on the wheat heads.
The increased deposit diameter is likely due to spread factor. Higher ground speeds would impart a higher droplet velocity and therefore cause droplets to spread more on impact. If this is the case, and had we conducted residue trials, we would predict an inverse relationship between ground speed and residue levels, despite having similar percent surface coverage. This observation underpins the importance of assessing deposition patterns as well as residue in coverage trials.
Conclusions
- For this use case, a drone applying 50 L/ha (5 gpa) produces a similar, if slightly higher, percent coverage on a wheat head compared to a helicopter applying the same volume. However, the deposit density is considerably higher.
- Corroborating previous results in corn, drone application volume has a direct relationship with spray coverage.
- For this use case, drone ground speed does not appear to affect the percent wheat head area covered, but there is an inverse relationship with deposit density. We theorize based on the direct relationship between ground speed and deposit spread, and prior evidence of increased drift with higher ground speed, that less active ingredient is deposited on the wheat head at higher ground speeds.
- The relationship between downwash (i.e. dwell time, which is a function of downwash air energy and ground speed), wheat movement and coverage is unclear.
Acknowledgements
Thanks to Zimmer Air, Drone Spray Canada, Bayer Canada, Grower-Cooperator Adam Pfeffer and OMAFRA SEO student Vanessa Benitz.