White mould is caused by the fungus Sclerotinia sclerotiorum and it’s an annual threat to soybean when cool, wet conditions correspond with flowering. Variety selection (e.g. high tolerance) and cultural control (e.g. crop rotation and wider row width) are important management tools, but ultimately the application of a crop protection product between R1 and R2 is required for high-risk fields. (Learn more here).
This article describes the results of an experiment exploring soybean canopy coverage and fungicide efficacy from a rotary spray drone. All work was performed under PMRA research authorization. There are currently no labels to apply crop protection products in Canada.
Experimental design
For the spray coverage trials, two locations were selected in southern Ontario (one south of Sparta and one west of Talbotville). This was a full field-scale trial with a single application made at R1.5 on July 18 (Sparta area) and July 22 (Talbotville area), 2023. There were two replications in each field and treatments were laid out parallel with the planting direction in a randomized design. Four other locations in Ontario and Quebec were also used in the larger efficacy/yield study. All locations had some level of white mould infection.
- Untreated Check
- *DJI Agras T30 – 20 L/ha (6.8 m/s, 2.5 m above canopy, TJ TT110015)
- DJI Agras T30 – 30 L/ha (5.7 m/s, 2.5 m above canopy, TJ TT110015)
- DJI Agras T30 – 50 L/ha (3.3 m/s, 2.5 m above canopy, TJ TT110015)
- New Holland 345 – 150 L/ha (TeeJet XR11006 nozzles on 50 cm spacing)
*Not included in spray coverage trial
We established an effective swath width of approximately 4 m (13.1 ft). The drone made three passes to cover the 12 m (40’)-wide treatment area, corresponding to the widths of the 9 m (30’) or 12 m (40’) headers later used to harvest in each field. Buffers were left on either side the treatment area. Fungicide was applied at label rate plus 0.125% Activate.
Target placement and retrieval
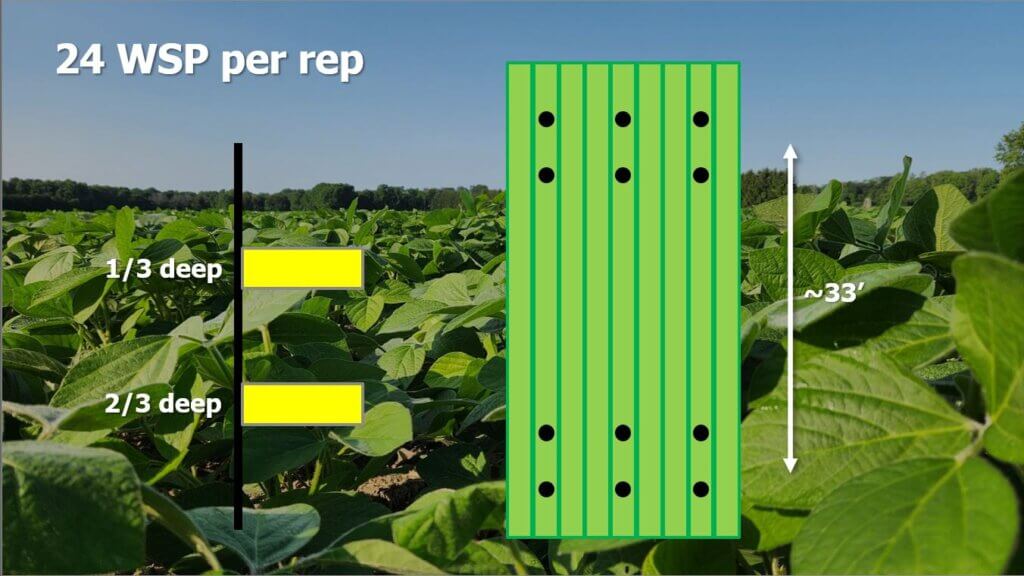
Soybeans were planted on 38 cm (15”) row spacing. The coverage sampling area was positioned in the middle of the treatment area. A length of rebar was positioned in-row and sheathed in PVC tubing. Two SpotOn brand water sensitive papers (WSP) from the same production run were secured face-up approximately 1/3 and 2/3 deep in the canopy. A block of six such samplers were positioned in a 3 x 2 grid (every third row and approximately 2 m apart in row). This block was then repeated 10 meters (33’) further into the block for a total 24 water sensitive papers per replicated treatment (see below).
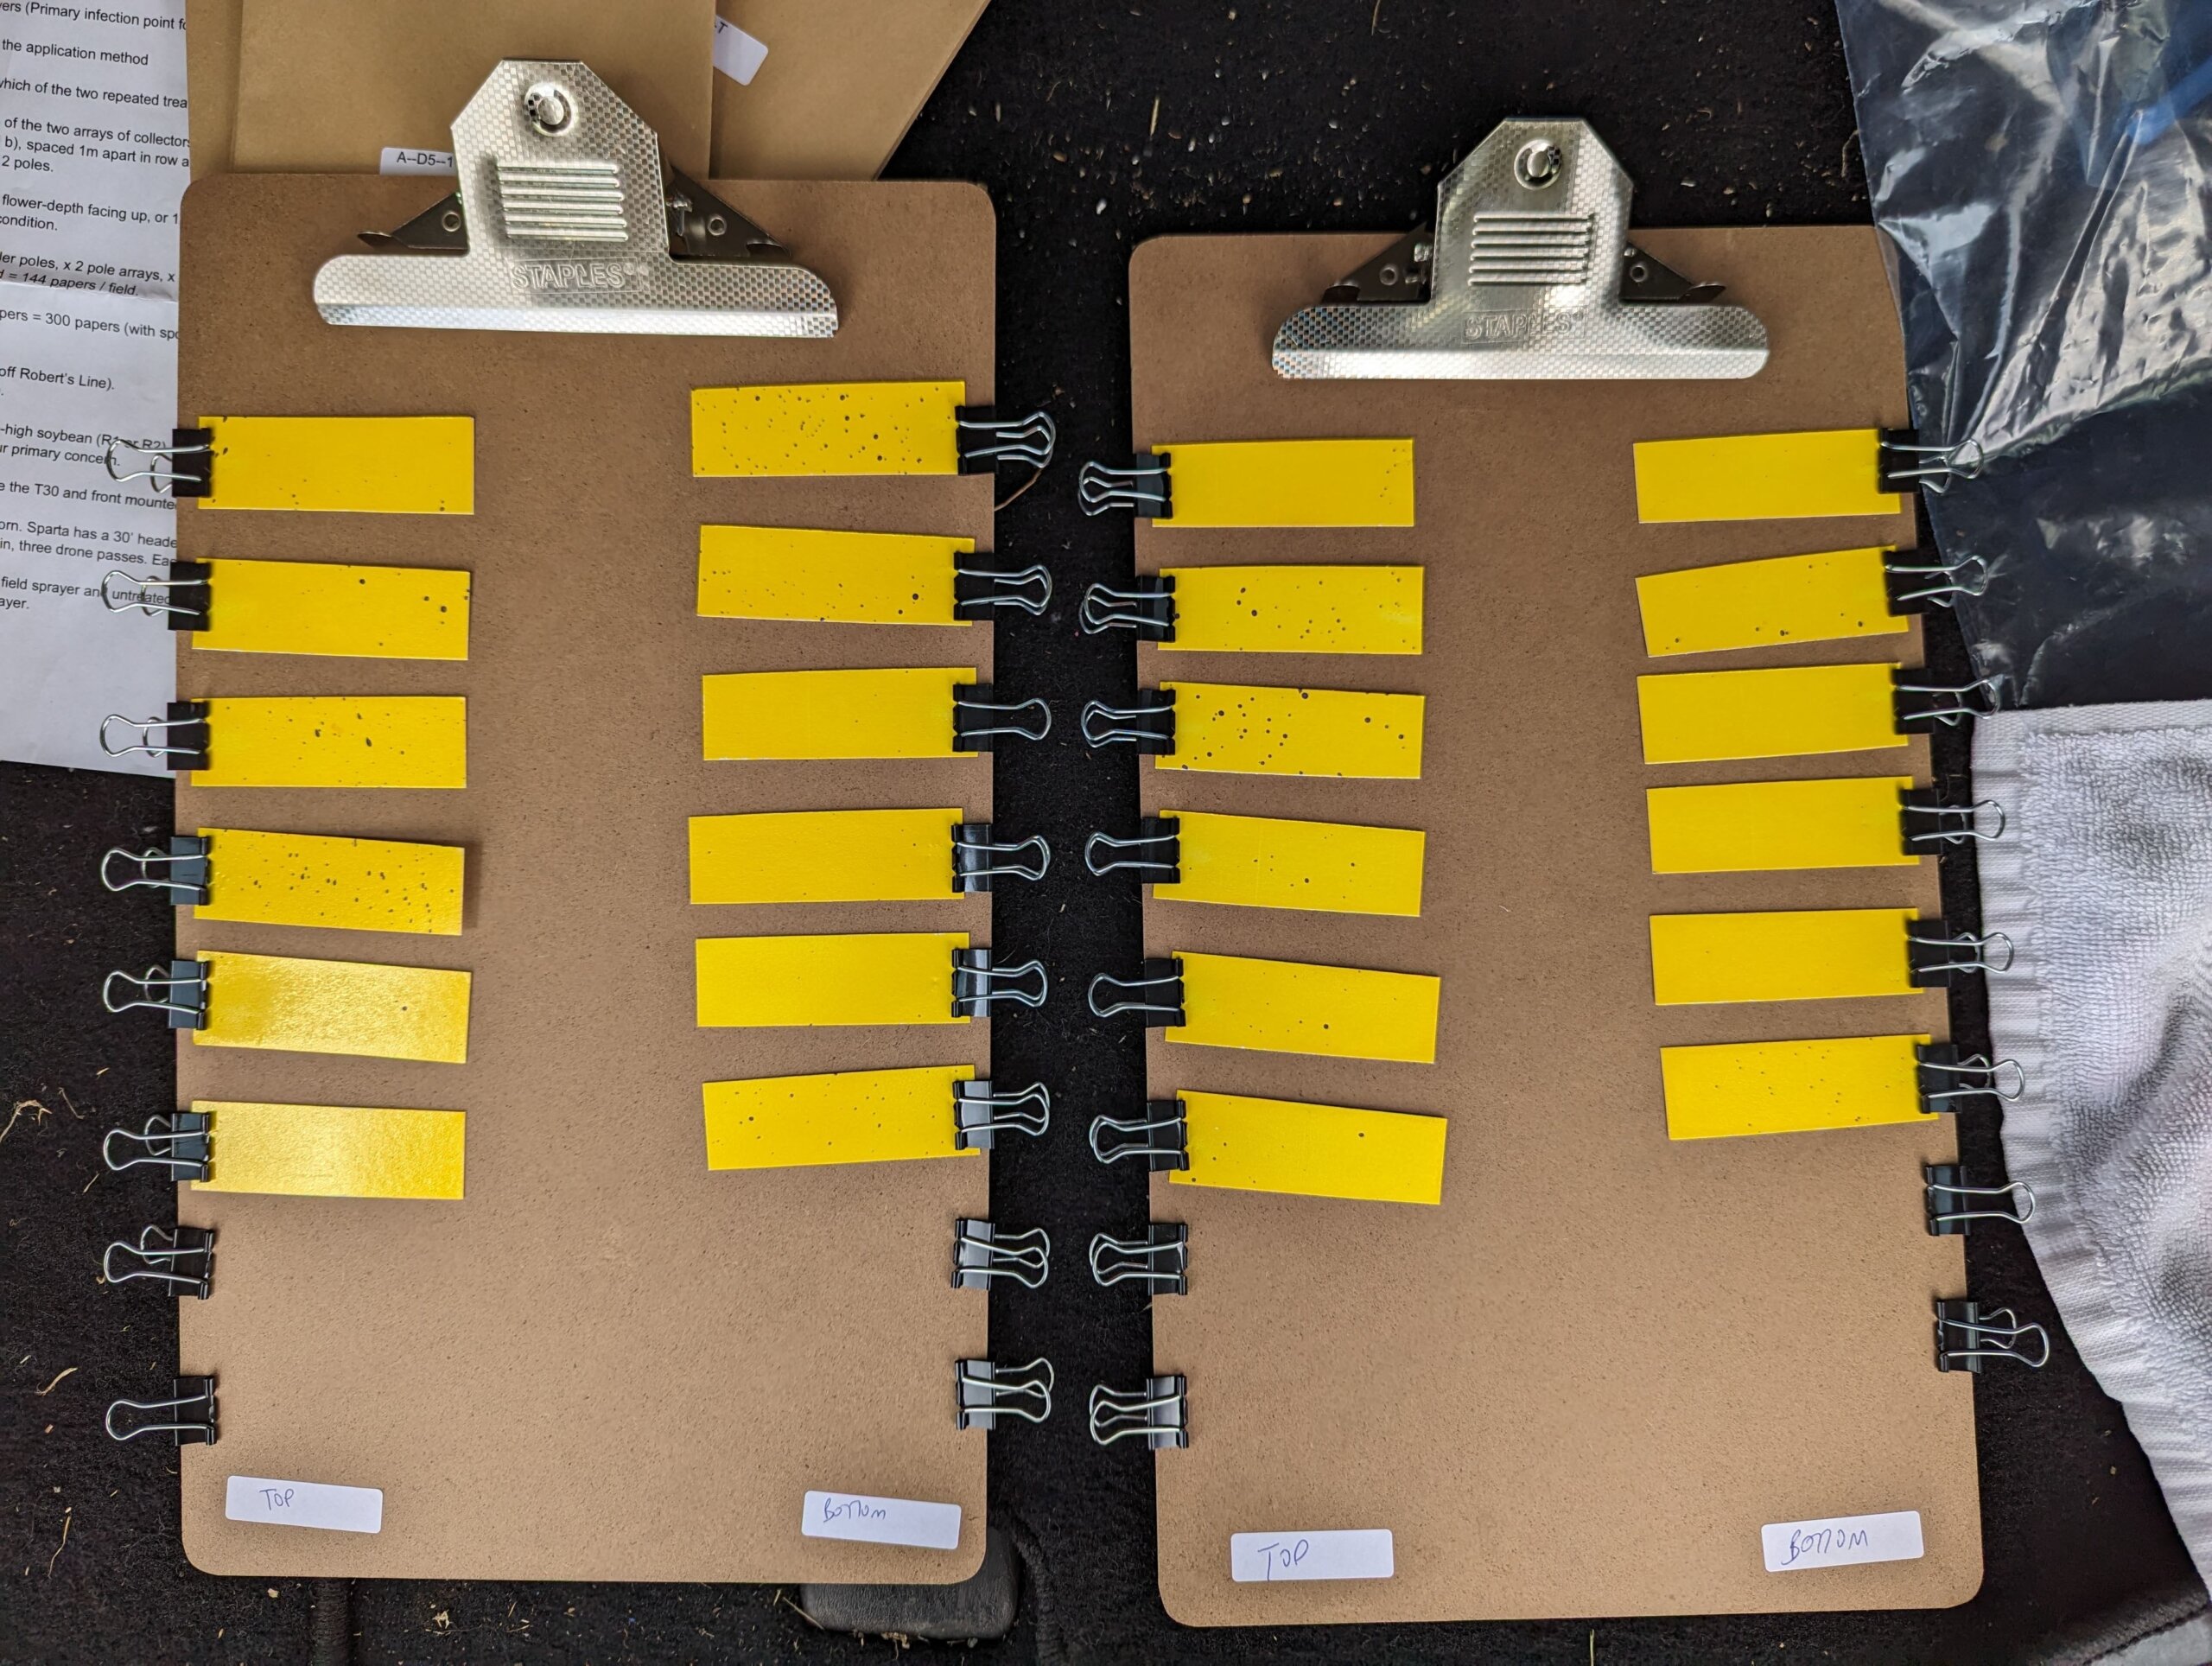
The papers were retrieved and temporarily placed on clipboards to dry before they were placed in paper bags for short term storage. They were digitized using a SprayX DropScope within 48 hours of retrieval on the “ground sprayer” setting, measured as percent surface covered (% area), and deposit density (# deposits/cm2).
Weather during coverage trials
Weather data was monitored using a Kestrel 3550AG weather meter (Kestrel Instruments) in a vane mount positioned 1.5 m (5 ft) above the ground. Wind speed fluctuated during the treatments, but wind direction remained relatively stable at 90 degrees to the flight path. The Sparta location averaged 6.4 km/h (4 mph) while the Talbotville location was considerably higher at 14.4 km/h (9 mph). Nevertheless, targets remained within the swath, despite any offset, as indicated by visual confirmation as well as the consistent coverage observed on the windward WSP compared to other, downwind samplers in each pass. Cloud cover was high at both locations.
Results
Coverage
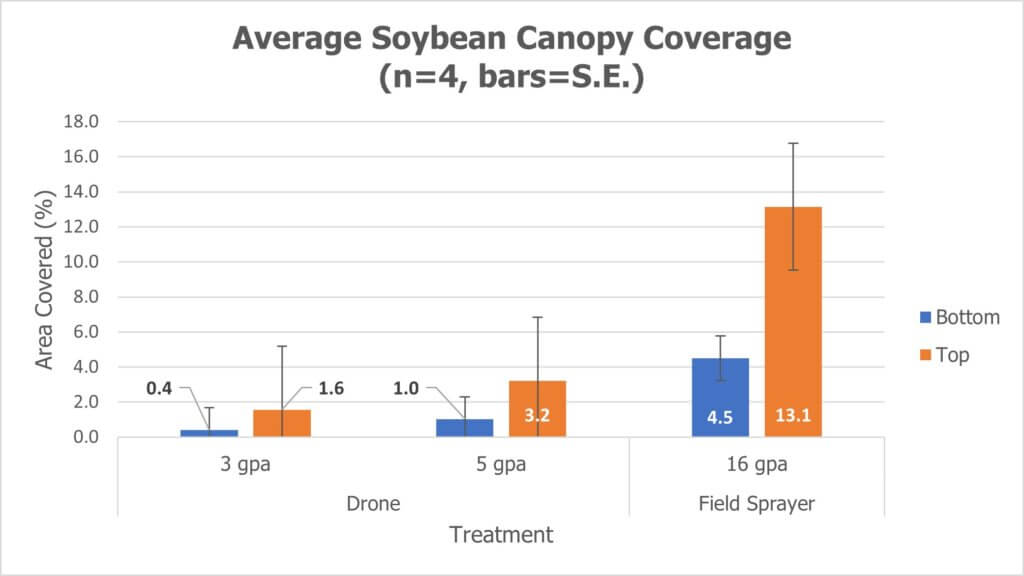
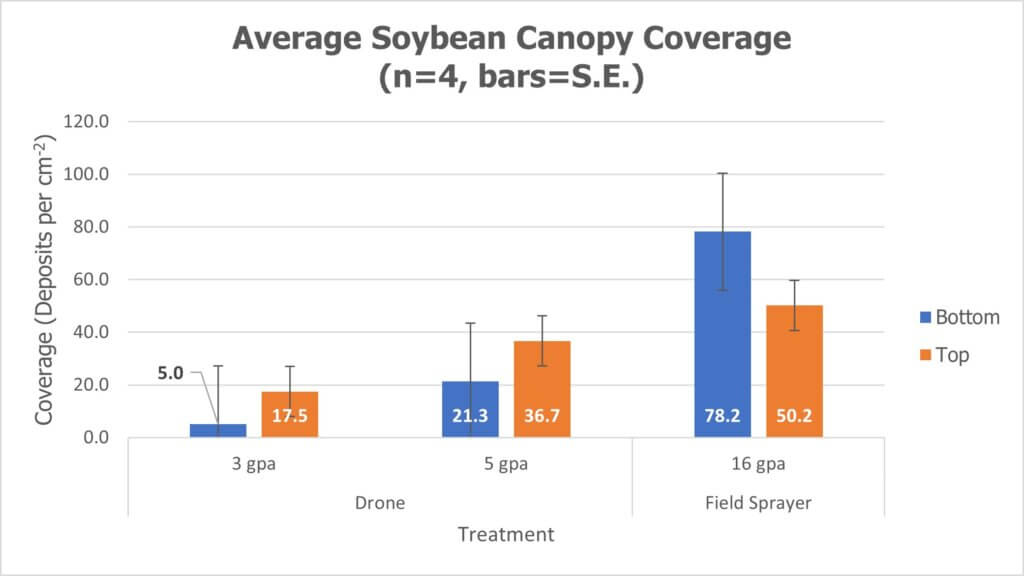
The coverage recorded from each WSP was averaged by canopy position (bottom 1/3 or top 1/3 of canopy) and presented in the following histograms with standard error. There were some spoiled collectors, primarily in the lowest canopy position, ruined by high humidity and physical contact with the plant. However, the lowest n for any treatment was 31 collectors and the highest was the full 48. Coverage is presented both as % area covered and as deposit density in counts per cm2.
Efficacy and yield
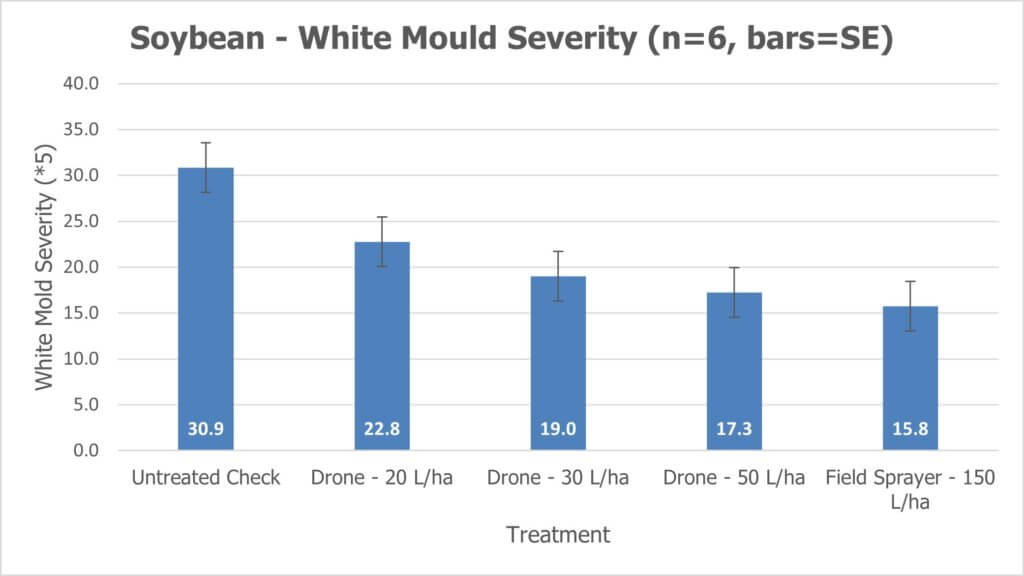
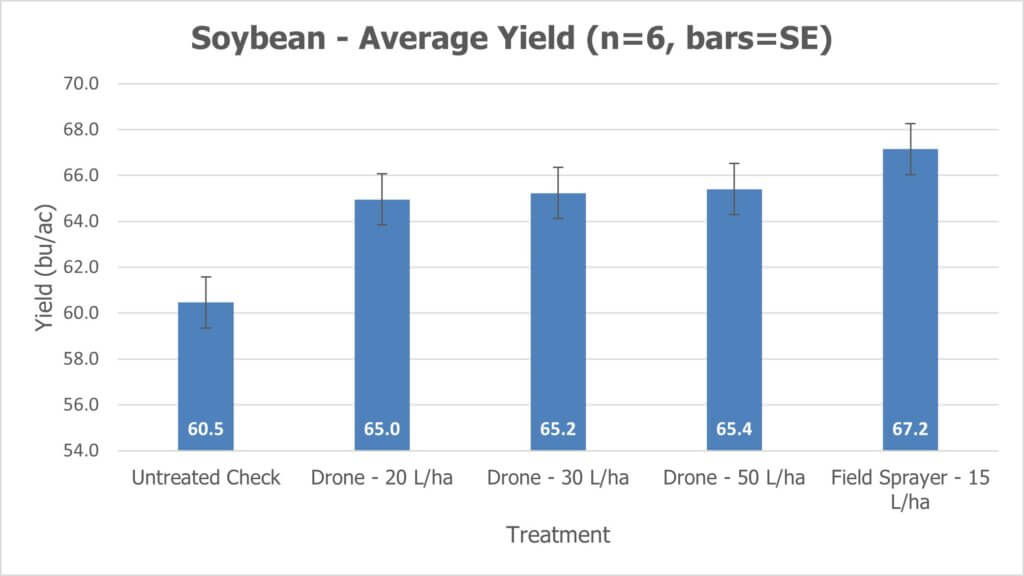
Three phytotoxicity ratings were performed 7, 14 and 21 days after treatment. White mould was rated at harvest and final crop yield reported in bu/ac.
Observations and Considerations
As expected, both water volume and canopy depth share direct relationships with percent-area covered (i.e. lower water and lower canopy depths mean lower coverage). Water volume also shares a direct relationship with deposit density for a given droplet size, but canopy depth is more complicated as smaller droplets tend to penetrate more deeply into canopies and low water volumes tend to produce smaller droplets. However, as a general observation, less water translates to less coverage no matter the metric for coverage, and this has been shown to reduce product efficacy.
How, then, can we reconcile the claims of efficacy from low-volume drone applications? It’s typical that the % area covered from a 50 L/ha drone application is ¼ or less than that of “conventional” field drop systems which in North America tend to employ 150-200 L/ha. In speaking with Mark Ledebuhr (Application Insight LLC) about how low volumes could possibly be efficacious, he explained that in sugarcane production in Guatemala, the condensing humidity is likely the reason why their 1 gallon/acre applications are working. The droplet survivability, and the re-hydration and secondary movement of the deposits were a good thing.
In the case of contact fungicides in North America, it may be humidity as well, but also the deposit density, combined with higher concentrations of active ingredient, that explain the similar efficacy and yields as seen here between the 50 L/ha (drone) treatment and the 150 L/ha (field sprayer) treatment. This would concentrate both the active ingredient (possibly increasing uptake rate, or residue persistence, depending on the product mode of action and the target’s physiology) as well as the adjuvant load (possibly improving sticking/spreading of deposits).
Another consideration surrounds how deposit spread is analyzed. Water sensitive paper underestimates the spreading effect that can occur on plant surfaces (especially where surfactants are used). This is why WSP tends to be used as a relative index, meaning that papers should only be compared to other papers. Perhaps deposits are spreading more on the plant surfaces in the low-volume drone application (again, given the higher concentration of formulated adjuvants) than the water sensitive paper is indicating, and that is improving efficacy.
This concept of how low-volume applications might affect coverage and subsequent efficacy, and the potentially positive impact of re-formulating products to include higher adjuvant loads, is well-described in this precis by Dr. Andrew Chapple and Malcolm Faers. Currently, accepting that the amount of control provided by the drone application falls a little short of that provided by a field sprayer, this study indicates that drones have the potential to produce acceptable results in fungicide applications if conditions are suitable, timing is optimal and water volumes are sufficiently high.
Acknowledgements
This study was a collaborative effort with Bayer Canada and Drone Spray Canada.