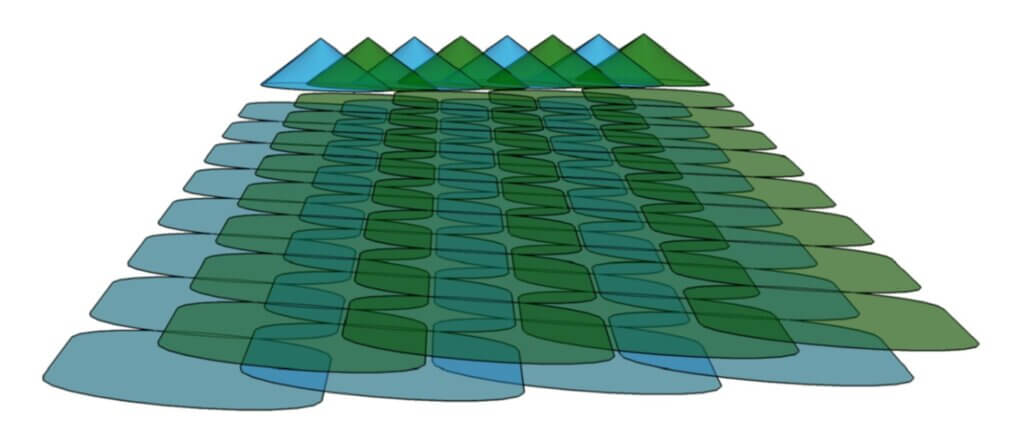
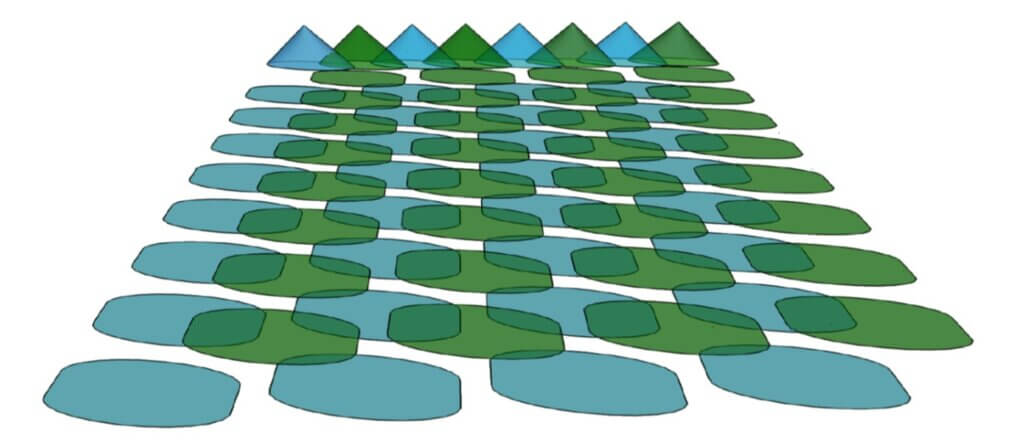
We’ve written extensively about angled flat fan nozzles and their ideal operating parameters (i.e. pressure, boom height, droplet size, volume and travel speed) for spraying wheat heads. Generally, coverage on the sprayer-approach side of a wheat head (aka the advance side) is easier to achieve because droplets from a conventional flat fan geometry tend to follow a downward-forward vector. Imagine dropping a ball from the window of a moving car. An outside observer would see it travelling forward as it fell.
The back of the wheat head (aka the retreat side) and the sides are harder to hit. When we introduce a rearward angle to coarser, fast-moving droplets, the high momentum and downward-rearward vector deposits spray on the retreat side of the wheat head after the sprayer passes over. Mythbusters produced a cool video segment that illustrates this concept by matching the rearward velocity of a soccer ball to the forward velocity of a truck; the ball falls straight down. Of course, in our case we want it to shoot backwards.
A great deal of independent research has determined that low booms coupled with dual fans that produce coarser spray and higher volumes will optimize coverage on any vertical target. Asymmetrical nozzles that have a more aggressive rearward angle perform better still. Of course both of these claims assume a “reasonable” wind speed, because the finer droplets in the spray experience a comparatively lower degree of inertia. Inertia is a property of matter that describes the resistance of an object to changes in its state of motion and it’s related to the object’s mass. What this means is that smaller droplets slow quickly, are easily deflected by wind, and tend to deposit on the windward side of the wheat head.
So, maybe you already knew all that. What’s new?
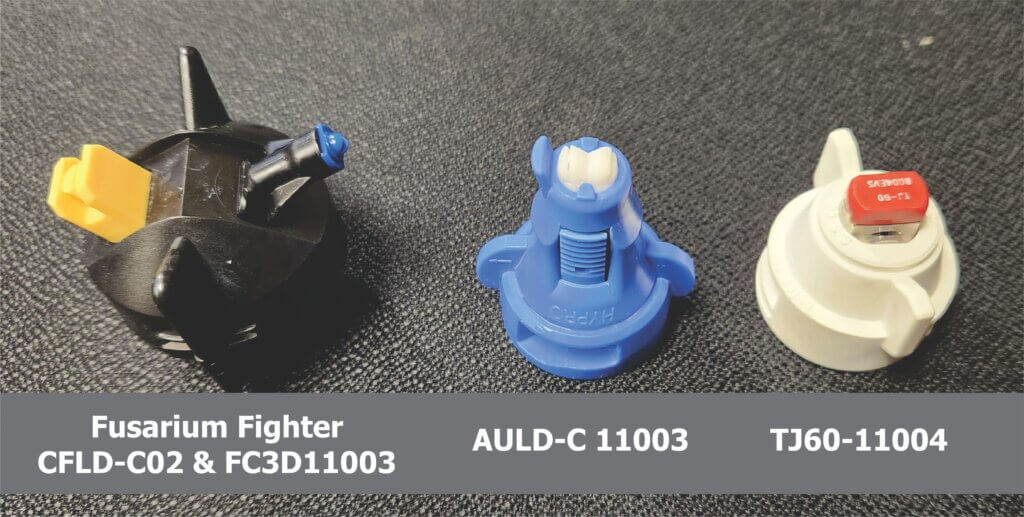
Two asymmetrical tips have been introduced in recent years and we wanted to characterize their coverage (Figure 1).
The first is the “Fusarium Fighter” which is a combo-tip developed by Nozzle Ninja in Stettler, Alberta. It combines Pentair Hypro’s FC-3D100 (a non-AI tip with a 2 star rating from LERAP and a 100° wide fan) with ASJ’s, Compact Fan Low-Drift Coarse with its 120° wide fan. The 3D already has a 55° angle from vertical and the twin cap brings that to a very steep 65°.
The second is Pentair Hypro’s Asymmetric Ultra Lo-Drift AI Ceramic. This is the same as the Lechler IDTA where the front angle is 120° wide, angled 30° forward from vertical and sprays 60% of the spray volume. The rear fan is 90° wide, angled 50° back and sprays the remaining 40%.
Finally, and only to illustrate how symmetrical fans and finer droplets are perhaps not ideal for reliable wheat head coverage, we ran TeeJet’s TwinJet Twin TJ60-110VS. This is two 110° flat fans and the angle between them is 60° (30° fore and 30° back from vertical).
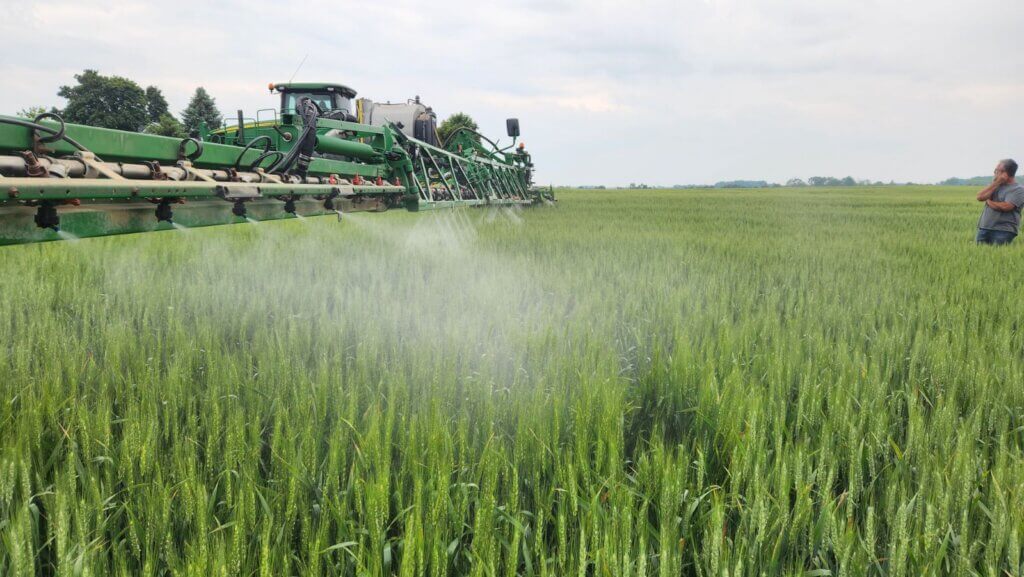
For each treatment, five nozzles were positioned mid-boom on a Deere 410R to minimize any turbulence from the sprayer wheels and chassis and to reduce the degree of yaw. Extensions were used on all tips to ensure the spray did not impact the boom itself. All other nozzles were turned off. Nozzle bodies were on 50 cm (20″) centres and positioned 50 cm (20″) above the average wheat head. Travel speeds were selected to achieve 187 L/ha (20 gpa) at a pressure ideal for the tip in question and this is recorded in Table 1. Contractors and other such custom applicators may find these speeds low and the volumes high, but in this study we chose to emulate usage in smaller operations. The effect of travel speed on coverage is debatable but likely quite minor. More can be found on the subject in this article.
| Nozzle | Spray Quality | Speed | Pressure |
| AULD-C 11003 | C | 6.6km/h (4.1mph) | 483kPa (70psi) |
| FF (CFLD-C02 & FC3D11003) | VC & M | 8km/h (5mph) | 207kPa (30psi) |
| TJ60-11004 | F | 8km/h (5mph) | 207kPa (30psi) |
The weather was 25°C, 40% R.H. and there was a very light and consistent tail wind of 2-4 km/h (1.2-2.4 mph). These were ideal conditions because it was not hot or dry enough to evaporate finer spray appreciably, and not windy enough to deflect the spray.
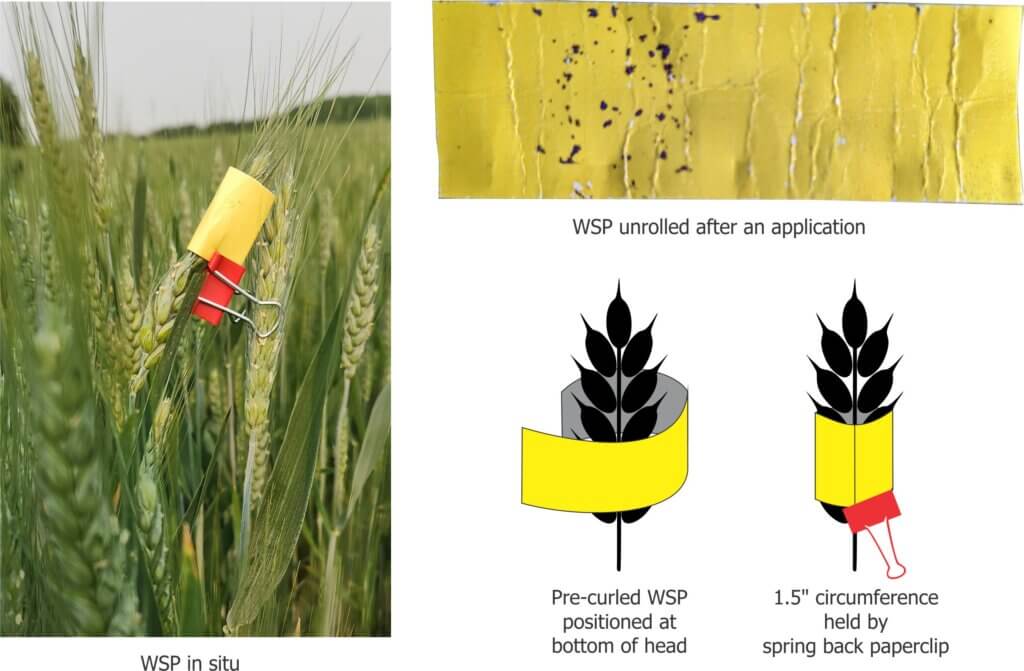
Water sensitive paper (Syngenta) was wrapped around the wheat head and held by a paper clip (see Figure 2). This gave a panoramic representation of coverage. Two more were mounted nearby on a length of rebar at wheat head-height; One faced the sprayer advance and one faced the retreat. Three such sets were positioned inline, spaced about 1 m apart and centered on the swath produced by the five nozzles. This was repeated 2x for each nozzle. Papers were retrieved, digitized and analyzed per the method described in this article.
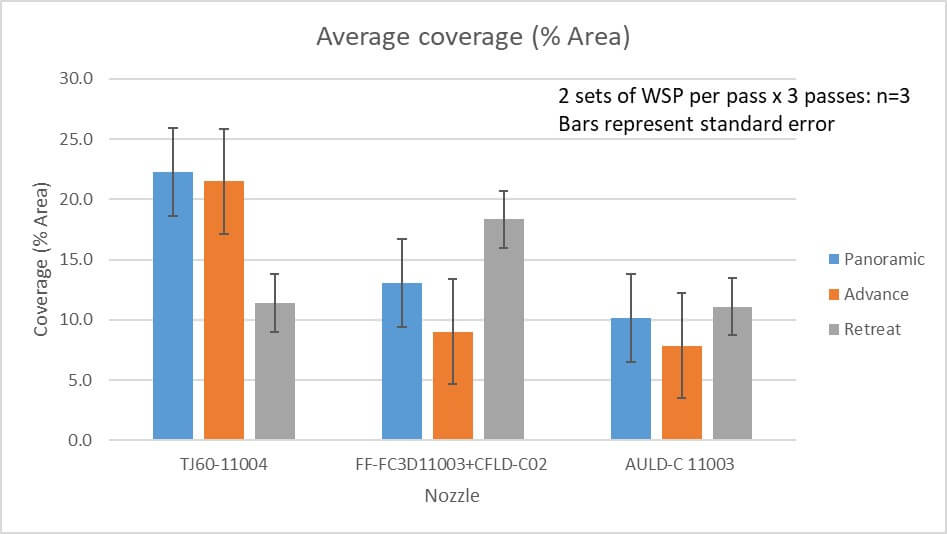
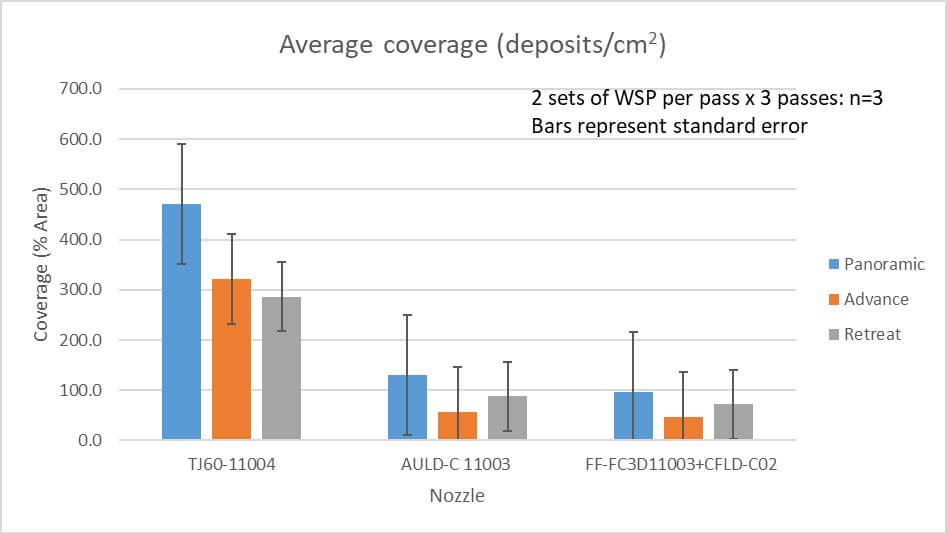
The resultant coverage is recorded in Table 2 and graphed in Figures 3 and 4.
| Nozzle | Panoramic: Area covered (%) & deposit Density (#/cm2) | Advance: Area covered (%) & Deposit density (#/cm2) | Retreat: Area covered (%) & Deposit density (#/cm2) |
| AULD-C 11003 | 10.2% 130.4 deposits/cm2 | 7.9 % 56.1 deposits/cm2 | 11.1% 87.7 deposits/cm2 |
| FF (CFLD-C02 & FC3D11003) | 13% 97.5 deposits/cm2 | 9.0% 46.9 deposits /cm2 | 18.3% 72.4 deposits/cm2 |
| TJ60-11004 | 22.3% 471.0 deposits/cm2 | 21.5% 320.9 deposits/cm2 | 11.4% 286.1 deposits/cm2 |
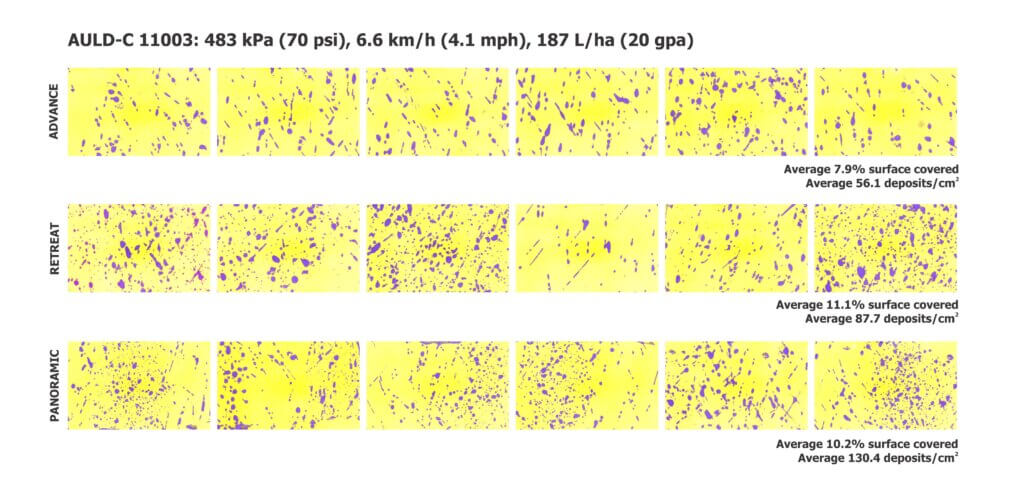
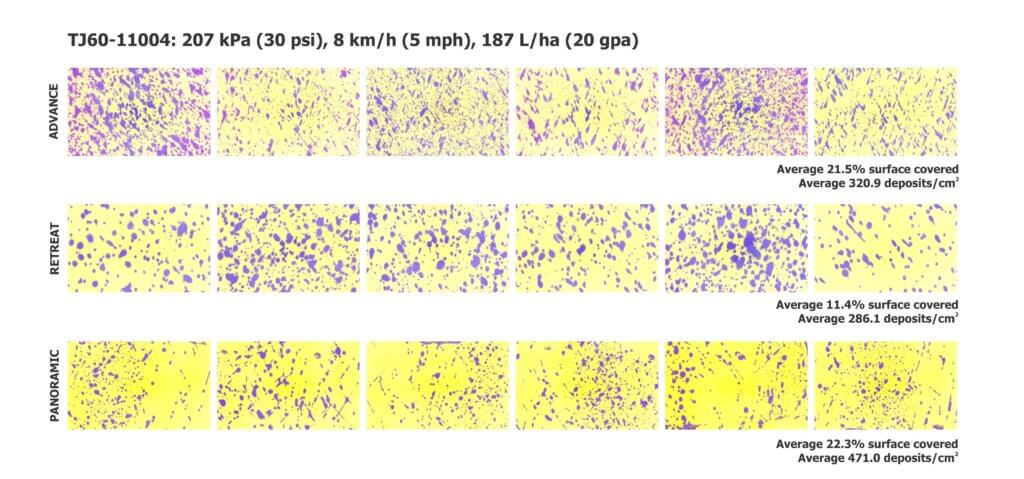
Unless you are experienced with interpreting coverage data, these numbers and graphs may not convey what coverage truly looked like. And since we saw some unexpected results, we felt it would be best to digitize the papers from each nozzle and create graphics to support our observations and opinions on how they performed. Each image shows six replications of each orientation. We’ll begin with the AULD in Figure 5.
The AULD was operated at a relatively high pressure to create the Coarse droplets recommended by the nozzle manufacturer. The steep rearward angle produced a higher degree of coverage on the retreat side compared to the advance. The streaky or tear-drop shaped deposits indicate a droplet that “scuffed” along the paper surface, almost but not quite in parallel. On the panoramic targets they tend to correspond with the sides of the paper, where the droplets are not aimed directly at the surface as in the “advance” and “retreat” surfaces. All in all, this nozzle performed well and created droplets large enough that we feel they would stay on course in a higher wind and not get tied up on the awns of the wheat head.
Next is the Fusarium Fighter. This nozzle was developed in Western Canada where, on average, sprayers tend to travel faster than they do in Ontario. Certainly this isn’t the case for all Ontario fields, but we chose to emulate usage in home farm operations where fields may be smaller and less level. This is relevant because faster travel speeds permit the use of a larger 3D nozzle to achieve 20 gpa, which in turn produces a coarser spray quality. In our trials, we traveled more slowly and that necessitated a smaller 3D that produced only a Medium droplet size. We hypothesized that those smaller droplets may not stay on course, but the papers show otherwise (Figure 6).
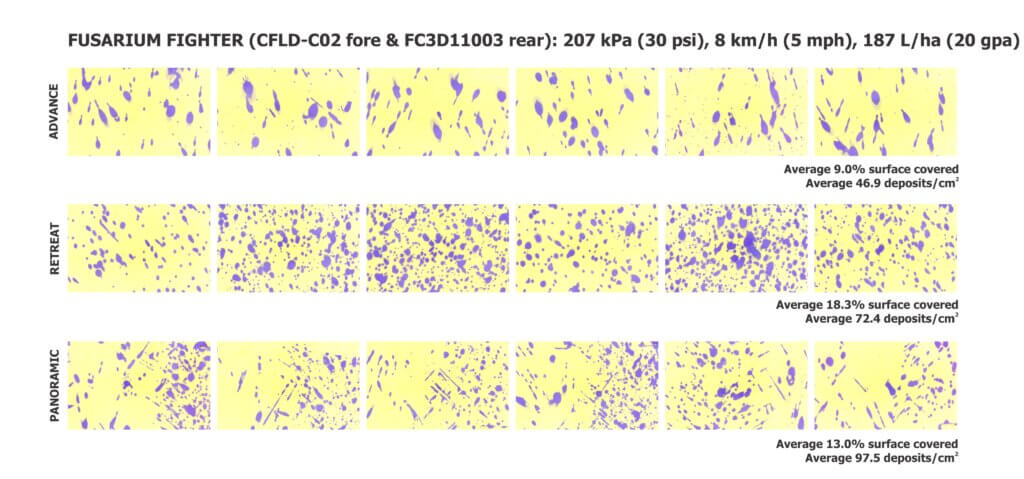
Coverage on the retreat side was very good and far outstripped the coverage on the advance side. In fact, the Very Coarse spray quality from the CFLD-C may be too large. Dropping from VC to C would create more droplets and a higher deposit density on the advance. We did see some gaps in the panoramic papers that likely reflect the lack of finer droplets which tend to move more erratically and contact the sides. Recall that we said weather conditions were ideal. It is still questionable how well a 3D producing a Medium spray quality would perform in windier conditions or on the boom ends where yaw tends to lift tips well above the ideal operating height.
Finally, the TwinJets (Figure 8). We used this nozzle only to demonstrate how the lack of an aggressive rearward angle and a Fine spray quality was not conducive to reliable wheat head coverage. Many studies have demonstrated that such a nozzle outperforms a single, conventional flat fan, but it is not the best choice of angled nozzles. Once again recall that these nozzles were positioned centre-boom where yaw and sprayer-induced turbulence were not an issue and in absolutely ideal environmental conditions.
We saw tremendous coverage on the advance side and while we saw comparatively less on the retreat side, it still performed well compared to the other nozzles. The panoramic targets also indicated suitable coverage, both as percent area covered and deposit density. BUT, if we have some questions about how the Medium spray from the 3D would perform in more challenging conditions, we are far more concerned about the fines from this tip. Having used this nozzle in past demonstrations we are well aware of how non-uniform and erratic coverage can be, and that translates to poor efficacy and increased drift. However, sometimes circumstances conspire to create exceptions, and the coverage we saw in this trial is hard to fault.
This trial was not intended to rank nozzles, but to explore the merits of a few new designs and evaluate their respective coverage. If anything the results reinforce the need to operate angled sprays correctly and in appropriate weather conditions. Water sensitive paper remains a quick and easy method for sprayer operators to evaluate their own coverage and inform any corrective actions to improve results in their own unique circumstances.
Thanks to Dan and Paul Petker (Petker Farms) and Don Murdoch (Simcoe Research Station, University of Guelph) for providing the fields and operating the sprayers. Nozzle Ninja is gratefully acknowledged for the donation of AULD and Fusarium Fighter nozzles, and Spraying Systems Co. for the TwinJet nozzles and water sensitive paper.