On March 2, 2021, John Deere entered the optical spot spray (OSS) market with its first product, See & Spray Select™. This “Green on Brown” system identifies green material on a non-green background and is thus suited for pre-seed burnoff, chem fallow, or post harvest. It is competing for the same market space as Cropland’s WEEDit and Trimble’s WeedSeeker, but uses a slightly different approach.
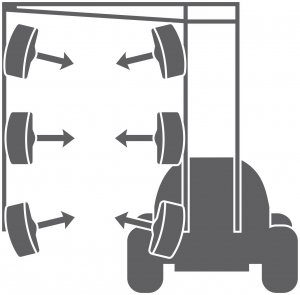
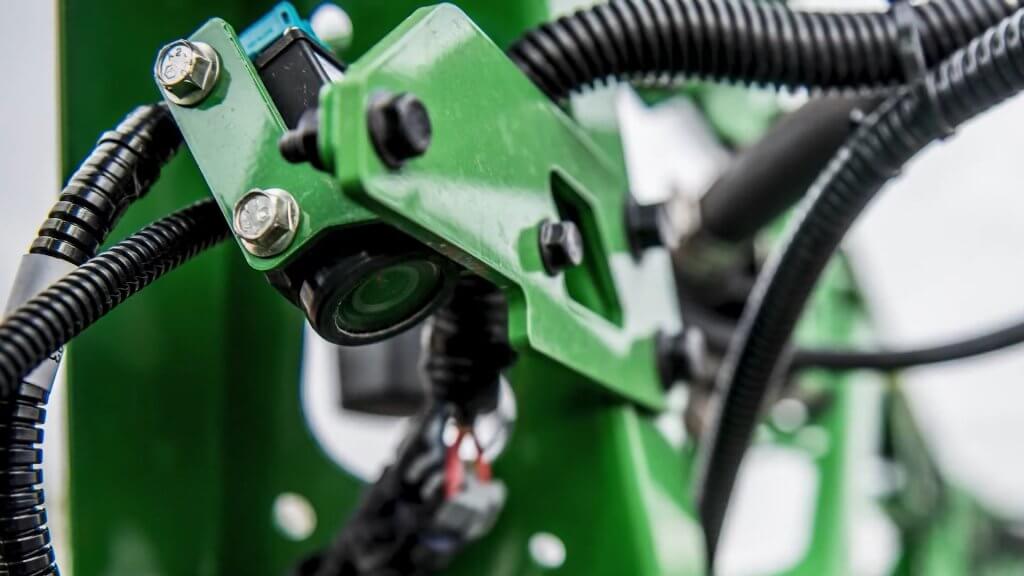
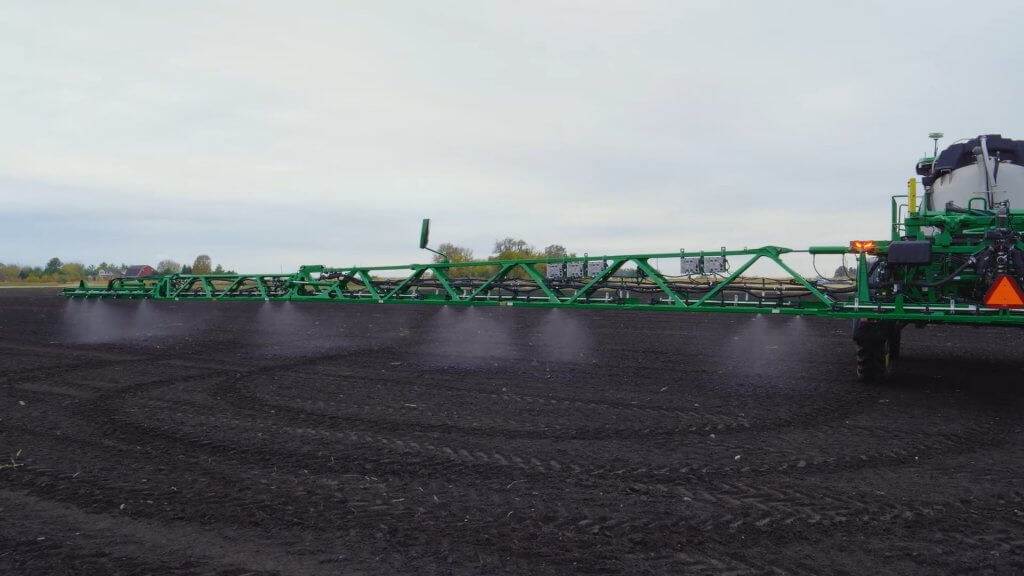
At the heart of the See & Spray system is a relatively simple RGB camera that is mounted directly to the boom and looks about 1.5 m ahead. When this camera detects a spot of green colour, it assumes that this is a plant and activates a nozzle in line with that plant. John Deere says the weed size threshold is about ¼” (6 mm), and is evaluating its experimental data to identify exceptions to that rule of thumb.
In 2017, John Deere conducted a highly publicized acquisition of Blue River Technologies, a start up that pioneered artificial intelligence (AI) plant identification and coined the term “See & Spray”. However, the technology John Deere announced this time originated with the University of Southern Queensland near Toowoomba, Australia. The university’s Centre for Agricultural Engineering had received some initial seed financing from Sugar Research Australia, Cotton Research and Development Corporation, and Hort Innovation, and eventually partnered with John Deere. This is yet another example of the value of farmer investments in research.
Blue River contributed to this project but remains committed to its path of developing Green on Green OSS through machine learning. John Deere says this first product is part of an evolution of spraying with ever-increasing precision that will culminate in spot spraying weeds within a canopy.
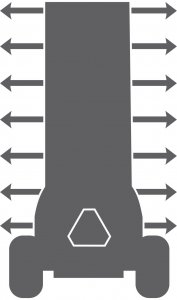
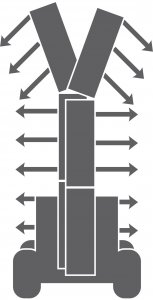
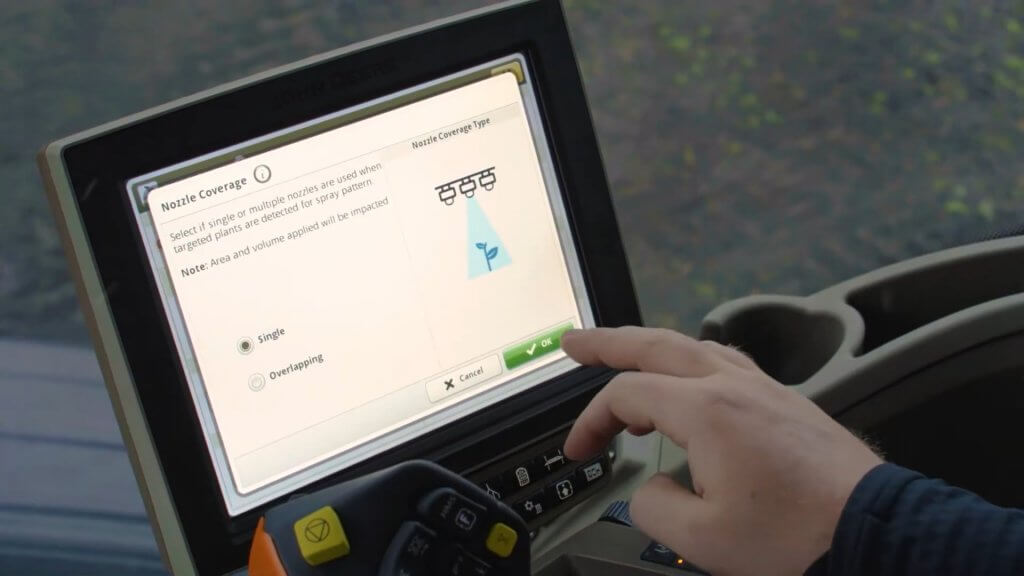
The pixels in the See & Spray camera chip are mapped during its initial calibration, allowing the processor to know which nozzle to turn on. There are two user-selected modes. In “Single Nozzle” Mode, the system turns on as few nozzles as possible. If the weed is directly under a nozzle, just that nozzle is turned on. Should the weed be in between two nozzles, both will be turned on. In “Overlapping” Mode, a detection will turn on at least three, and up to six adjacent nozzles. This mode is intended for herbicides that contain specific nozzle recommendations on the label, such as dicamba. By fitting these tips on the spot spray location, the required overlap and subsequent coverage can be guaranteed to be compliant with that label, a unique feature of See & Spray.
In all modes, the user can specify the distance before and after the detected plant that the nozzle will spray. This feature is useful when boom height varies or when travelling faster to provide extra assurance that the target will be covered by the spray. The boom height range for See & Spray is 26 to 47” (66 to 120 cm), and the maximum travel speed with nozzles pointed down is 12 mph.
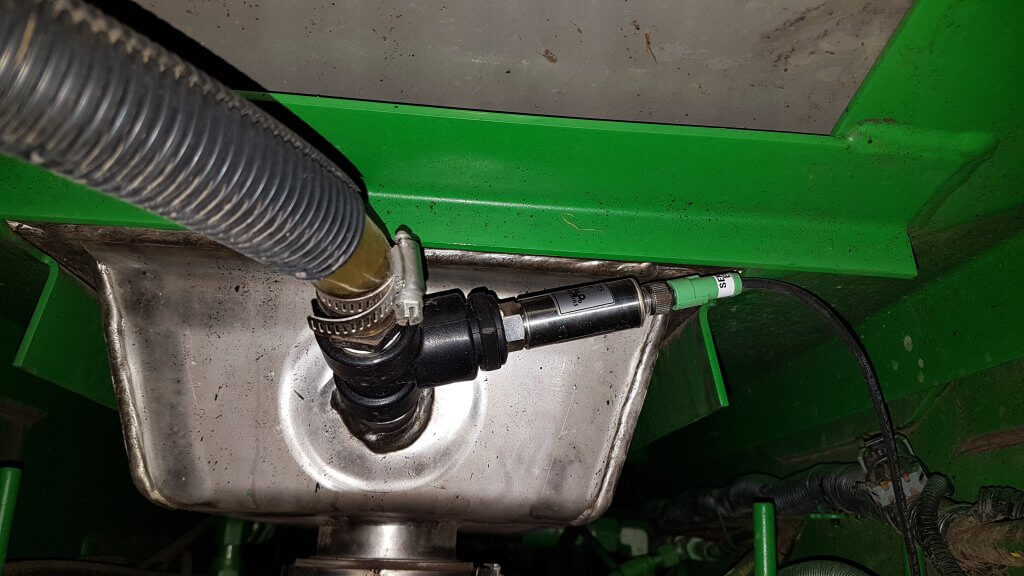
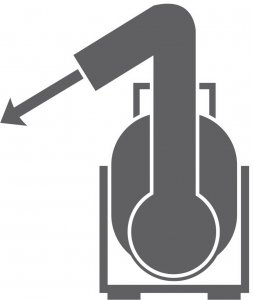
Installation of a 40 degree angled adaptor allows sprays tom be emitted backwards, and increases the spray speeds to 16 mph due to the extra distance and time afforded the sensors andoin processors to make a decision.
See & Spray has a built in contingency for suboptimal conditions, for example when the boom falls outside its height range, or the nozzle speed (not tractor) exceeds the 12 or 16 mph maximum in a turn, or a light or sensor or processor fault occurs. Called “Fallback Mode”, the boom can be configured to shut off, or to go into broadcast mode (using the spot spray nozzles) at that time. These types of insurance are a necessary part of an OSS on the market today.
To prevent fallback mode from occuring unecessarily, operators often choose to reduce their tractor speed one or two mph to allow for yaw without triggering all the nozzles.
No OSS system is perfect. Tiny weeds, or those obscured from camera view by crop residue, may be missed. The contingency for WEEDit is “Combined Mode”, where the entire boom emits a broadcast spray at a user-determined fraction of the full dose, while still maintaining spot spray capability at the full dose when a detection occurs. The reduced dose is sufficient to control the smallest weeds, whereas the spot spray is emitted at the full label rate for the larger ones. This capability is made possible through Pulse-Width Modulation (PWM) control of each nozzle.
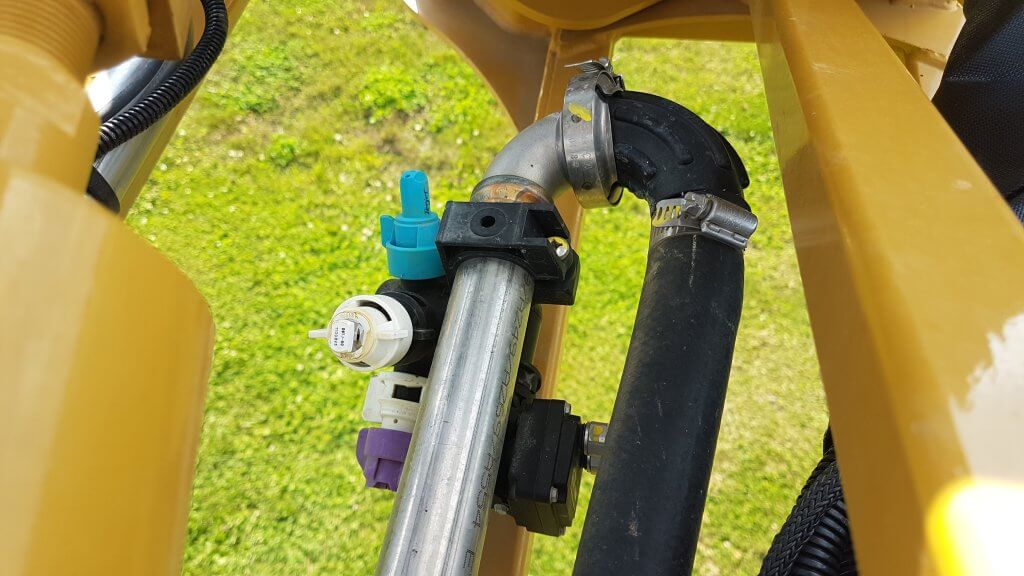
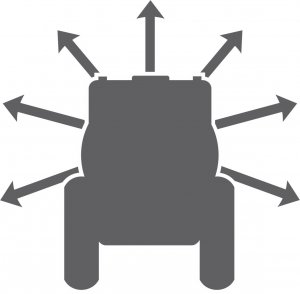
John Deere has developed a mode of its ExactApply system to create the same outcome. Called “A & B Mode”, the rear nozzle (B location on the ExactApply nozzle body) is being activated by See & Spray. The front nozzle (A location) can be asked to spray simultaneously over the entire boom width. By choosing a smaller nozzle, a fraction of the label rate can be applied as a broadcast while maintaining spot spray capability. The broadcast boom is pulse-width modulated and retains the swath control and turn compensation of ExactApply. This mode also makes it easier to ensure coverage of these smaller weeds by selecting a finer, wider (110 degree) angles spray on the broadcast boom, and retaining a coarser, narrower fan angle banding nozzle for the spot application. The spot spray does not use PWM, relying on conventional speed and pressure to ensure the correct rate.
If planning to use A & B Mode, a user would first need to decide if they will calculate the spot spray dosing on a single or a multiple activated nozzle system. If priorizing the single nozzle actiation, one would first determine the band width of that nozzle, and size the nozzle accordingly. The band width should be ar close to the nozzle spacing as possible to maximize savings. Say the sprayer has 15″ spacing, and the nozzle’s band width is 20″. Now, whenever multiple nozzles are activated, they would operate as a 15″ spacing and would over-apply 20/15 = 1.33, or 33%. Say you want to apply 15 gpa (you may need to boost the spot spray volume to allow you to cut that with the broadcast feature). You can do it with the band (and overdose when using multiple nozzles, or apply 15 gpa with the multiple nozzles, underdosing by 28% when a single nozzle is activated. Or split the difference.
The next step is to select the application rate of the broadcast. If you want to apply 30% of the spot spray rate using the broadcast nozzles, size these accrodingly to apply 5 gpa.
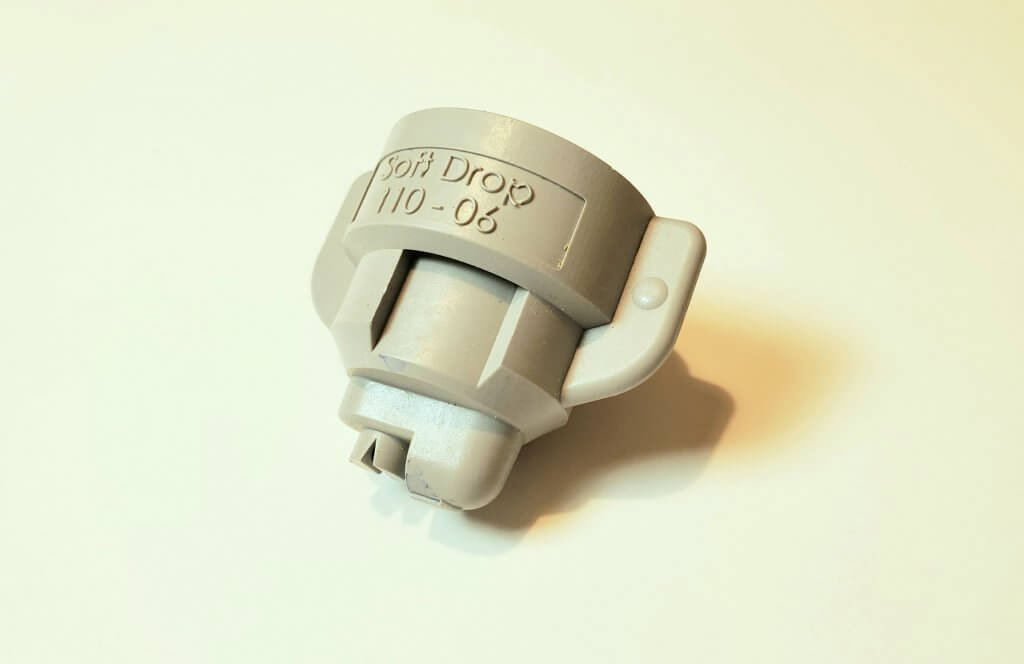
For band- and spot-sprays, the width of the spray pattern at the target height determines the dose, therefore careful selection is advised. A worksheet that shows boom heights at various fan angles and nozzle spacings is downloadable here. TeeJet and Hypro offer a selection of narrower flat fan tips, but none yet in a low-drift design. Other nozzles are in development. Agrotop has already developed a low-drift “Spot Fan”, and MagnoJet, a Brazilian ceramic nozzle supplier, has 30 and 40 degree low drift tips for sale. Wilger has develped the DX series ComboJet tips in 20, 40, and 60 degree fan angles, in a low drift (pre-orifice design that works with PWM.
The camera sensing threshold can be adjusted to optimize a specific target. For example, to specify a certain weed size, that weed can be held in view of the sensor and the user can adjust the sensitivity until the weed is properly detected. As with any higher sensitivity, this runs the risk of more false detections, resulting in over-application. But it gives the user some knowledge that an important weed stage is being targeted properly.
The See & Spray camera relies on ambient light conditions, and John Deere recommends it not be used within 30 minutes of dawn or dusk. Both WEEDit and WeedSeeker, in contrast, can operate under any light conditions.
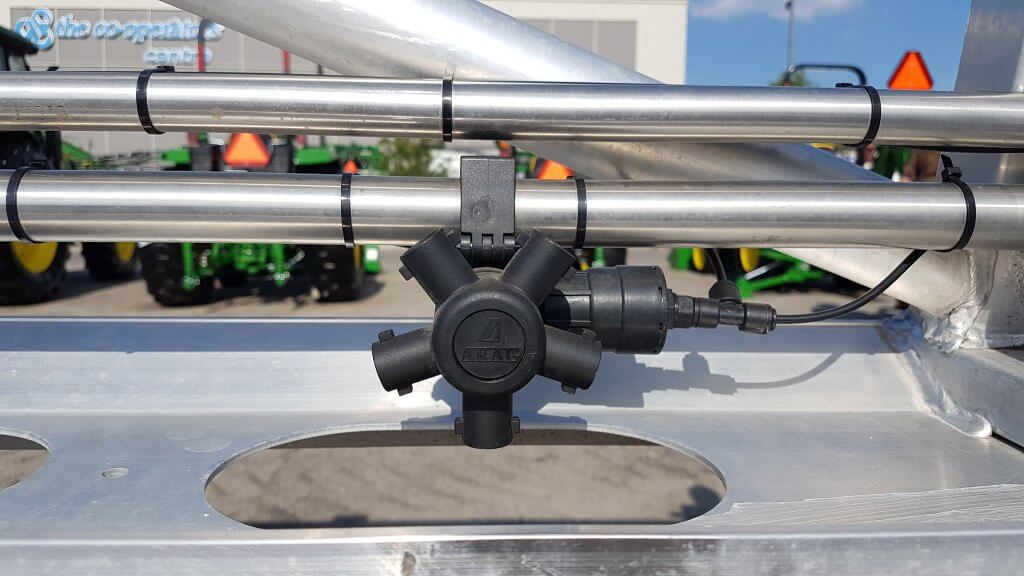
One of the challenges of running a OSS boom is the unpredictable fluctuation in flow requirement, which can theoretically range from just a few nozzles spraying to the whole boom activated in less than one second. While this extreme example is rare, a sophisticated and fast-responding pressure-based flow capability is nonetheless required. WEEDit uses a Ramsay Valve into their units to handle this challenge, whereas John Deere is relying on its existing plumbing design.
As a factory install, the See & Spray is fully integrated into the Series 4 display and is tied into JD Link. As a result, it can generate a high resolution map that shows each spot spray activation, by nozzle. The agronomic utility of this capability is significant, as it provides a very high resolution plant density map. This capability is also inherent in WEEDit and most green on Green systems available..
It’s no secret that I believe optical spot sprays represent the future of pesticide application (see here). And it’s great news to see John Deere enter the OSS area with a factory installed option. As an influential force in ag, it lends credence to the concept and will benefit all other companies vying for this space. As they say, a rising tide raises all ships.