The decision on which application method is best for herbicides boils down to two main factors: (a) target type and (b) mode of action. In general, it’s easier for sprays to stick to broadleaf plants on account of their comparatively larger leaf size and better wettability compared to grassy plants. There are exceptions, of course – at the cotyledon stage, broadleaf plants can be very small and a finer spray with tighter droplet spacing may be needed. Water sensitive paper is a very useful tool to make that assessment. Imagine if a tiny cotyledon could fit between deposits – that could be a miss!
Some weeds are also more difficult to wet, and those may also need a finer spray or a better surfactant for proper leaf contact. An easy test is to apply plain water to the leaf with a spray bottle. If the water beads off or the droplets remain perched on top in discrete spheres, the surface is considered hard to wet. Most grassy weeds are hard to wet, while most broadleaf weeds are easy to wet.
Grassy weeds are an especially difficult target because they have smaller, more vertically oriented leaves, and almost without exception are more difficult to wet than broadleaf species. All these factors call for finer sprays for effective targeting and spray retention.
Broadleaf weeds usually have more horizontally oriented leaves which also happen to be larger. As a result, they can intercept larger droplets quite efficiently.
There are about thirty mode of action (MOA) groups among the herbicides with about ten accounting for the majority in Canadian prairie agriculture. It’s probably an over-simplification to categorize them into just two groups – systemic and contact. But that grouping goes a long way to making an application decision.
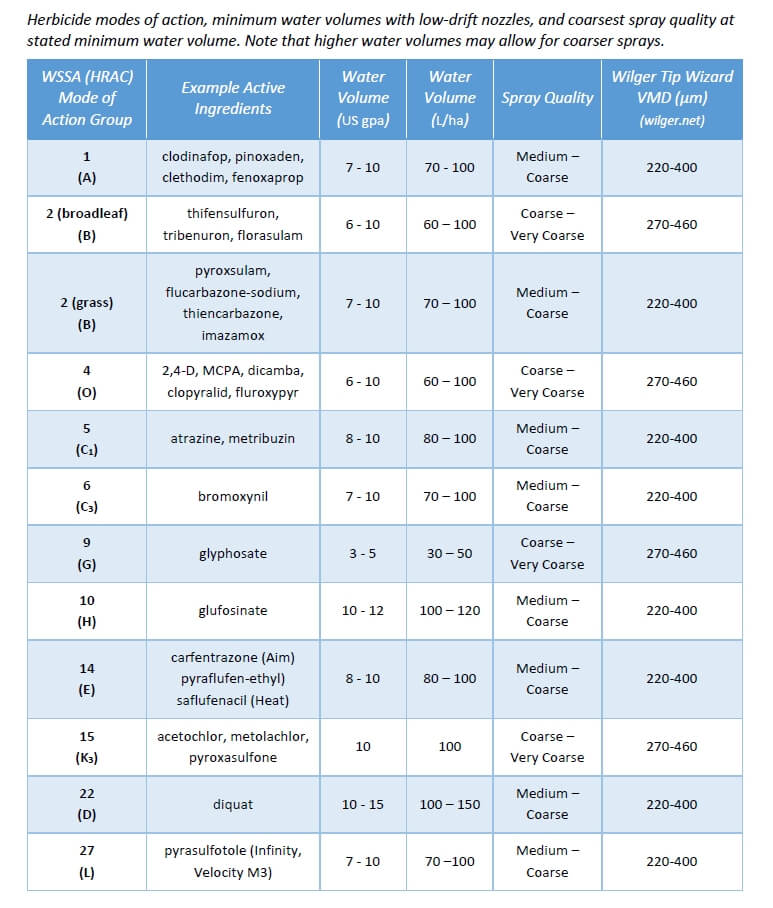
Contact products (MOA Group 5, 6, 10, 14, 22, 27) must form a deposit that provides good coverage. Good coverage is an ambiguous term that basically means that droplets need to be closely spaced and cover a significant proportion of the surface area because their physiological effects occur under the droplet, and don’t spread far from there. One way to generate more droplets is to reduce droplet diameter, another is to add more water. A reasonable combination of both is ideal because simply making droplets smaller creates issues with evaporation and drift.
Systemic products (MOA Group 1, 2, 4, 9) will translocate within the plant to their site of action after uptake. As a result, coverage is less important as long as sufficient dose is presented to the plant. In practice, this means coarser sprays and/or less water may be acceptable.
When two factors are combined, either in a tank mix or a weed spectrum, the more limiting factor rules. Application of a tank mix or product that is active on both broadleaf and grass plants will be governed by the limitation placed on grass targets. A tank mix comprised of both systemic and contact products is governed by the limitations placed on contact products.
A factor we should also consider is soil activity and the presence of residue. Studies have shown that soil-active products are relatively insensitive to droplet size. But if they have to travel through a layer of trash to get to the soil surface, more application volume is the best tool.
Below are some recommended spray qualities and water volumes for use in Canada. The spray qualities listed in the table can be matched to a specific nozzle by referring to nozzle manufacturer catalogues, websites, or apps. Note that Wilger also offers traditional VMD measurements on their site, allowing users to be a bit more specific if necessary.
PWM is gaining popularity, and there is an ever-increasing number of first-time users that need to make nozzle selections for their system. We’ve written about it here, here, and here.
Recall the PWM replaces spray pressure with Duty Cycle (DC) of a pulsing solenoid as the primary means of controlling nozzle flow. The solenoid shuts off the flow to the nozzle intermittently, between 10 and 100 times per second depending on the system. The Duty Cycle is defined as the proportion of time that the solenoid is open, and for low-frequency systems, DC is more or less linearly related to flow rate.
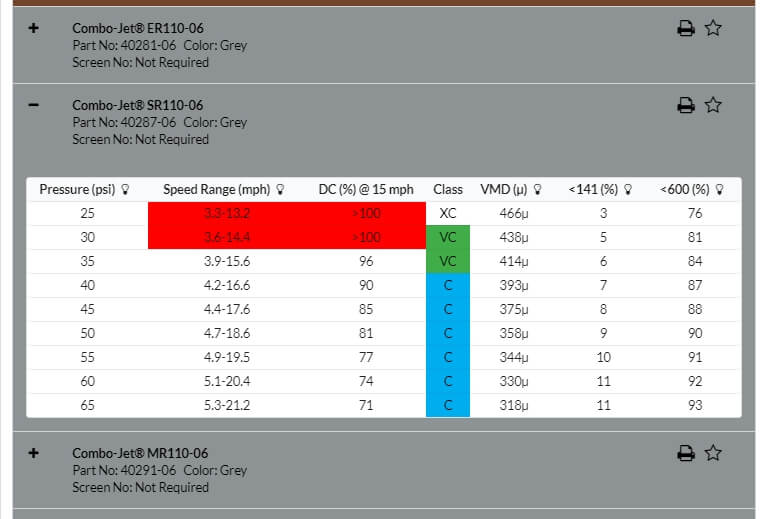
The first rule of PWM nozzle selection is to understand that under average travel speeds, we’d like to see the duty cycle of the system at between 60 and 80%. This means that the nozzle solenoid is open about 2/3 of the time. This value also describes the flow rate as a proportion of the full capacity that nozzle.
The reason for this 2/3 duty cycle rule is to enable four key features of PWM:
It’s ideal for turn compensation, allowing the outer nozzles to increase their flow 20 to 40%, and the inner nozzles to decrease flow about three-fold, in accordance with boom speed.
It allows speed flexibility, providing some additional speed, but more importantly, reduced speeds should conditions require it, without a change in spray pressure.
It compensates for pressure changes so that spray quality can be adjusted without requiring a speed change. Less pressure reduces nozzle flow, and increasing DC recoups accordingly.
It allows for customized higher flows of certain nozzles, perhaps behind wheels, to address reduced deposition in their aerodynamic wake (available on some PWM systems).
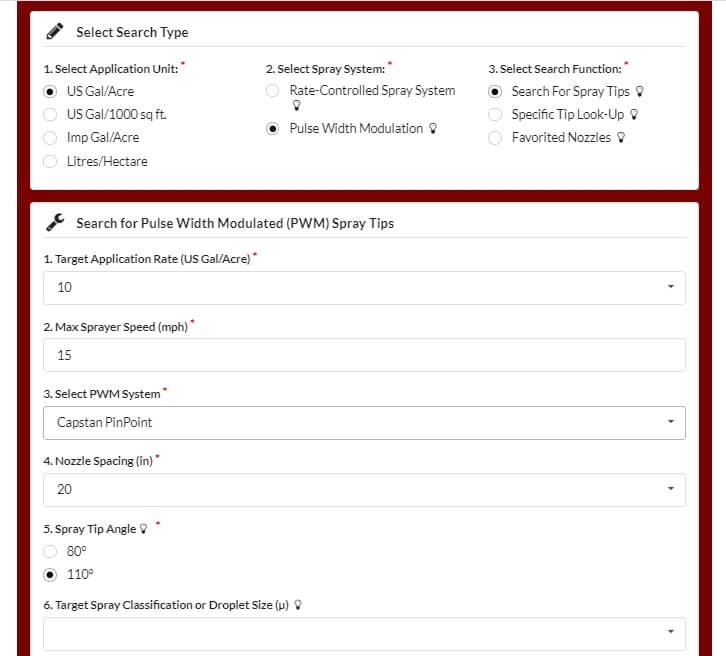
The best tool for selecting the right nozzle size is Wilger’s Tip Wizard. This site asks for your desired average speed ( although it calls this “Max Sprayer Speed”), and reports the expected DC for a host of nozzle size solutions and pressures. It also reports maximum and minimum travel speeds and other useful information such as spray quality.
Fig 1: The Tip Wizard is a useful tool for sizing nozzles on any PWM system. Sizing information applies to any nozzle. Spray quality information is for Wilger ComboJet nozzles only.
Although intended for Wilger nozzles, the site’s sizing feature works for any nozzle brand. It asks the user which PWM system they have for the purpose of calculating the documented pressure drop across the solenoid.
Fig 2: Tip Wizard results for the Wilger SR11006 tip at 10 gpa and 15 mph. Look for a solution that provides 60 to 80% Duty Cycle (DC).
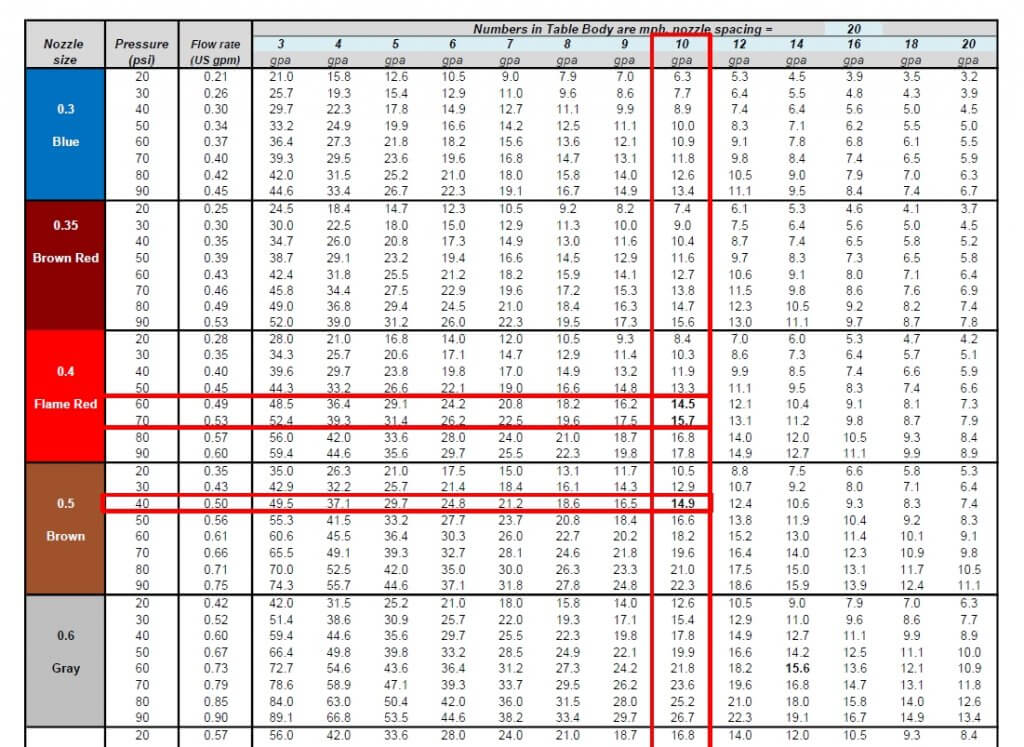
If you don’t have access to the site, a basic calibration chart can still work with a simple trick. Recall that we use the top row to identify the desired water volume, and the table’s interior values are speeds, as described here.
Below are two solutions for someone wanting to apply 10 gpa at 15 mph without PWM. The correct choice depends on the required pressure to produce the needed spray quality.
Fig 3: A conventional calibration chart, solving a 10 gpa application for 15 mph.
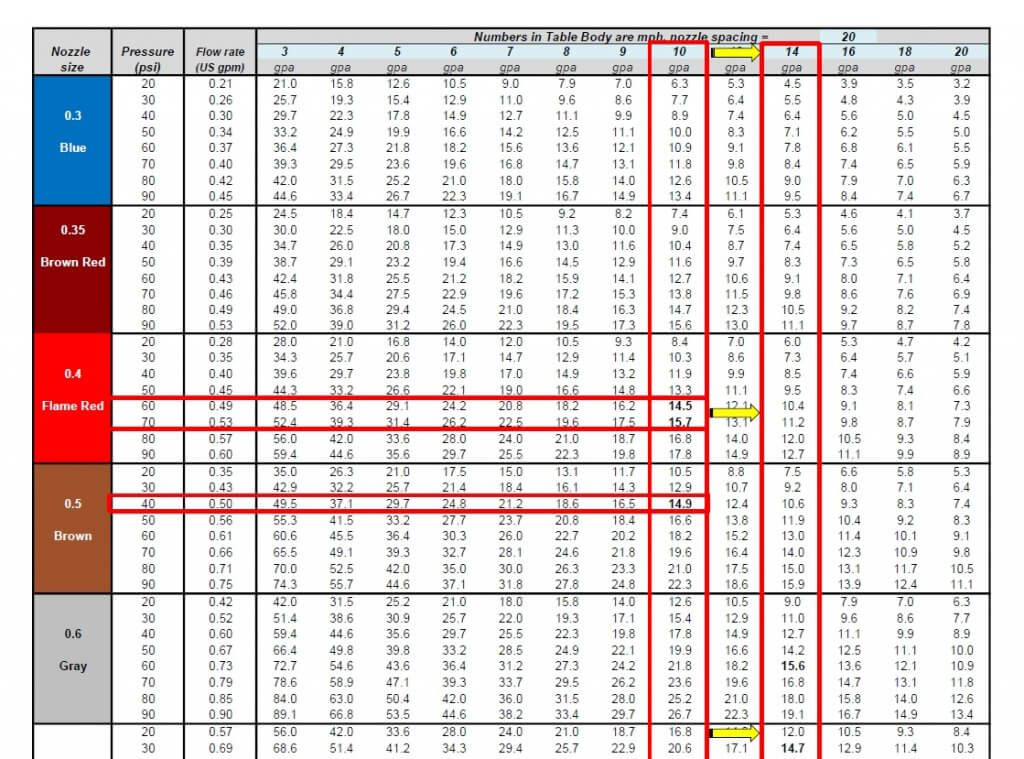
If you want to apply the same 10 US gpa using PWM, simply solve for a larger volume that offers the right DC. For example, choosing 13 gpa will over-apply by 3 gpa, or 30%. The PWM system adjusts by running at 100-30=70% DC. If the chart doesn’t offer 13 gpa, go nearby, to 14 gpa, as we did below:
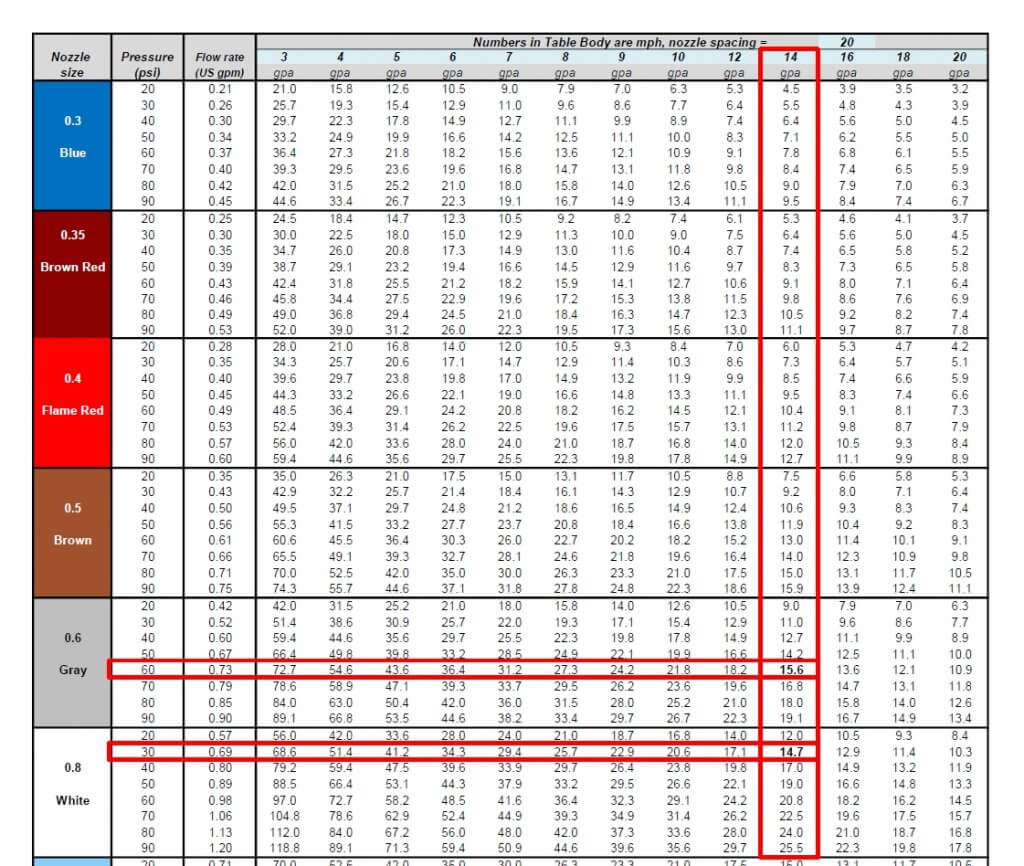
Fig 4: By pretending to require 14 gpa instead of the actual 10 gpa, the conventional calibration chart is tricked into solving for a nozzle size that will work with PWM at 60% Duty Cycle.
Now solve for the same target speed, 15 mph. The solution will run at 60% DC. Again, there is more than one choice, and that will depend on the spray pressure needed.
Fig 5: Two possible solutions for achieving 10 gpa at 10 mph. An 06 nozzle at intermediate pressure or an 08 nozzle at low pressure.
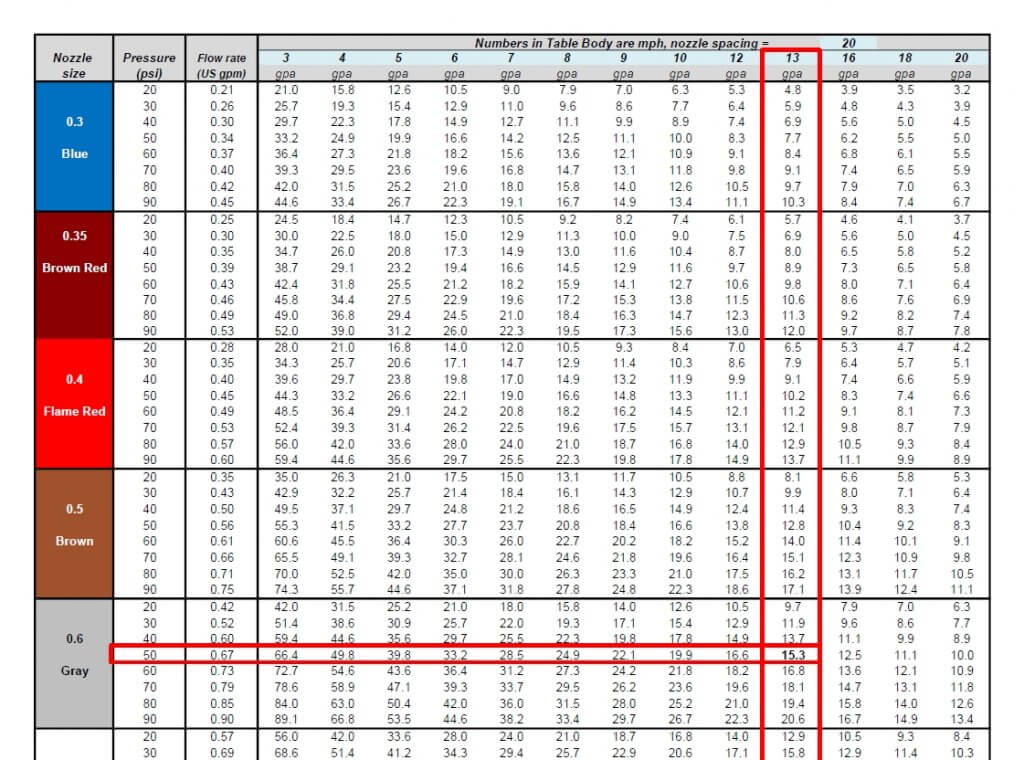
We’ve developed a template, in US or metric units, that can be customized for any water volume. Here is the same chart with 13 gpa added:
Fig 6: A conventional calibration chart with the 13 mph speed added.
The best solution for 10 gpa at 15 mph is the 06 size nozzle at 50 psi. This is not engraved in stone. One of the nice things about PWM is that it has inherent flexibility. Make the nozzle pressure a priority to get the correct spray quality. It really doesn’t matter whether the resulting DC is 65 or 80%, the system will still work well. Simply avoid extremes that take you below 50% or above 90%, they will limit the system’s capabilities.
It can handle any water volume or nozzle spacing by filling in the blue cells. Two additional worksheets in the file automate the process, simply enter the desired application volume, travel speed, and nozzle spacing (yellow cells), and the solution that offers the optimal duty cycle range will be highlighted in light green.
We’ve often heard the adage “Coverage is King” but what does that mean, exactly? It means that in order for your spray application to yield acceptable results, a threshold amount of the active ingredient in your tank must end up on the target. But at what point have we achieved sufficient spray coverage without wastefully over-applying to the target? What does good coverage look like?
Let’s manage expectations right here at the beginning of the article: There is no single, definitive answer because it depends on the nature of the application. In other words, you have to understand which factors are relevant to your specific situation before you can understand what success looks like.
Let’s highlight some of those factors:
Transfer Efficiency, Catch Efficiency and Retention
This relates to the spray’s ability to span the distance from nozzle to target (transfer efficiency) get intercepted by that target (catch efficiency) and then deposit a biologically-active residue on the target surface (retention).
First, the spray must reach the the target location. This may be the soil, or it might be the underside of a leaf deep in a plant canopy. The degree of success will depend on the droplet size(s), distance to the target and the environmental conditions.
Then the droplets have to be retained by the target surface and not bounce or slide off. Difficult-to-wet surfaces such as fruit, stems and waxy vertical leaves may be more easily covered with finer droplets and/or formulations that include activator adjuvants (e.g. surfactants).
Then the deposit must stay wet long enough to be absorbed by the tissue, or leave a hardy residue on the surface that can withstand weathering (e.g. precipitation, sun, and even bacteria) long enough to encounter the pest. More on this below.
Mode of Action
This relates to where spray must deposit (or relocate to) in order for it accomplish it’s objective. Here are a few examples of how products might work. Read your pesticide label to determine your situation.
Some products require contact. Insects must touch them, either via a droplet landing on them or as they move through a deposit. Similarly, certain fungicides must contact fungal hyphae on the plant surface. A few products are designed to drench the target, as is the case with oil-based miticides.
Some insecticides must be ingested. That may be in the form of a surface deposit or in plant material that has absorbed the chemistry. Similarly, some fungicides are absorbed by plant tissue.
Many herbicides are mobile (i.e. systemic). They may be drawn up through the roots, or enter the cytoplasm via leaves and travel to the growing points on the plants, or move through the xylem. Others are contact, staying relatively close to the original deposit.
The sprayer operator should consider these factors when planning the application and when evaluating the resulting coverage. So how do we visualize coverage? Some operators look for the shine on leaves, or a cloudy residue once the spray has dried. That’s better than nothing, but we recommend water sensitive paper (WSP), which is still the most versatile and economical way to visualize coverage.
WSP can be purchased from most retailers that carry spray equipment. It is available in three sizes, of which the 1” x 3” size is the most common. It can be folded and clipped to a plant surface, or placed on the ground. We’ve written several articles on how to use it (such as here and here and in pretty much a third of the articles on Sprayers101).
There are two metrics that must be evaluated when assessing coverage on water sensitive paper:
the area of the target that has spray on it, and
the distribution of the droplets over that area.
Let’s use a metaphor to explain:
The Battleship® / Coverage Metaphor
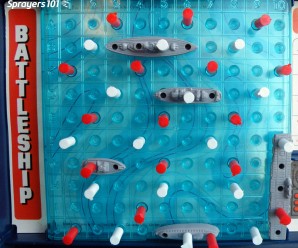
Imagine the boats in this Battleship® game are the insect pests, and the board they’re on is a leaf. The white pegs represent the spray deposits. In this first image, we see 100% coverage and a very high deposit density. Sure, we got every boat, but this is literal and figurative overkill. There’s no need to completely drench the target in order to control most pests. When you spray a target past the point of run-off, you are not adding more pesticide to the target – you are displacing what was already there. The surface will not exceed the concentration of product you sprayed (with the possible exception of mixes that include certain adjuvants). While additional volume can improve coverage to a point, there is a diminishing return.
Unless the label specifically asks for a drench, this is too much coverage.
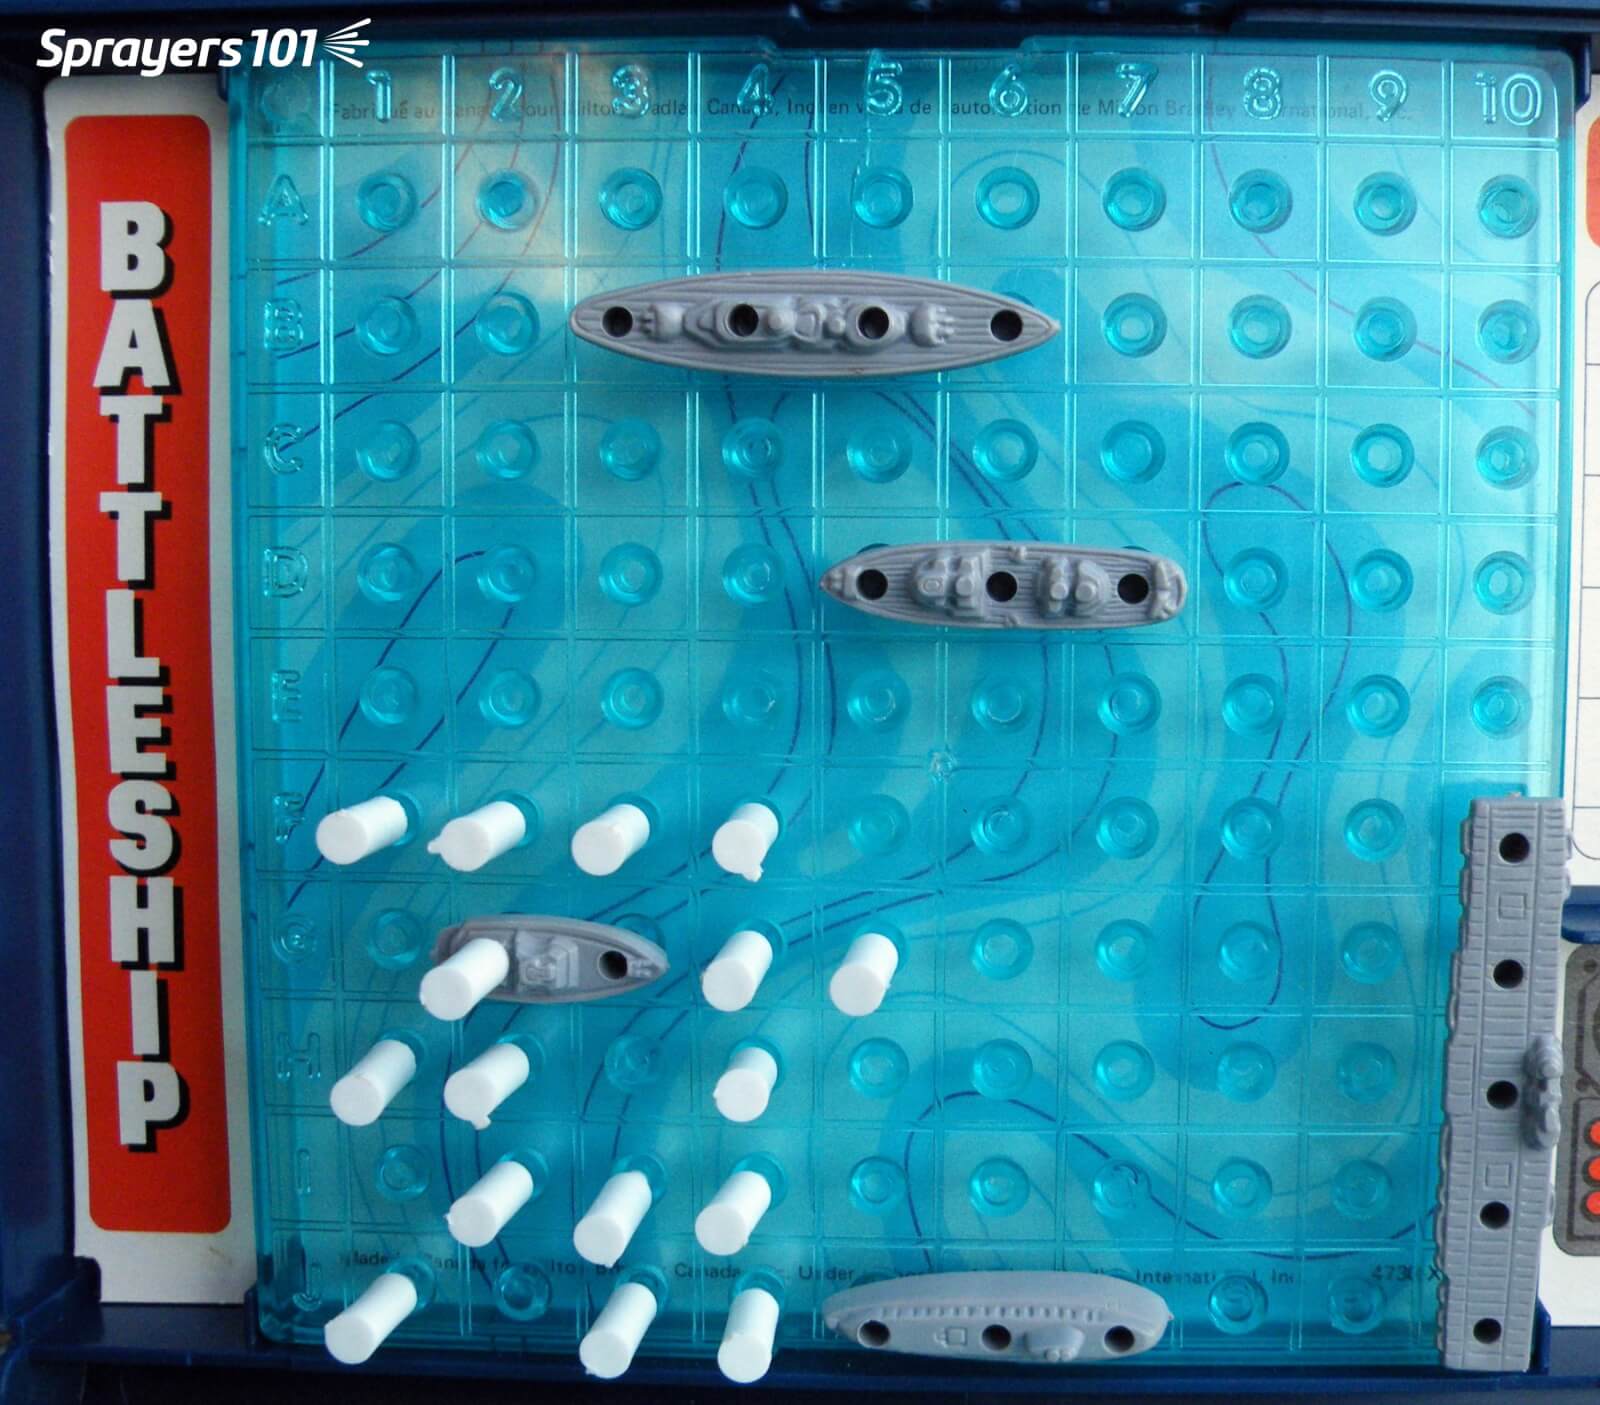
In this second image, we’ve covered about 15% of the target area, which is reasonable. However, note the lack of distribution. You can see that we’ve missed quite a bit of the leaf. If our pretend pests are sedentary and if this was a contact product, then we’ve missed. If this was WSP we would advise the sprayer operator to note how much space there is between the deposits. Could a pest such as an insect or small weed easily fit between the deposits?
15% coverage is good, but the distribution is bad.
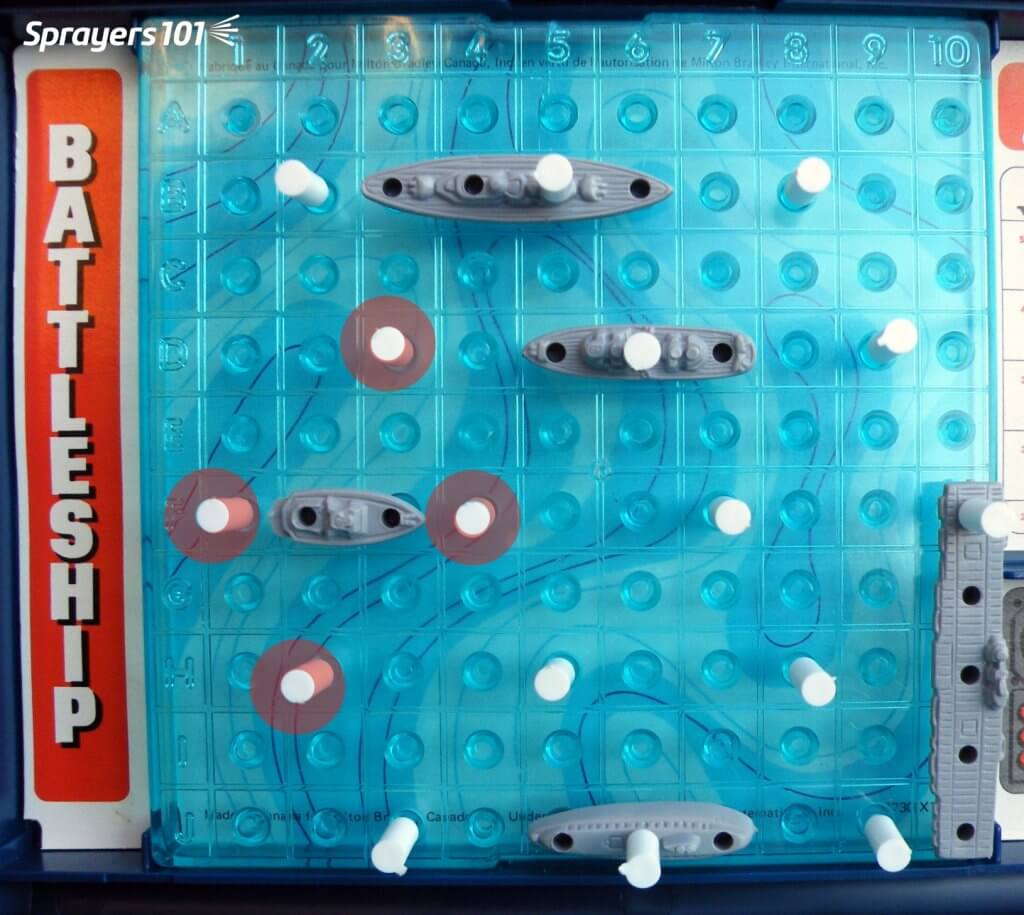
In this third image, we are still covering about 15% of the target, but now the spray is distributed more evenly. Some of you are likely noticing that we missed a pest. That observation reminds me of one of my favourite exchanges from the movie “Christmas Vacation” where Clark finally got his house illuminated, but his father-in-law only sees the problems: “The little lights aren’t twinkling.” “I see that and thanks for noticing, Ed.”
15% coverage, distributed evenly. Deposits may have some pest activity beyond the edge of the residue (light red circles).
Yes, we still missed a pest, but spraying is playing a game of odds. You want enough spray to increase the odds of controlling a pest, but not so much to waste spray (and money and time). This image represents an ideal coverage situation. If this pest moves, or this pesticide redistributes even a little, it will affect the pest.
Plus, we should not discount the threshold of influence that lies around pesticide residue. Imagine a small circle around each droplet (illustrated here as light red haloes) where active ingredient may redistribute beyond the initial deposit to affect an adjacent pest. Perhaps even more importantly, deposits do not spread on WSP the way they do on actual plant tissue, so WSP always gives an underestimate of the potential coverage.
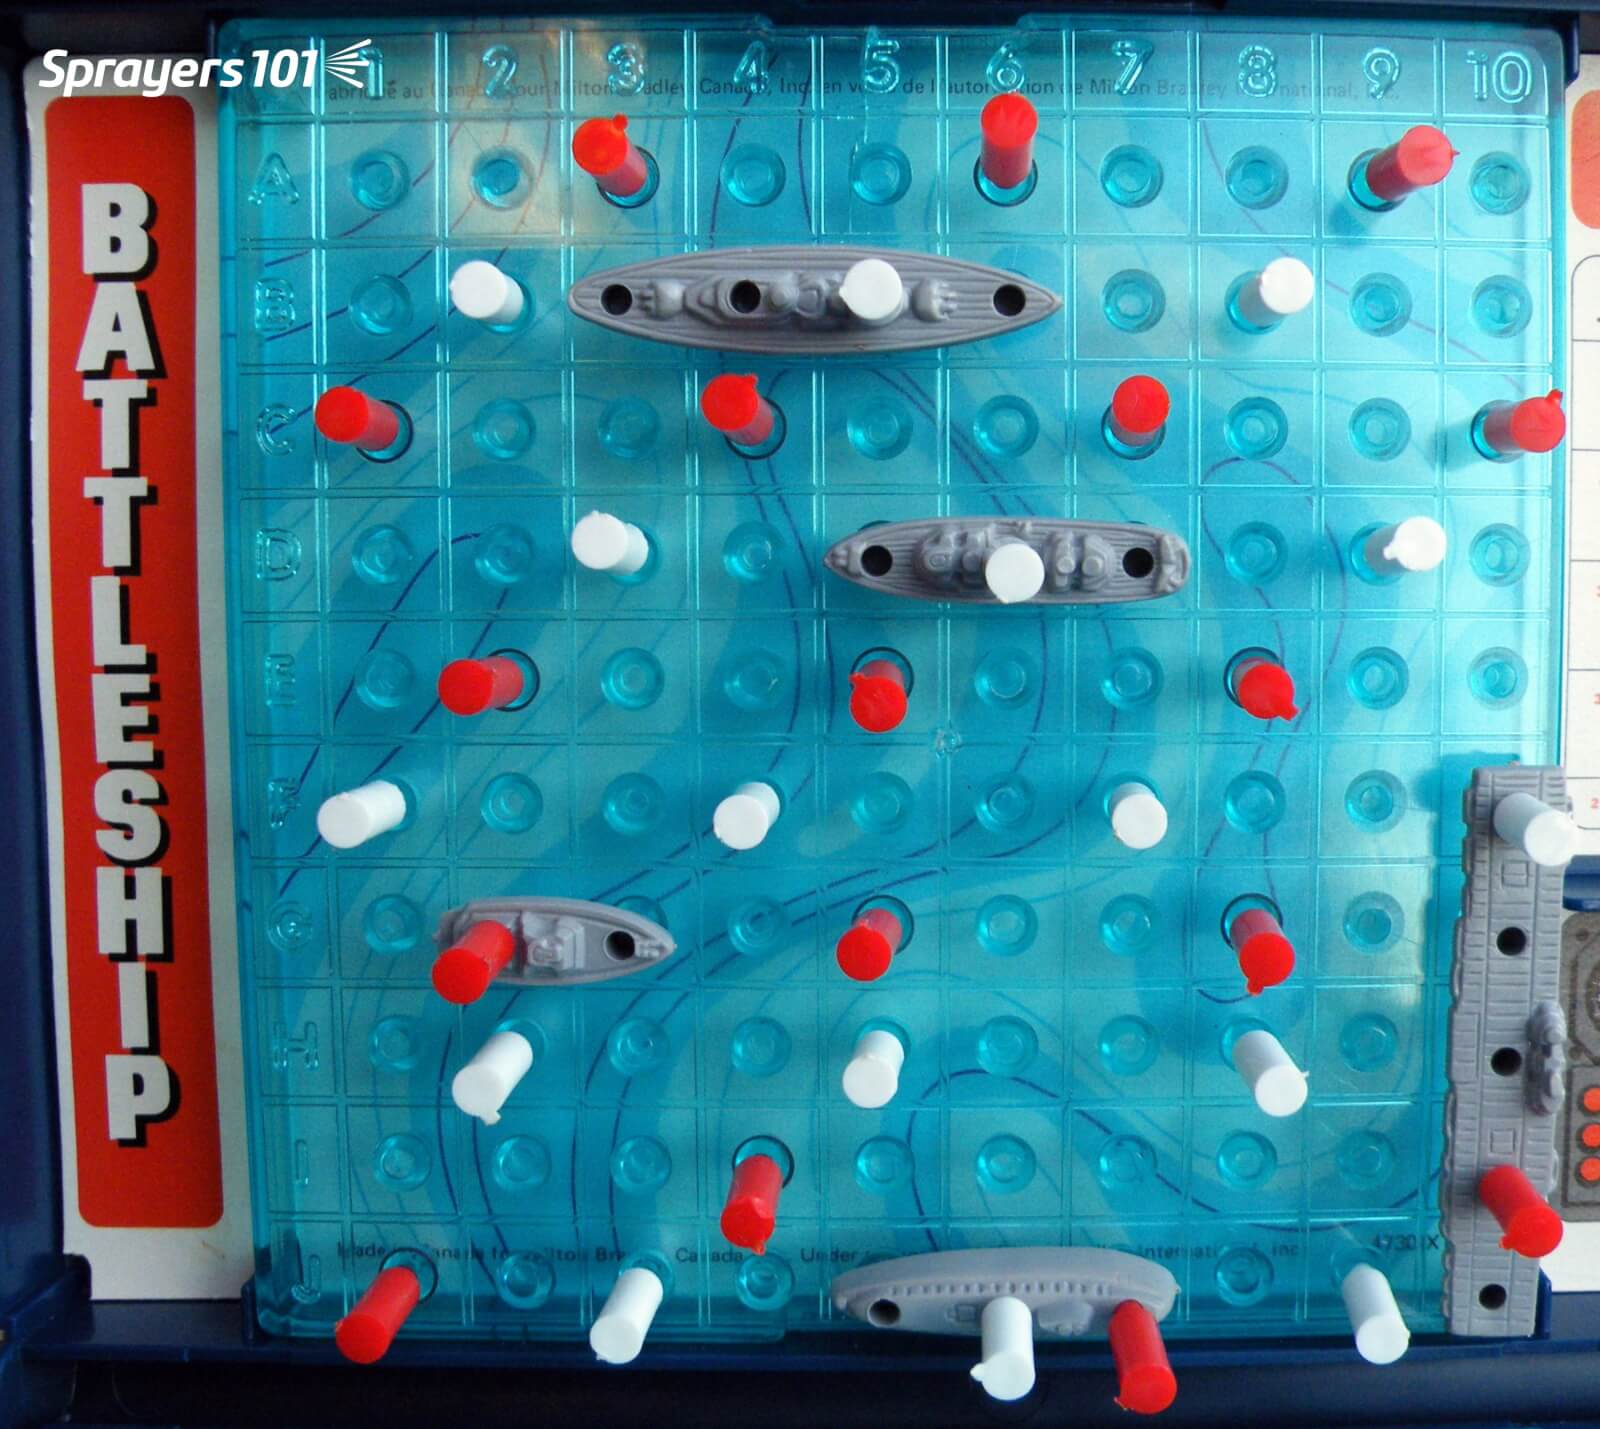
In this last image, we see that red deposits have been introduced. This represents a disease control program where an earlier (white) application retains some residual activity when next application (red) is applied. The second spray application almost never lands on top of the first, giving much more protection on the target. For those keeners out there, note that we got that last pest!
In the case of many disease management programs, subsequent sprays tend to fill in gaps left by previous sprays. If timing is prompt, residual activity will see you through.
If you Absolutely Need a Number…
So, what if you’ve read all this but still insist on a firm number to define adequate coverage? We’ll reiterate that there’s no universally-accepted threshold of deposit density or area covered. It would be nice if pesticide labels included this information, but they don’t.
We’ll stick out necks out and say that in general practice we see excellent results when we achieve 85 discrete deposits per cm2 as well as 10-15% surface coverage on at least 80% of the water sensitive papers in a spray application. If you can manage this, it should give satisfactory results in most situations.
Ontario Agriculture Conference – 2022
For a really in-depth conversation on the topic of coverage, check out our presentation from the 2022 Ontario Ag Conference. We tried to deliver a fun and memorable demo at the end of this presentation to show how different droplet sizes might contribute to coverage. Enjoy.
North American built boom sprayers have nozzle spacings of 20” (50 cm in the rest of the world), but other spacings such as 15” (37 cm) and 10” (25 cm) also exist. What are the reasons for these alternative spacings and do they offer any inherent advantages?
Why spacing matters
Nozzles are spaced along a boom to allow their fans (patterns) to overlap sufficiently at the target. In broadcast spraying, a uniform distribution of spray volume gives us the best chance for consistent coverage along the boom. Since flat fan nozzles produce a tapered pattern (i.e. the volume is highest in the centre and diminishes towards the edges), approximately 100% overlap (i.e. 50% from each neighbour) will produce a uniform swath.
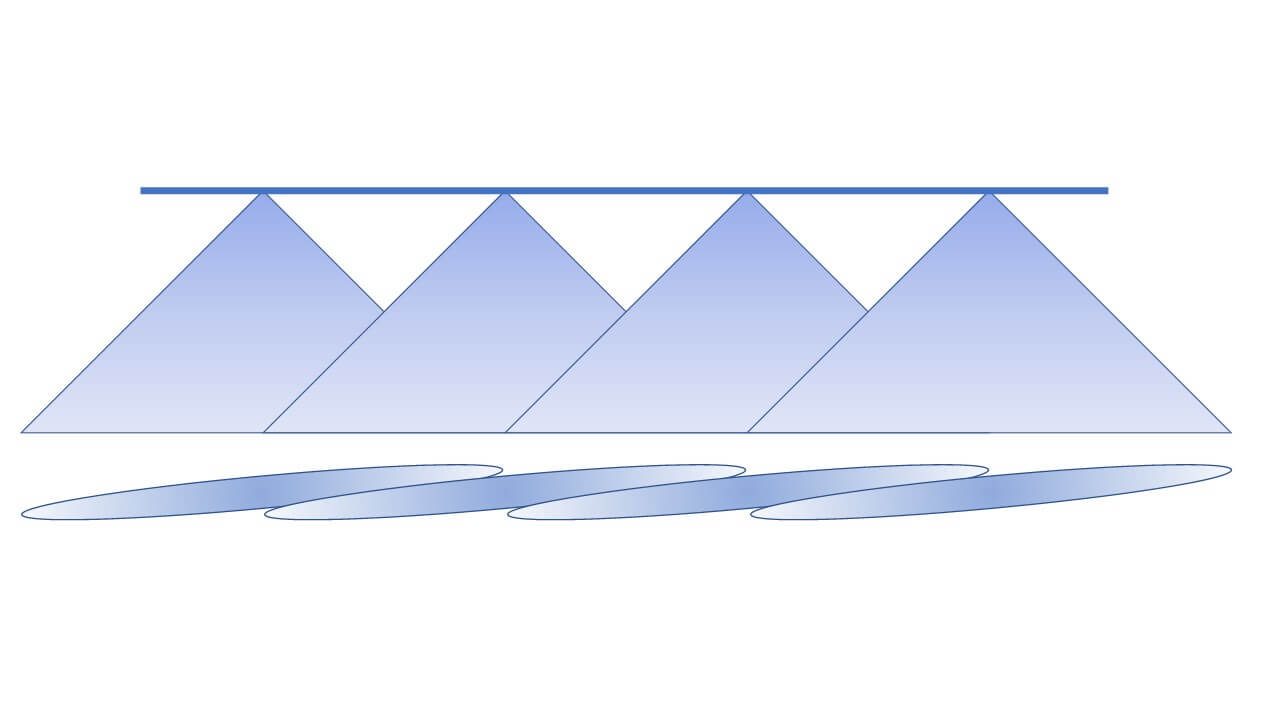
Figure 1: Tapered flat fans that require some overlap are the default pattern type for agricultural boom nozzles. This is true of conventional and low-drift styles. Note that the flat fans are turned 15° to prevent the spray patterns from interfering with one another.
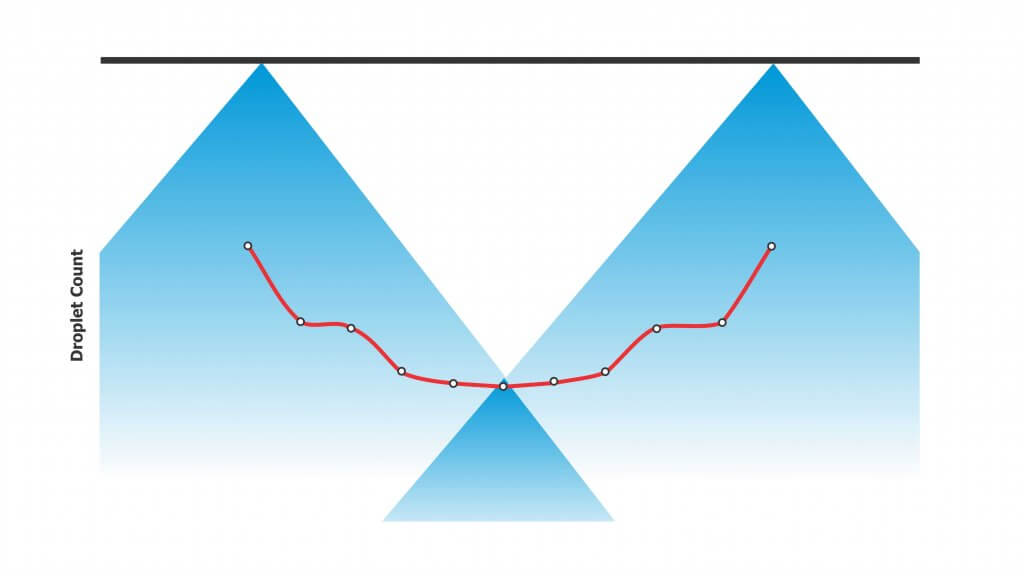
The 100% overlap isn’t just for volumetric distribution. Flat fan spray patterns tend to have more and finer droplets in the centre and fewer and coarser droplets at the edges. All droplet sizes contribute to coverage in different ways, so the overlap ensures both number and sizes are evenly distributed along the entire boom.
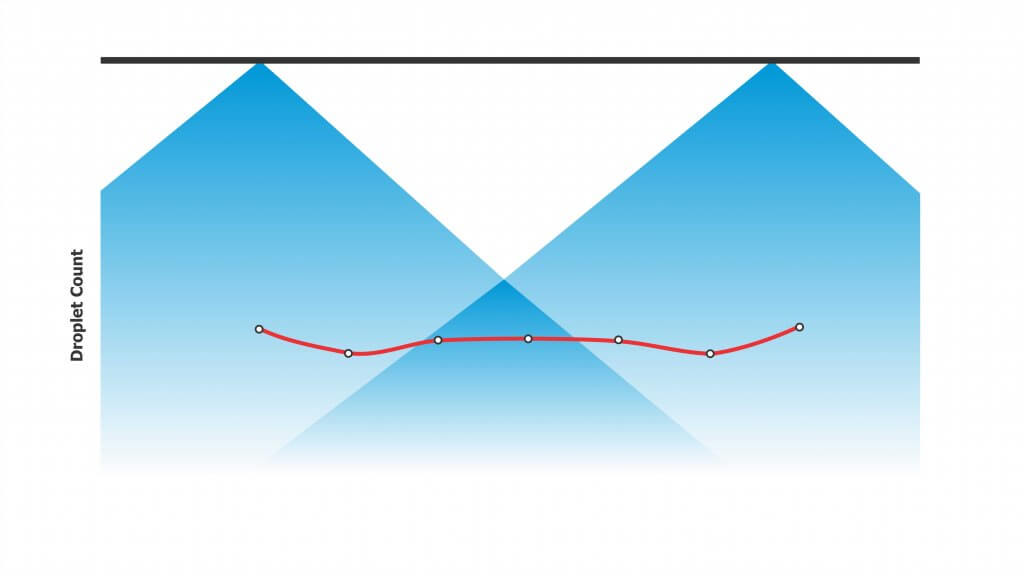
Figure 2: 30% overlap may achieve volumetric uniformity. But because the centre of the pattern contains the majority of the smaller droplets, low overlap may result in low coverage in the overlap regions, resulting in striping.Figure 3: Consistent droplet number distribution along the boom requires at minimum 100% overlap (50% from each neighbouring nozzle). This blends those regions of the patterns with high and low droplet densities.
The generic 20” spacing arose from long-held conventions about boom height, fan angle, and travel speed. Specifically, this spacing required a boom height of 20” to obtain good overlap of the once-dominant 80° fan angle. Combined with 0.15 to 0.3 US gallon per minute (gpm) nozzles and travel speeds of 6 to 8 mph, operators were able to apply 5 to 15 US gallons per acre (gpa) volumes. Using nozzles with smaller flow rates would generally result in nozzle blockages.
But what if we want to change any of those variables? How does this affect nozzle spacing? Figuring out the pros and cons of an alternate spacing requires a little math and some contingency management.
Boom Height Math
First the math. If the boom has 20” nozzle spacing and we need 100% overlap, the width of the spray pattern at target height must be two times the nozzle spacing, which is 40″. You must calculate the required fan angle and boom height to achieve this. Most nozzle catalogues have tables to help with this, or you can download a handy spreadsheet to calculate your own scenarios here.
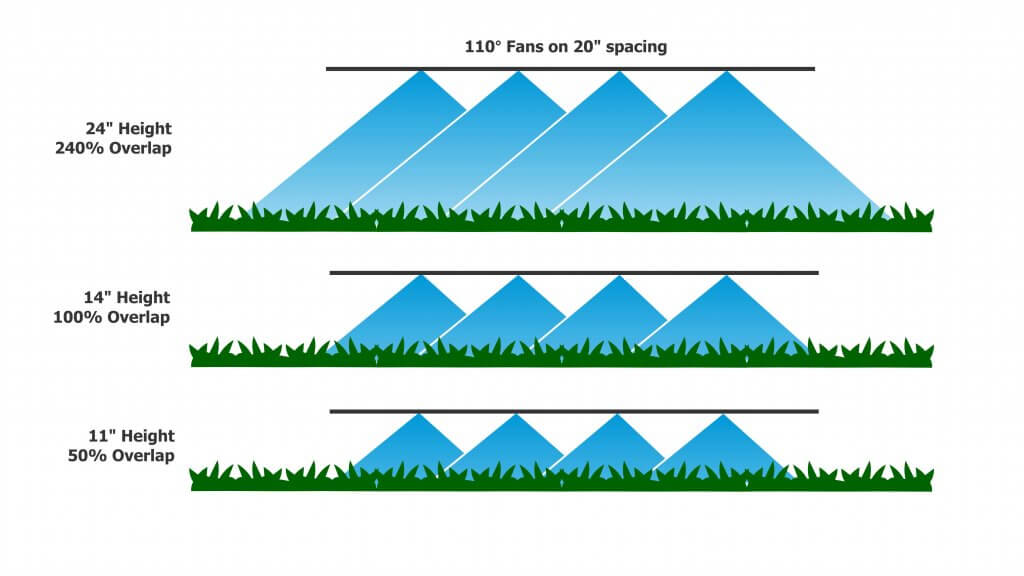
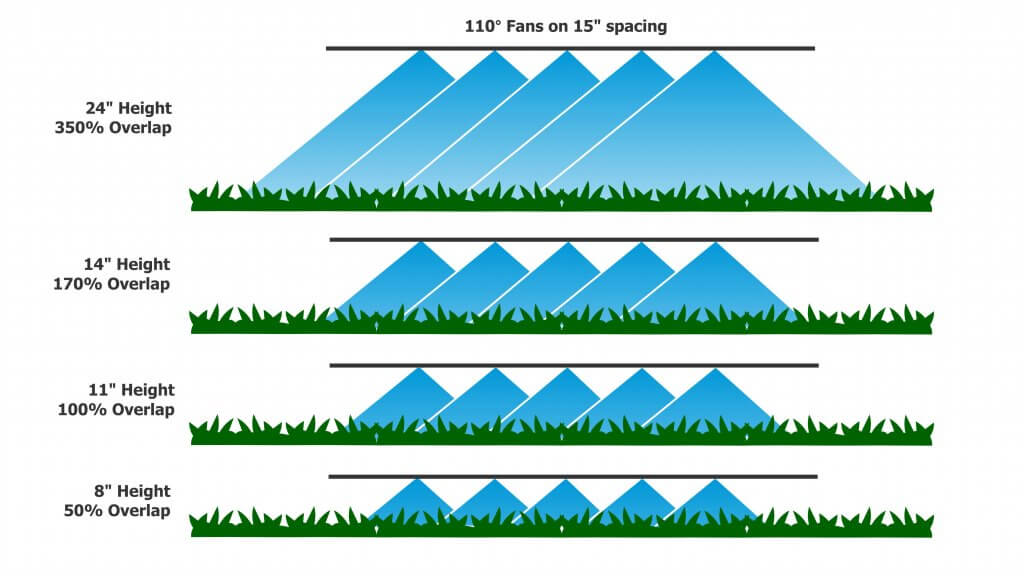
For today’s standard 110° fans, a minimum boom height of 14” is needed to achieve 100% overlap. For 15” spacing, the height is reduced to 11”. For 10” spacing, we drop to a mere 7”. However, consider that most modern suspended booms are not operated at heights less than 24” to allow for sway. At that height, there’s plenty of overlap to go around for 20″ nozzle spacing. For those booms that are able to operate at a consistent height, narrower spacings permit lower heights that will reduce drift potential significantly. Every time we halve boom height, we also halve drift potential.
Figure 4: Using 110° tips with 20″ spacing, the theoretical height at which we achieve 50% overlap is 11″ above target.
By tilting the nozzles forward or backward from the vertical, we can reduce the boom height somewhat further and still get the same overlap. For example, for 20 and 15” spacings, angling nozzles forward or backwards by 30° allows us to drop the boom another 2” closer to the target.
Contingencies
A suspended boom hardly ever stays at a uniform height; It sways up and down with field conditions, topography, etc. This is why many operators set their booms above the minimum height – to prevent striping when the boom sways low. The penalty is that this increases the distance droplets need to travel, increasing drift potential and any turbulent displacement problems arising from the moving boom.
Assuming a 110° flat fan at 24” boom height, each nozzle achieves a theoretical pattern width of about 70”, which is an overlap of 70÷20=3.4-fold or 240% on 20” nozzle spacing. Given a minimally-acceptable overlap of 50% (25% from each neighbouring nozzle), the boom could be as low as 11”. For 15” spacing, the minimum height for 50% overlap is 8”, and for 10” spacing it’s 5”. This means the narrower spray patterns gain 3” to 6” in allowed downward boom movement.
Figure 5: Using 110° tips on 15″ spacing, the height for 50% overlap is 8″ above target.
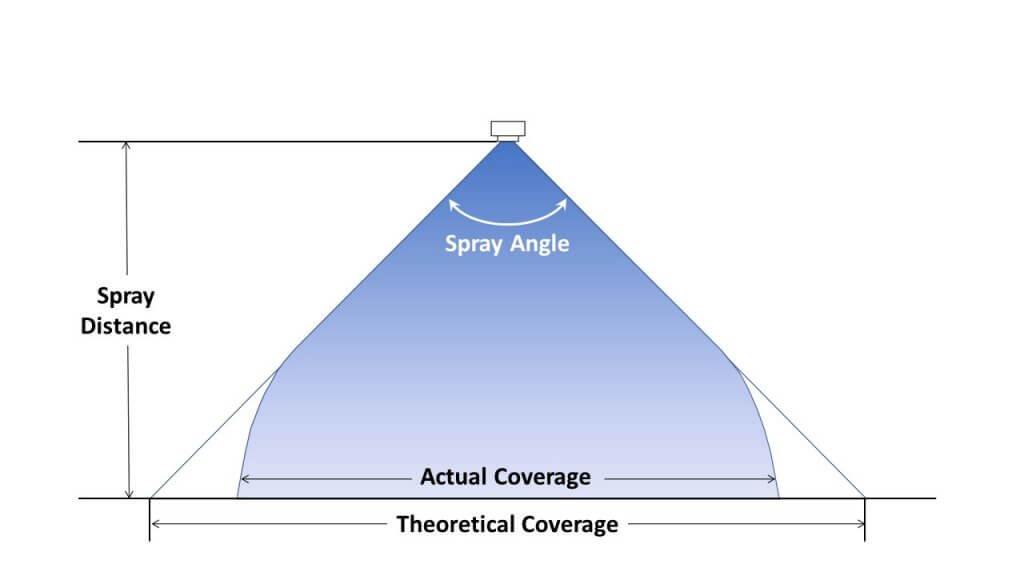
A second contingency is that spray patterns are rarely the exact value that the nozzle catalogues specify. A so-called 110° nozzle may operate at only 90°, or up to 150°, depending on the nozzle model, the spray pressure, and the tank mix. Learn more here and here. Patterns also don’t continue to grow at their rated fan angle, as droplets slow due to air-resistance and fall more vertically due to gravity. For that reason, a visual check is recommended to ensure the expected overlap is achieved.
Figure 6: Fan angles indicate initial trajectories of droplets at the edge. With distance, gravity pulls these droplets downward, narrowing the pattern width from that achieved theoretically (figure adapted from image in TeeJet catalogue).
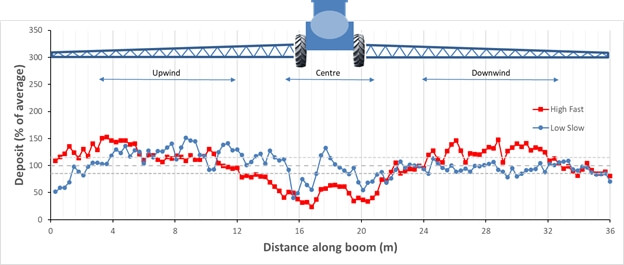
A third issue to consider is less related to boom height but nonetheless affects spray distribution. Small droplets move with air currents, and the turbulence created by large, fast sprayers creates enough turbulence to move these droplets significantly. A perfect pattern under static conditions can look quite different at a fast travel speed with a modest side wind. Low booms may help prevent some of this displacement because droplets spend less time in flight, and their average velocity is faster.
Figure 7: Spray deposition onto a 2 mm string to measure deposit uniformity for a fast travel speed and high boom and a slow speed, low boom configuration.
Flow Rate Math
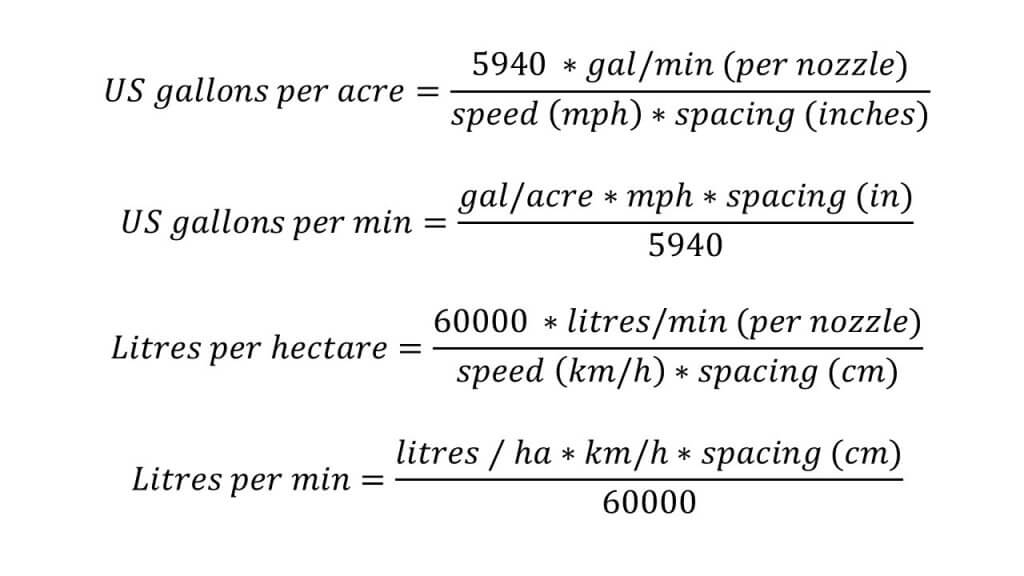
Flow rate requirements per nozzle change whenever we equip a boom at an alternate spacing. The basic formulae are shown below.
Moving from a 20″ to a 15″ spacing would require a nozzle with 0.75 of the flow rate, approximately from a 02 to 015 size, or 03 to a 025 size, or 04 to 03 size, etc.
Pulse Width Modulation
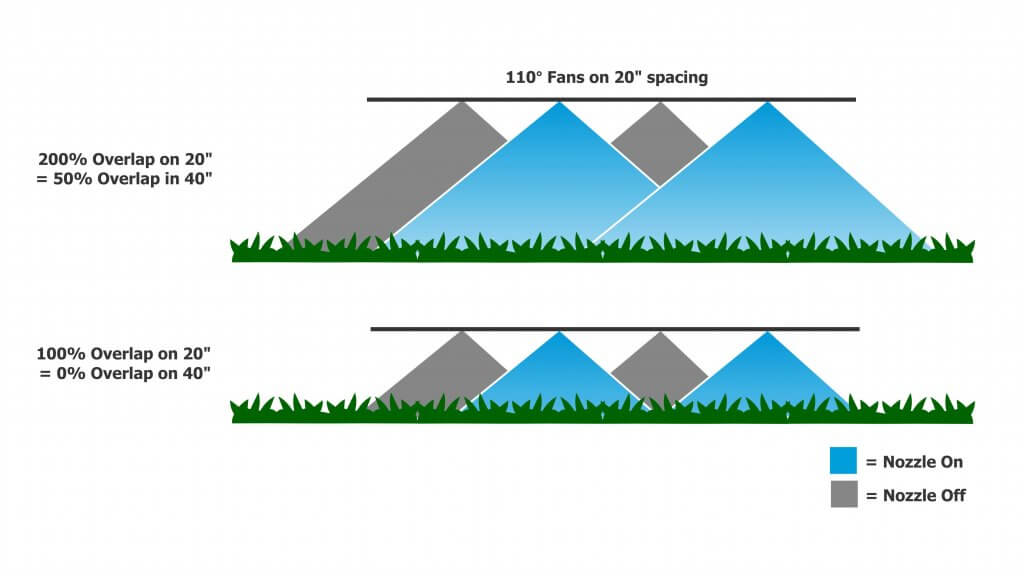
The use of Pulse Width Modulation (PWM) has increased the overlap requirement. With PWM, alternate nozzles are on a 180° timing offset from their neighbours. This means that when running >50% duty cycle, when one nozzle is temporarily off, its neighbours are on. These neighbours’ patterns must now span the gap, and 100% overlap is the absolute minimum to achieve this. PWM users therefore select the wider pattern angles and some opt for >100% overlap.
Figure 8: Pulse Width Modulated booms require 200% overlap so that the entire boom receives proper coverage when the alternate set of nozzles is off. For 110° fans at 20″ spacing, the minimum boom height would be 21″
PWM Considerations
High flows (greater than 1 US gpm at the nozzle) that are common for fertilizer top-dressing may require higher-flow PWM valves.
Narrow spacings reduce the individual nozzle flow rates and can therefore support higher application rates before triggering a larger valve requirement.
PWM valves aren’t cheap and for example 15″ spacing compared to 20″ spacing adds 24 valves on a 120′ boom.
Banding
We noted that 20” nozzle spacing is a standard because it corresponds to what has traditionally been achievable with available boom heights and spray pattern angles. But things can change.
Narrower spacings such as 15” originate with row crops and planter row spacings of 15” or 30”. These spacings exist so the spray pattern can be placed either over the top of a crop row, or in between the rows for banding. Using narrower fan angles and/or lower boom heights, together with “even” (as opposed to “tapered”) fans, banding sprays can be applied over the top of, or between crop rows. Or drop hoses can reach between the rows for top-dressing or directed sprays into the canopy.
Canopy Penetration
With narrower spacing, it can be argued that a greater proportion of the boom length has spray directed directly downward (corresponding to the centre of the pattern). Whether or not this translates into better penetration of a canopy is a fair question. In laboratory trials, use of 10” or 20” spacing did not improve penetration into a broadleaf canopy. But if the lower boom height afforded by the narrower spacing was utilized, some improvements in the deposit of angled sprays onto vertical targets was observed.
Adjusting to Narrower Spacings
As we showed earlier, use of 15” or 10” spacing booms for broadcast sprays requires a smaller nozzle size to achieve the same spray volumes as the 20” spacing. If boom height remains constant, narrower spacings result in greater pattern overlap which provides more latitude for sway. Alternately, lower boom heights can be used.
Using smaller nozzles on narrower spacing presents some challenges. Generally, smaller nozzle size means finer spray quality. If an operator wants to retain the spray quality they had on a 20″ spacing, they may opt to use lower pressure (not advisable for non-PWM systems) or swap to different nozzle design that can produce the desired spray quality at the lower flow rate.
Smaller nozzles are more prone to plugging, so that needs to be managed with filtration, filling practices and water sourcing. Be aware of the the product formulations and their requirements for filter mesh size. Most dry products specify a 50 mesh filter (or coarser). Also, check size options for nozzles. The smallest size for most nozzle models is 015, but certain PWM-specific nozzles are only available in 03 or larger.
The marriage of narrow spacings with individual nozzle shutoff can result in a versatile system capable of producing high resolution banded sprays in narrow seeded crops. For example, consider a boom with a 10” nozzle spacing spacing that matches the seeder row spacing. The operator can shift from 10” to 20” or 30” from the cab if the valve control software allows it. With accurate guidance and good boom levelling, topdressing foliar products (e.g. nutrients, fungicides) can follow the crop row precisely.
Spot Sprays
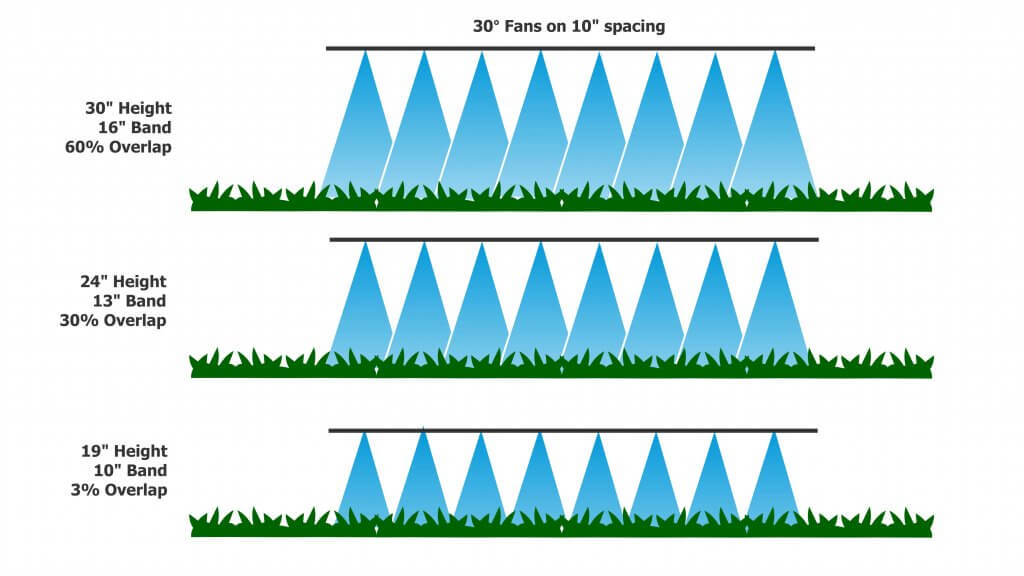
Spot sprays present a situation where compromises are needed. Some, such as WEEDit, utilize narrower nozzle spacings to allow better treatment resolution and increase product savings. Any one nozzle or sets of adjacent nozzles may be triggered by the sensor. For single nozzle activation, to preserve the value of the better resolution a uniform, narrow band of spray needs to be created. This means a 30° or 40° fan angle from a banding nozzle will be necessary. For example, a 24” boom height will result in a 13” band with a 30° fan, and an 18” band with a 40° fan. In the latter case, the dose would be diluted by 80%, wasting much of the potential savings.
Figure 10: Boom height is critical for banded sprays and for spot sprays. Too wide a pattern on a single nozzle reduces dose, too narrow creates misses.
Frequently, a patch of weeds will trigger several adjacent nozzles. Now these individual bands need to work together to create a uniform swath. This will inevitably require some overlap to avoid gaps, but too much overlap will result in bands where twice the dose will be applied. A tapered fan may suit this situation better. As a result of these varying needs, tolerances for spot spray boom height are even more strict than for broadcast spraying. More thoughts on spot spray nozzle selection are here.
Conclusions
Narrower nozzle spacings on a broadcast boom allow somewhat lower boom heights and these can in turn reduce drift and improve deposition of sprays. Lower flow nozzles will be needed with narrower spacings, requiring management of plugging and potentially a more drift-prone spray quality. The value of narrower spacings depends on the availability of booms that control sway, allowing them to operate at uniform, low heights.
Today’s sprayer has to excel at a lot of things. It has to have capacity and low weight. It has to go fast but be comfortable. It needs wide booms that stay level over complex terrain. It has to deliver the right spray volume at the right spray quality for the job. It has to be easy to fill and easy to clean. And of course, it has to be reliable, affordable, and come with dealer support.
We’ve definitely made progress in many of these areas. But the overall package still leaves lots of room for improvement and doesn’t address some issues that are of importance to applicators. Is it time for a reset?
Let’s say cost is no object. Here’s where I think the industry could go.
Focus on spray delivery
Spraying is done to protect crops. We need to do it without harming the environment while being economical with the inputs. These three tenets make up the Application Triangle, sometimes known as the 3 Es of spraying: Efficacy, Environment, Efficiency. The triangle represents the need for balance. A gain in one or two areas often requires a loss in another. That’s why there has never been a so-called “silver bullet” in spraying.
Priority 1: Only spray when and where required. Site specific treatments and IPM have been slow to make their way to the spraying world partly because of the low cost of inputs, but also because of difficulties defining and mapping areas that require different rates or products. The machine learning revolution is changing that. Green on Brown or Green on Green sensing can do more than save inputs. They can generate maps that document the change of weed patches over time, identifying priority areas and threshold densities and flagging problems early.
Priority 2: Integrate air assist. Air carries small droplets towards the target, protecting them from displacement by travel-induced or ambient winds. Once there, air can improve target interception and retention. It has to be done right, though, as improper adjustment can result in the opposite outcome. The reason it’s high on this list is because it improves efficacy and environmental protection at a modest cost.
Priority 3: Improve droplet size control. Nozzle design has improved, but the overall range of spray qualities that is achievable for any specific nozzle remains narrow. Sprays can be made finer or coarser with spray pressure, but this has implications for pattern uniformity. Twin Fluid nozzles currently offer the widest range of spray qualities, allowing one nozzle to do it all. We simply need greater droplet size flexibility on the spray boom.
Priority 4: Use nozzle-specific rate control. At minimum, a sprayer needs a system that allows for individual nozzle rate control within a wide window, say 4:1. This allows consistent dosing over a wide speed range, turn compensation, or local adjustments to dose for specific (sensed) canopy conditions. By layering direct injection at the nozzle on top of this, the sprayer can change rate and volume independently. Being able to spray the right amount in the right spray quality at the right volume, where needed completes the opportunity created by pest and canopy sensing.
Create better infrastructure
The backbone of the sprayer, the frame, drivetrain, boom, tank, pump, and plumbing, are responsible for carrying and delivering the spray liquid. Poor management of these variables results in an unproductive, heavy machine.
Priority 1: Prepare booms for future. A limiting factor in sprayer performance is boom width and stability. Consistent and low boom heights are the cornerstone of good application, ensuring uniform distribution, reducing drift potential, and improving targeting within the canopy. But perhaps as importantly, stable booms are essential for accurate optical spot spraying and any other sensing tasks that will rise in importance. Set a standard for sway, say target height plus or minus 10 cm along the width of the boom, 90% of the time. Do the same for yaw. Accommodate brackets for sensors and wiring harnesses when designing the boom fold.
Priority 2: Improve plumbing. Poorly executed sprayer plumbing causes waste and decontamination headaches. Although rubber hoses attached to plastic fittings provide a very versatile and generic building block, they generate and hide countless niches in which pesticide mixtures or active ingredient residue can accumulate. A simplified design that incorporates more engineered stainless steel tubing, smooth directional and dimensional transitions, interior surfaces that don’t accumulate residues and generate more efficient flows – all these would improve many aspects of the spray operation. It needs to be goal oriented – i.e., zero waste in priming and cleaning, guaranteed decontaminated after a rinse cycle. Draining on the ground should not be necessary.
Priority 3: Save weight. Weight causes compaction and eats fuel. Advanced materials or techniques can save weight while preserving strength. Savings can be applied to capacity. We need to explore advanced materials and trussed or exoskeletal designs (see “Aerodynamics”).
Priority 4: Consider aerodynamics in chassis and boom design. Wind blowing past a tractor, tank or boom, or counter-rotating air from wheels creates turbulence that displaces small droplets within it, reducing uniformity. Cleaner air makes it easier to use smaller droplets, easier to implement air assist or any other drift-reducing technology. This is no small task, as air can come from any direction. But as units become larger and travel faster, this effect can’t be ignored. Monocoque designs that use aerodynamic exteriors to carry machine weight may provide an answer.
Provide quality control
Spraying can be a guessing game, hence the terms “Spray and Pray”. We don’t know the outcome for days or weeks, depending on the mode of action, and by the time the result is known, it is too late to do anything if it’s unsatisfactory. But we can do better in assuring some sort of standard.
Priority 1: Confirm pressure, flow, and patterns at nozzles. The average sprayer has one flow- and one pressure-sensor. It can confirm the flow of the entire spray boom but cannot do that at the nozzle level. PWM has helped, by inferring flow from duty cycle. But actual liquid flow, and its pressure, remain unverified at the spray tip. A visual inspection of the pattern is necessary, and this is not only impractical but also wasteful and potentially hazardous.
Priority 2: Characterize canopy. If we knew the crop canopy was dense or sparse, we could adjust the water volume or rate of the product accordingly. LiDAR (Light Detection and Ranging) can characterize the physical structure of an object that would indicate density or porosity for which a dose (or droplet size, or air) adjustment may be necessary. This is not some future technology. The iPhone 12 Pro has it. Even RGB image processing could do something very similar.
Priority 3: Confirm coverage and drift. Say we’ve characterized the canopy and adjusted the atomization to suit. Is it having the intended impact? We will need a way to verify that the settings of the sprayer result in the required canopy penetration and coverage, even drift, on-the-go. We would need sprayer-mounted sensors that see spray deposits or an airborne spray cloud. The verification must be fast enough to make corrections during the spray operation. This kind of quality control provides the feedback loop to the first priority, spray delivery. It creates a perfect environment for machine learning and continuous improvement.
Priority 4: Improve user interface. The complexity of modern equipment monitors is great if you’re familiar with their features. But if you’re a new user or less comfortable with layers of screens and buttons and warning beepers, navigating the monitor can be a game stopper. Can we have beginner modes? Or a system where the monitor more actively engages with the user, asking questions or reminding a novice of key settings? The friendliness of the interface is a sleeper issue, it seems less important at first look but can over-ride many equipment features because of the power of a positive user experience.
I challenge sprayer manufacturers to conceptualize and show us the ideal sprayer they’re working towards. The perfect unit may never reach us, as this proposal is rife with technological and cost barriers. But it is nonetheless important to identify priorities and identify possible ways to meet them. As we creep towards the solution with incremental improvements, recall that its not the size of the step that matters, it’s the direction.