Introduction
I’ve studied spray applications in a diversity of crops, both broad acre and specialty, but perhaps nothing is as challenging large tree nut canopies. Australia’s macadamia orchards can form >10 metre high, >4 metre deep canopy walls! So in writing this article I face the opposite situation I normally encounter when advising on airblast sprayer settings.
In my region, fruit orchard, cane, bush and vine crops are typically sprayed with airblast sprayers. Over the years, through breeding and crop management, these operations have densified. The idea is that smaller, uniform crops can be managed, protected and harvested more efficiently. The ratio of quality fruit to planted area goes up, and input costs go down.
However, our aging fleet of sprayers are overpowered relative to the target. This means much of what I do involves demonstrating to sprayer operators what sufficient coverage looks like, and then teaching how to restrain sprayer parameters to achieve this ideal coverage as efficiently as possible.
So, are there any commonalities?
Yes! The need to understand what “good coverage” looks like, and the parameters that affect it, is universal to any airblast operation. Assuming the operator already has product choice and pest staging well in hand, there are three major factors that influence the quality of the spray application: The sprayer settings, the geometry of the target and the environmental conditions.
In theory we can discuss each of these factors individually, but in practice they interact with one another. It is wrong to adjust one factor without considering the other two. This is also why you should be wary of anyone that tries to sell you a sprayer by demonstrating it in an empty lot on a calm day! Always calibrate a sprayer in the planting, in weather conditions you would normally spray in.
Air volume and direction
Air adjustments are perhaps the most impactful changes you can make to your operation. The air stream created by the sprayer not only conveys the spray solution to the target, but opens the canopy and exposes leaf surfaces to the spray. In order to achieve adequate coverage, the volume (and speed) of sprayer-generated air must be sufficient to span the distance from sprayer to target, and then displace the volume of air in the canopy while depositing the spray.
I admit to a bias when it comes to air shear systems. These sprayers utilize sprayer-generated air to atomize the spray liquid as well as convey it. As such, you cannot easily adjust the air without affecting spray quality (aka average droplet size or VMD). My preference is an arrangement where nozzle selection allows you to control spray quality independent of air settings. In any case, adjusting air settings requires the operator to “see” air.
In my region, I advise tying 25 cm lengths of flagging tape at the top, middle and bottom of the far side of the upwind tree. Then, drive past with the air on and the spray booms off. If the ribbons stand straight out, the sprayer is over-blowing and the operator can drop to a lower fan gear, reduce the tractor RPM’s (if using a positive displacement-style pump) or drive faster. If the ribbons don’t move, the opposite steps can be taken. If the ribbons still won’t move, the sprayer is under-powered, it’s too windy to spray, or the canopy is too large.
Learn more about these topics here.
Let’s explore that last point. In the case of a canopy as large as macadamia, it is unlikely a low-profile axial sprayer can produce sufficient air volume to displace all the air in the canopy – particularly at the top of the tree. In this case a more humble goal would be to move the leaves at the trunk, indicating that the sprayer is managing to drive the air to the centre. To monitor this, an observer wearing safety goggles would have to stand at the far side of the upwind trunk and (while being very careful of flying debris) watch for leaf movement.
This becomes increasingly difficult to monitor as the target gets fuller, higher, and farther away from the sprayer. Consider the macadamia trees in the following figure:
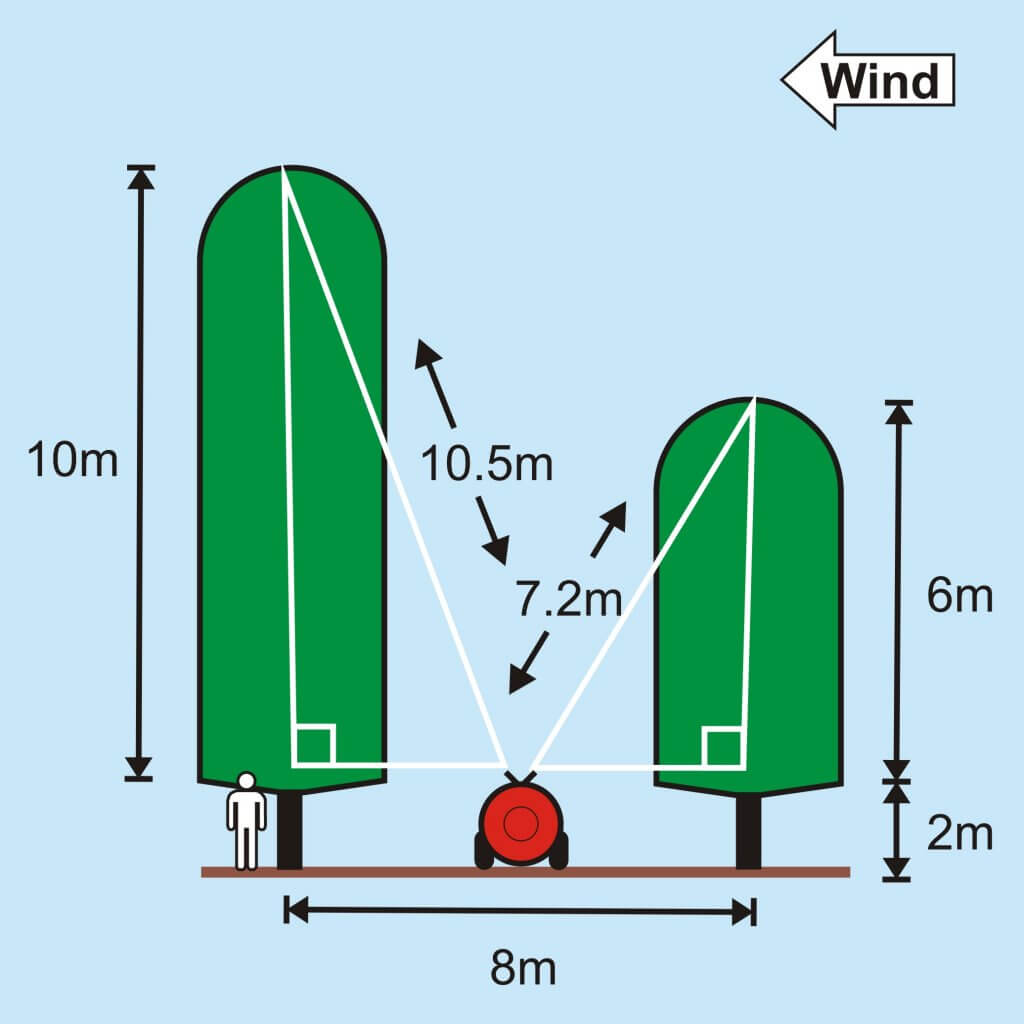
The observer will have difficulty seeing leaf movement at the top of either the taller or shorter tree, but we can safely assume there will be less movement as a function of height. Since our goal is uniform penetration throughout the canopy, we must somehow compensate for this differential. Consider the following figure which extrapolates the path between the sprayer air outlet and the tree:
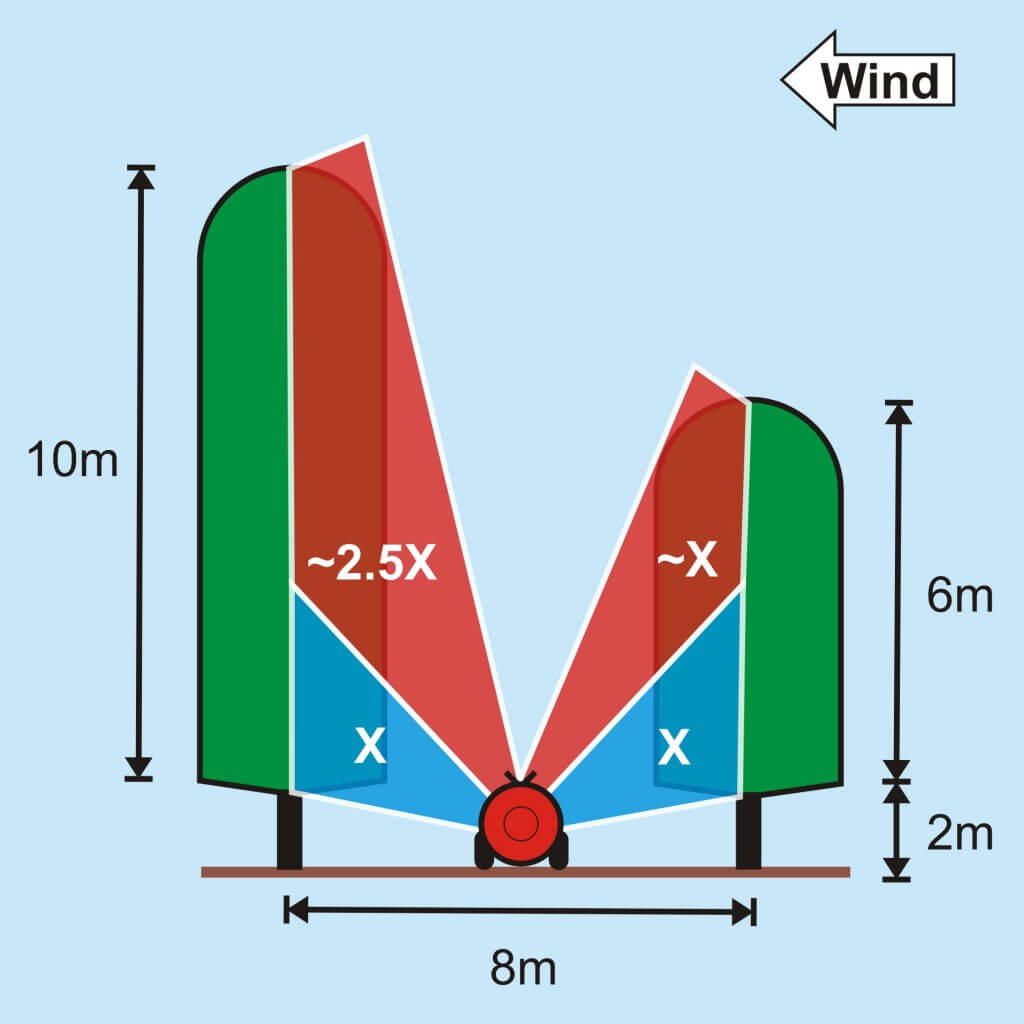
In this figure we have divided each side of a low-profile axial sprayer into halves. The bottom half of the air outlet must produce enough air volume to displace area X. I realize I’m mixing area and volume, but bear with me. For the taller tree, the upper half of the outlet must produce enough air to displace 2.5 times the area versus the bottom half. Given that it is a single air outlet, this means inconsistent coverage.
Comparatively, the shorter tree requires a more uniform air distribution. While this improves matters, there are further challenges. Sprayer-generated air slows and disperses proportional to distance, requiring more air to compensate. Also, orchard wind speed increases with elevation, increasing the potential for interference and dispersion. So, the taller the tree, the harder it is to achieve uniform canopy penetration.
Spraying shorter nut trees with a low-profile axial sprayer is possible. The sprayer would require a large fan (≥1 m diameter), an aggressive fan blade pitch and a high fan speed. Air deflectors and air separation vanes would also be needed to segregate and focus the air. And travel speed would play a significant role.
Travel Speed
Travel speed should be considered as function of air penetration. A slower travel speed (~2 km/h) facilitates the displacement of stagnant canopy air with sprayer-generated air. Further, a slower travel speed reduces the wake effect that can suck finer droplets from the swath.
It may seem counter-intuitive, but slower speeds can result in greater productivity. There is no need to increase the volume sprayed per hectare, so additional refills are not an issue. Further, improving spray coverage at slower speeds may prevent the need for an additional “clean-up” application later on, saving time and reducing environmental impact. Time lost to slower travel speed can also be reclaimed with more efficient loading practices.
Learn more about travel speed here and productivity here.
Directed Sprays and Off-Target Deposition
When the height of the target tree exceeds alley width, or when branches overgrow alleys, many low-profile axial sprayers suffer from line-of-sight issues. Lower branches/leaves block the upper canopy and too many nozzles target the lower canopy. See the figure below.
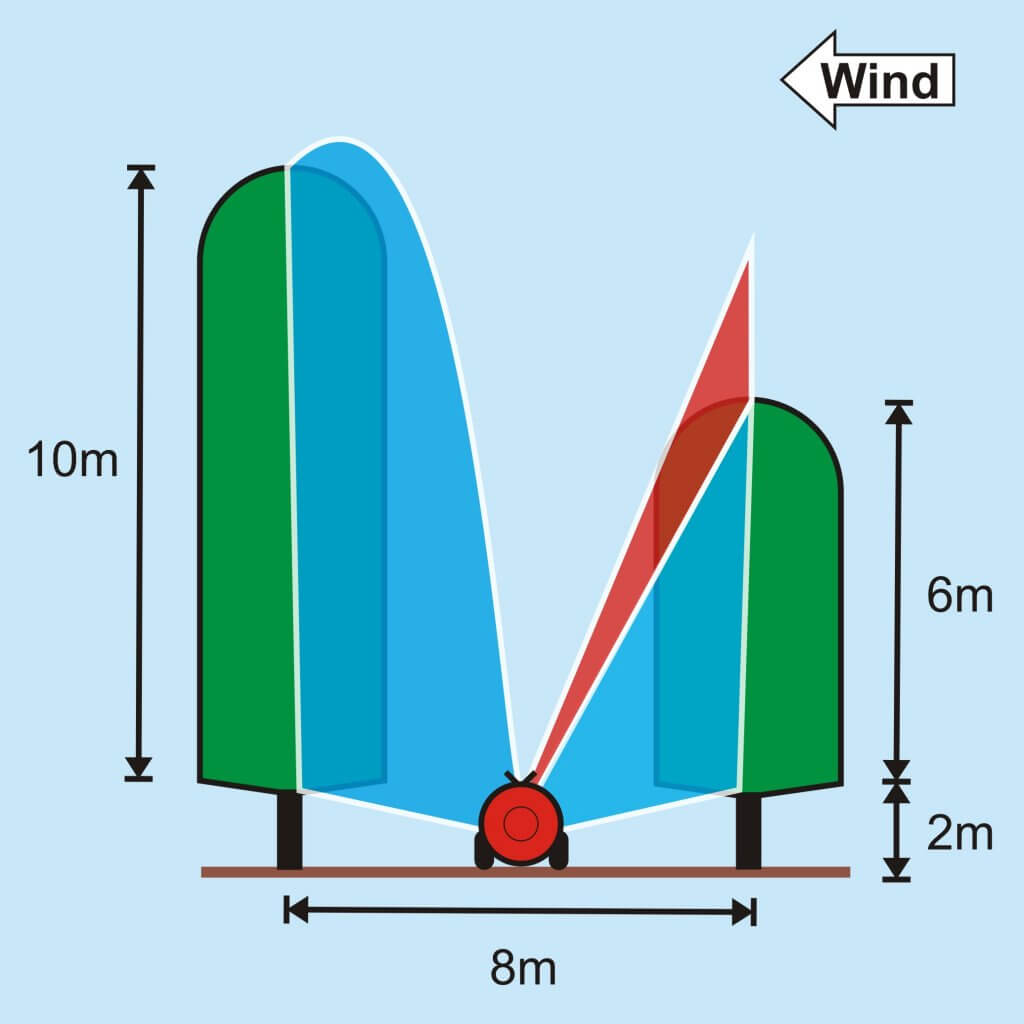
One option is to direct spray vertically to ensure the swath reaches the top of the canopy. In this case it is hoped that droplets remain Coarse enough to fall from the swath and penetrate the canopy, or blow laterally with prevailing wind (left side of figure). This unadvisable strategy is unlikely to achieve consistent results and greatly increases the potential for drift.
Alternately, the top of the swath can be vectored directly at the top of the tree, but it must pass through canopy to reach it (right side of figure). This strategy increases the potential for drift, risks missing a portion of the upper canopy and is also unlikely to yield consistent results.
Ideally, we would use a sprayer design that brings the air (and nozzles) closer to the target. Hypothetically, there are several possible configurations, but in practice their success will be hampered by boom sway and roll (from sloped plantings or uneven alleys) and pressure drop restrictions (from boom height). Here are a few possibilities:
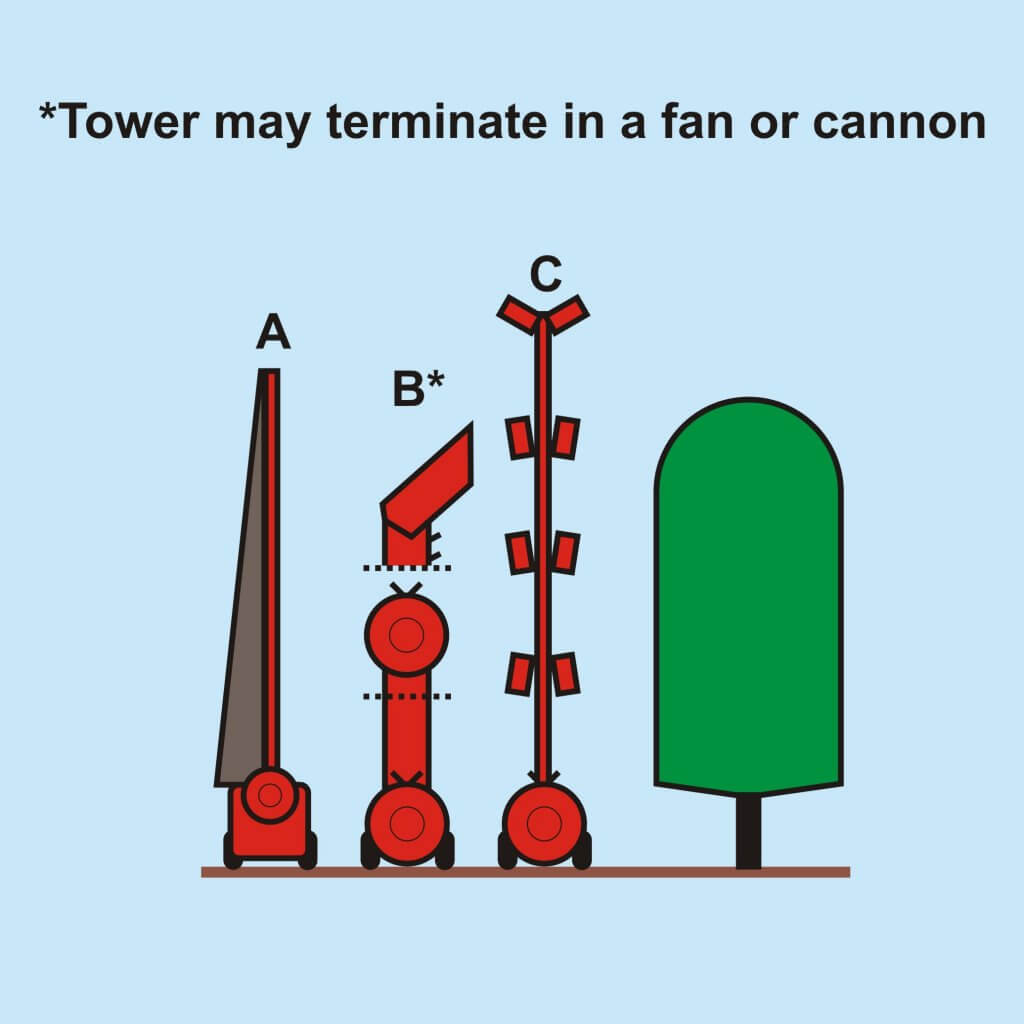
A. A vertical boom with a tapered inflatable bag to convey and redirect the air laterally (typically one-sided).
B. An axial sprayer topped with a ducted tower with vertical booms, terminating in either a second axial fan or one-sided cannon.
C. An axial sprayer with a vertical mast with a series of Sardi-style nozzle/fan assemblies distributed along the height.
Learn more about towers here.
In the following figure we see how two possible arrangements might work. On the left is a vertical boom with a tapered air assist system. This provides the shortest distance-to-target for each nozzle and in moving laterally, the air will more easily penetrate horizontal limbs. It also reduces the potential for drift.
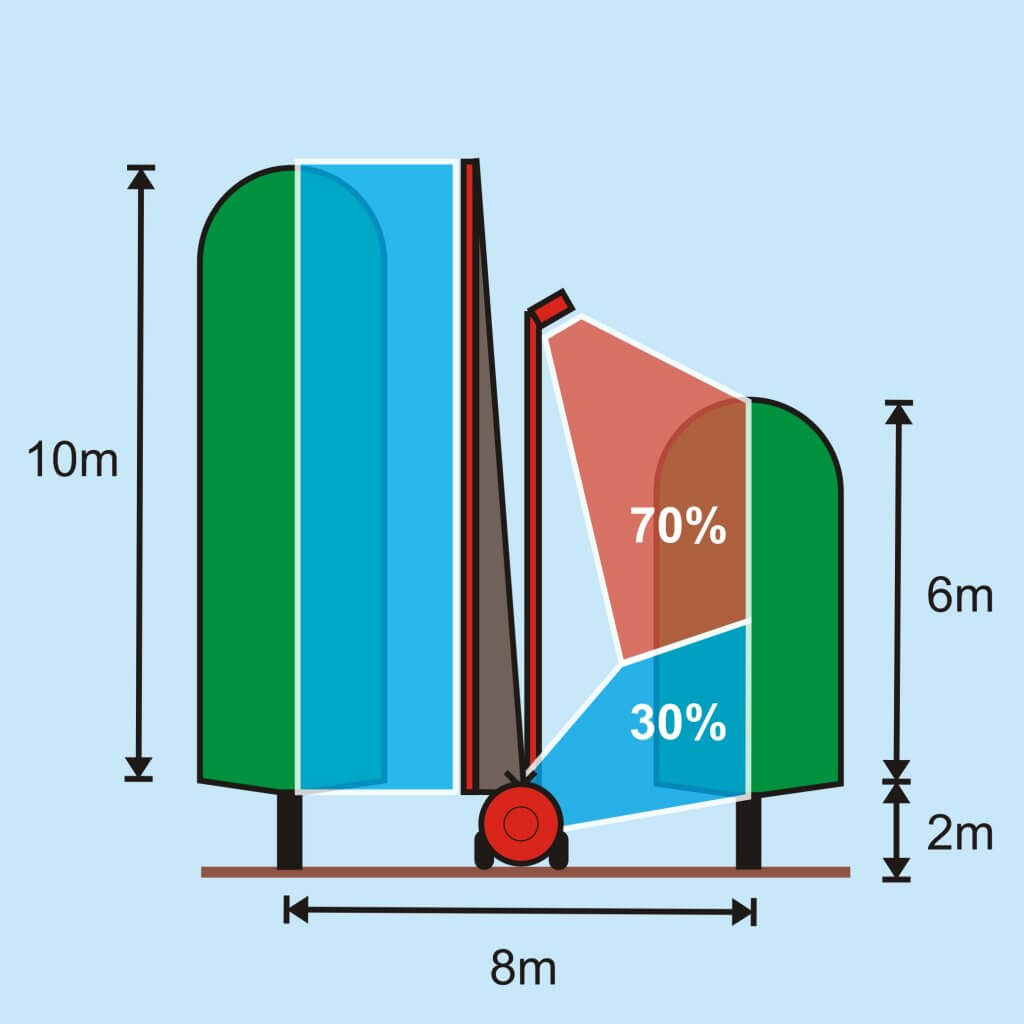
On the right is a novel arrangement proposed by Dr. Ken Giles (UC Davis, California). A Sardi-style fan and nozzle assembly is elevated above the canopy from an axial sprayer. His intention was to create air and fluid interaction to generate turbulence that could improve uniformity and decrease drift. He proportioned 70% of the overall spray to the top fan, and the remaining 30% from the ground. Working in almond, he saw more even coverage distribution compared to a low-profile axial sprayer and noted it reduced off target drift. For a target as tall as macadamia, additional fans would likely be required.
In Part 2 we discuss Droplet size, Boom distribution, Spray coverage and diagnostics, California research and Canopy management.