Category: Speciality Sprayers

Main category for all sprayers that are not horizontal booms

  • Spraying Sweet Corn

    Spraying Sweet Corn

    This article was written with information from George Hamilton, Field Extension Specialist with New Hampshire Cooperative Extension (retired), and from Dr. Ben Werling, West Michigan Vegetable Educator with Michigan State University Extension.

    Commercial sweet corn growers must use spray application equipment capable of depositing spray material at the ear zone. These producers often hail from small, diversified vegetable and fruit farms that sell direct to the customer. For example, in 2013 New Hampshire’s Hillsborough County had about 500 acres planted to sweet corn. The seven farms ranged from 35 to 80 acres, and five of those farms also had orchards. Only one farm used an over the row (high clearance) sprayer, while the rest managed equipment costs by using their orchard airblast sprayers. While uncommon in Ontario, airblast application continues to be a very common practice in the US.

    High clearance in corn. Photo: FS Partners’ Juli Paladino

    So, if high clearance or aerial application isn’t an option, what are the limitations of using a directed application from an airblast sprayer? George wanted to find out, so he used water sensitive paper to compare coverage when spraying mature sweet corn plants.

    Water sensitive paper clipped to corn silks.

    He first sprayed an 18 row, and then a 16 row block using a Jacto cannon sprayer.

    Jacto cannon sprayer in action.

    The following photo shows (qualitatively) the resultant coverage. The top row shows the coverage when the sprayer drives both sides of the 18 row block. The bottom row shows the coverage from driving on only one side of an 18 row block. Three observations:

    1. Coverage is excessive adjacent to the cannon (row 1 or 18), improves further along the swath (rows 2-4 or 15-17), and then becomes erratic or non-existent with distance (see block sprayed from one side).
    2. Spraying from both sides improves coverage in the middle 10 rows.
    3. Spraying from one side does not provide sufficient coverage beyond row 7 or 8.
    Results from Jacto spray passes in 18 row block. Top: Driving both sides. Bottom: Driving only one side.

    They then used the cannon on both sides of a 16 row block to see if a shorter swath would improve coverage in the centre rows. It is a little difficult to discern from the photo, but the beyond the four outer rows, the centre rows have far better coverage.

    Jacto Cannon Sprayer spraying from both sides of a 16 row block.

    Finally, they used a more conventional axial Durand-Wayland airblast sprayer to spray a 12 row block from one side, and then from two.

    Durand-Wayland airblast sprayer in action.

    Once again, a shorter swath distance improves coverage in the middle rows, and spraying from one side results in poor coverage uniformity.

    Results from DW spray passes in 12 row block. Top: one side only. Bottom: Both sides.
    Close-up of DW performance spraying from both sides in 12 row block.

    In 2018, Ben also tried tackling the airblast / sweet corn combo. He and a grower used an AgTec cannon to spray from one side into a block of 5.5′ high corn on 30″ centres. They were travelling about 4 mph and spraying 50 gpa. Water-sensitive papers were placed at the top (N) middle (MID) and bottom (S) of the ear zone on rows 1,3,5,9,11, 15 and 20 rows to the west of the sprayer’s path. He used the Snapcard app to determine cover (see table).

    Rows from sprayerCoverage (Mean %)
    112
    319
    514
    77
    116
    153
    203

    Further observations:

    1. Coverage appears to be reasonable up to about row 5.
    2. The top card in row 9 caught spray falling into the crop (aka the up-and-over technique) but it didn’t penetrate any lower.
    3. Spraying from one side also showed how a stray leaf in the way of the card makes a big difference (see card at the top of row 7).

    Watch the video of Ben and the grower spraying water:

    So what’s happening?

    In both George’s and Ben’s trials, we see that spray droplets lose forward momentum as a function of distance from the nozzle. Fine droplets, typical of airblast sprayers, require air to carry them to the target. When the air produced by the sprayer slows, they begin dissipate and move erratically. Now, consider that the corn canopy itself is acting like a filter, scrubbing the spray from the swath as a function of distance. This is further exacerbated by environmental conditions such as wind, humidity and thermals.

    What’s the solution?

    In Ontario, we’ve tried directing cannons both laterally and downward (the up-and-over technique) in highbush blueberry, grape and cedar nurseries. We’ve tried increasing air speed, slowing sprayer travel speed and increasing spray volume. In each case we incur excessive coverage near the sprayer, extend the reasonable coverage zone a bit, and have only a modest improvement as the spray inevitably slows and is filtered.

    So, we feel the best approach for spraying sweet corn with an airblast sprayer is as follows:

    • Spray from both sides (even if you must cut an alley to accommodate the sprayer). This also helps with access for harvest.
    • For two or three head cannons, blocks between alleys should not exceed 16 rows to allow sufficient spray coverage of the ear zone. The sprayer head must be pointed downwards.
    • For axial airblast, or if spraying tall varieties with a cannon, consider 12 row blocks.
    • Any style of air-blast sprayer requires 75 gpa (or more) for sufficient coverage, and both travel speed and air settings should ensure air movement reaches the middle of the block.
  • What is Delta T and why is it important for spraying?

    What is Delta T and why is it important for spraying?

    Click here to listen to Audio Article

    Humidity is important in spraying. With the average tank of pesticide being 90 to 99.5% water, evaporation plays an important role in both droplet size and active ingredient concentration. Low humidity causes droplets to evaporate faster, potentially increasing drift and reducing uptake. But relative humidity (RH) isn’t the best way to measure this effect because the same RH at two different temperatures results in two different water evaporation rates.

    Instead, we present Delta T, also known as “wet bulb depression”. Delta T is an atmospheric moisture parameter whose use in spraying has made its way to North America from Australian operations. It is defined as the dry bulb temperature minus the wet bulb temperature, and provides a better indication of water evaporation rate than RH. Higher Delta T means faster water evaporation.

    The recommendations from Australia are to avoid spraying when the Delta T is either too high or too low, with a range of two to eight being described as ideal.

    Figure 1: Delta T chart used in Australia (Source: Australian Gov’t Dept of Meteorology)

    Delta T is being reported on an increasing number of weather stations, and it’s time we took a closer look at what it means.

    Measuring Relative Humidity

    In the early days of weather reporting, relative humidity was calculated from psychrometric charts. All one needed was a hygrometer, usually a sling psychrometer. A sling psychrometer is two identical thermometers side by side whose bulbs could be slung in a circle, exposing them to moving air. One bulb was covered in a cotton wick moistened with distilled water, the other was left exposed and dry.

    Figure 2: Sling psychrometer (Source: ScienceStruck.com)

    As the bulbs met moving air, water evaporated from the cotton wick and that reduced the temperature of that thermometer. The dryer the air, the greater the evaporation rate and therefore the greater the temperature drop. The dry thermometer was unaffected by this movement.

    On measuring the wet and dry bulb temperature, one consulted a psychrometric chart. This chart converted the two temperatures to total water content in the air, compared it to total water-holding capacity, and expressed it as Relative Humidity. Psychrometric charts are useful for many other air parameters such as dew point, vapour pressure, or enthalpy. (Pause briefly to give thanks that we don’t need to know what enthalpy is.)

    Figure 3: Psychrometric Chart (Source: Carrier Corporation)

    Turns out that RH is a poor measure of water evaporation rate. An RH of 24% at 20 C has exactly the same evaporation rate as an RH of 44% at 35 C. That’s why Delta T is the preferred measurement: it’s linearly related to evaporation.

    Note: Modern electronic weather stations don’t need two thermometers to measure air moisture content, and use polymers whose capacitance or resistance changes with atmospheric moisture. Add an internal look-up table, and we have all the information we need.

    Pros and Cons of Water Evaporation

    It’s important to note that our Australian colleagues caution against spraying when water evaporation rate is both too high and too low.

    Too High:

    • Water evaporates rapidly, reducing droplet size and pre-disposing the smaller droplets to drift;
    • Deposited droplets dry quickly, reducing pesticide uptake which is more effective from a wet deposit.

    Too Low:

    • Water doesn’t evaporate, maintaining the smaller droplets in a liquid state. These small droplets are already drift prone, but are now more potent because of more effective uptake. Overnight conditions that are inverted are usually humid, adding to harm potential from the inversion.

    Delta T in North America

    The addition of this parameter to our spraying weather lexicon has been useful. But it’s important to understand the context in which it was developed to properly judge its suitability.

    Aussies started talking about Delta T because the use of finer sprays under the hot dry conditions found during their summer sprays resulted in significant evaporative losses, significantly greater drift potential, and potential reduction of product performance. The guidelines to avoid spraying when Delta T exceeds eight or ten originate there.

    A few changes have happened since these guidelines were developed. Over the past ten to 20 years, we’ve observed greater use of low-drift sprays, with the coarser sprays’ larger droplets resisting fast evaporation. In the past five to ten years, water volumes have increased due to our heavier reliance on fungicides, desiccants, and contact modes of action. Both of these developments have helped reduce the impact of a dry atmosphere. We simply can’t say if a Delta T of 10 is too high with these new application methods.

    Looking at it another way, if Delta T values are very high, increasing water volume and droplet size will mitigate that to some degree, as the Aussies state in their extension materials (linked earlier).

    Formulation

    Pesticide formulation can also play a role in evaporation. Once the water is gone, oily formulations may still have good uptake because the oily active ingredient stays dissolved in the oily solvents. This is both good and bad, helping on-target efficacy but also increasing the risk of more potent drift. Solutions, on the other hand, are more likely to leave their actives stranded on leaves as crystals once the water is gone.

    Bottom Line

    Delta T is definitely useful information when spraying. It will typically rise and fall with air temperature as the day proceeds, and it is wise to consider suspending operations when values are critical. Take note of the Delta T when spraying the same product throughout these hot days and learn from the experience. Remember, the atmosphere affects not just sprays but also plants and insects, and due to this complexity we may not be able to attribute success or failure to just one measurement.

  • Biobeds for Pesticide Waste Disposal

    Biobeds for Pesticide Waste Disposal

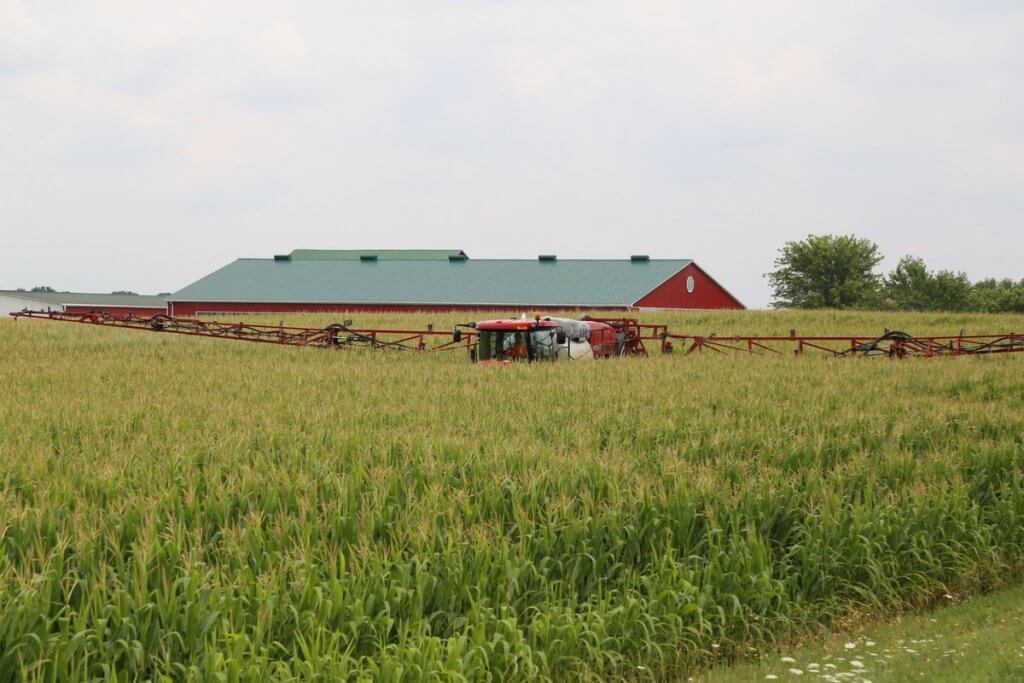
    One of the most challenging aspects of a spray operation is the disposal of leftovers or rinsate containing pesticides. Let’s be honest, too much of it is drained onto the ground in a corner of the yard or the field. Nobody’s happy about that, nobody’s proud of it, but what are the alternatives?

    Waste disposal is a skeleton in the closet of the pesticide industry. One of the problems is the time-consuming nature of sprayer cleaning, and the lack of clear guidelines on product labels that pass the buck.  Too often, the applicator is asked to “act in accordance with provincial or state guidelines”, which is essentially a dead end.

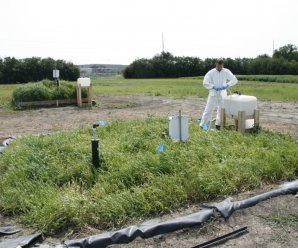
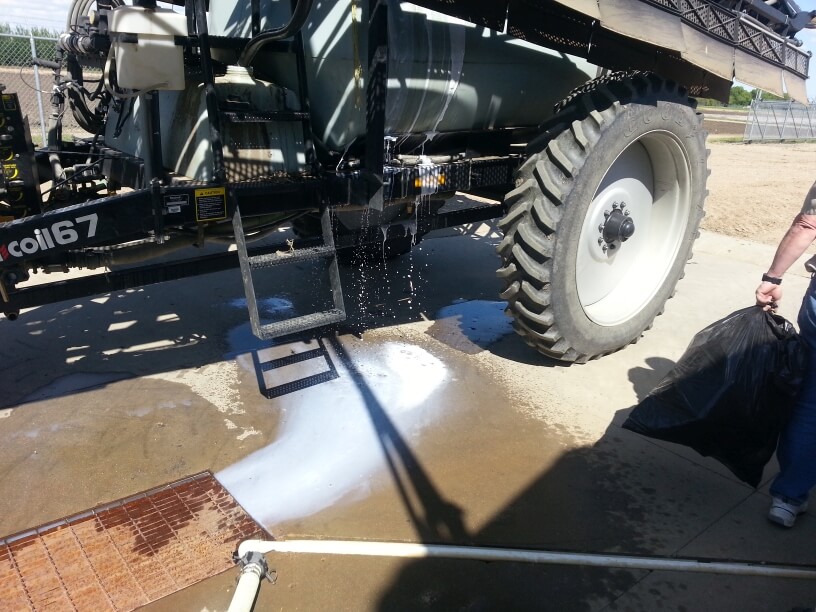
    Figure 1: Sprayer fill station

    At Sprayers101.com, we’ve tried to tackle the problem by finding ways to generate less waste (Express End Caps, Accu-Volume), by disposing of the rinsate by spraying it out, or by installing an efficient continuous rinsing system. We’d now like to talk about another component, biobeds.

    What is a biobed?

    Simply put, a biobed is a place where it’s safe and acceptable to dump dilute pesticide waste. First implemented in Sweden about 20 years ago, a biobed typically consists of a 1-m deep pit measuring about 3 m x 6 m or so. The pit is filled with a biomix, a mixture of cereal straw, compost or peat, and soil. The biomix, when properly prepared, acts to absorb a large amount of moisture, adsorb the pesticide molecules, and provide an environment in which microbes break down the residues.

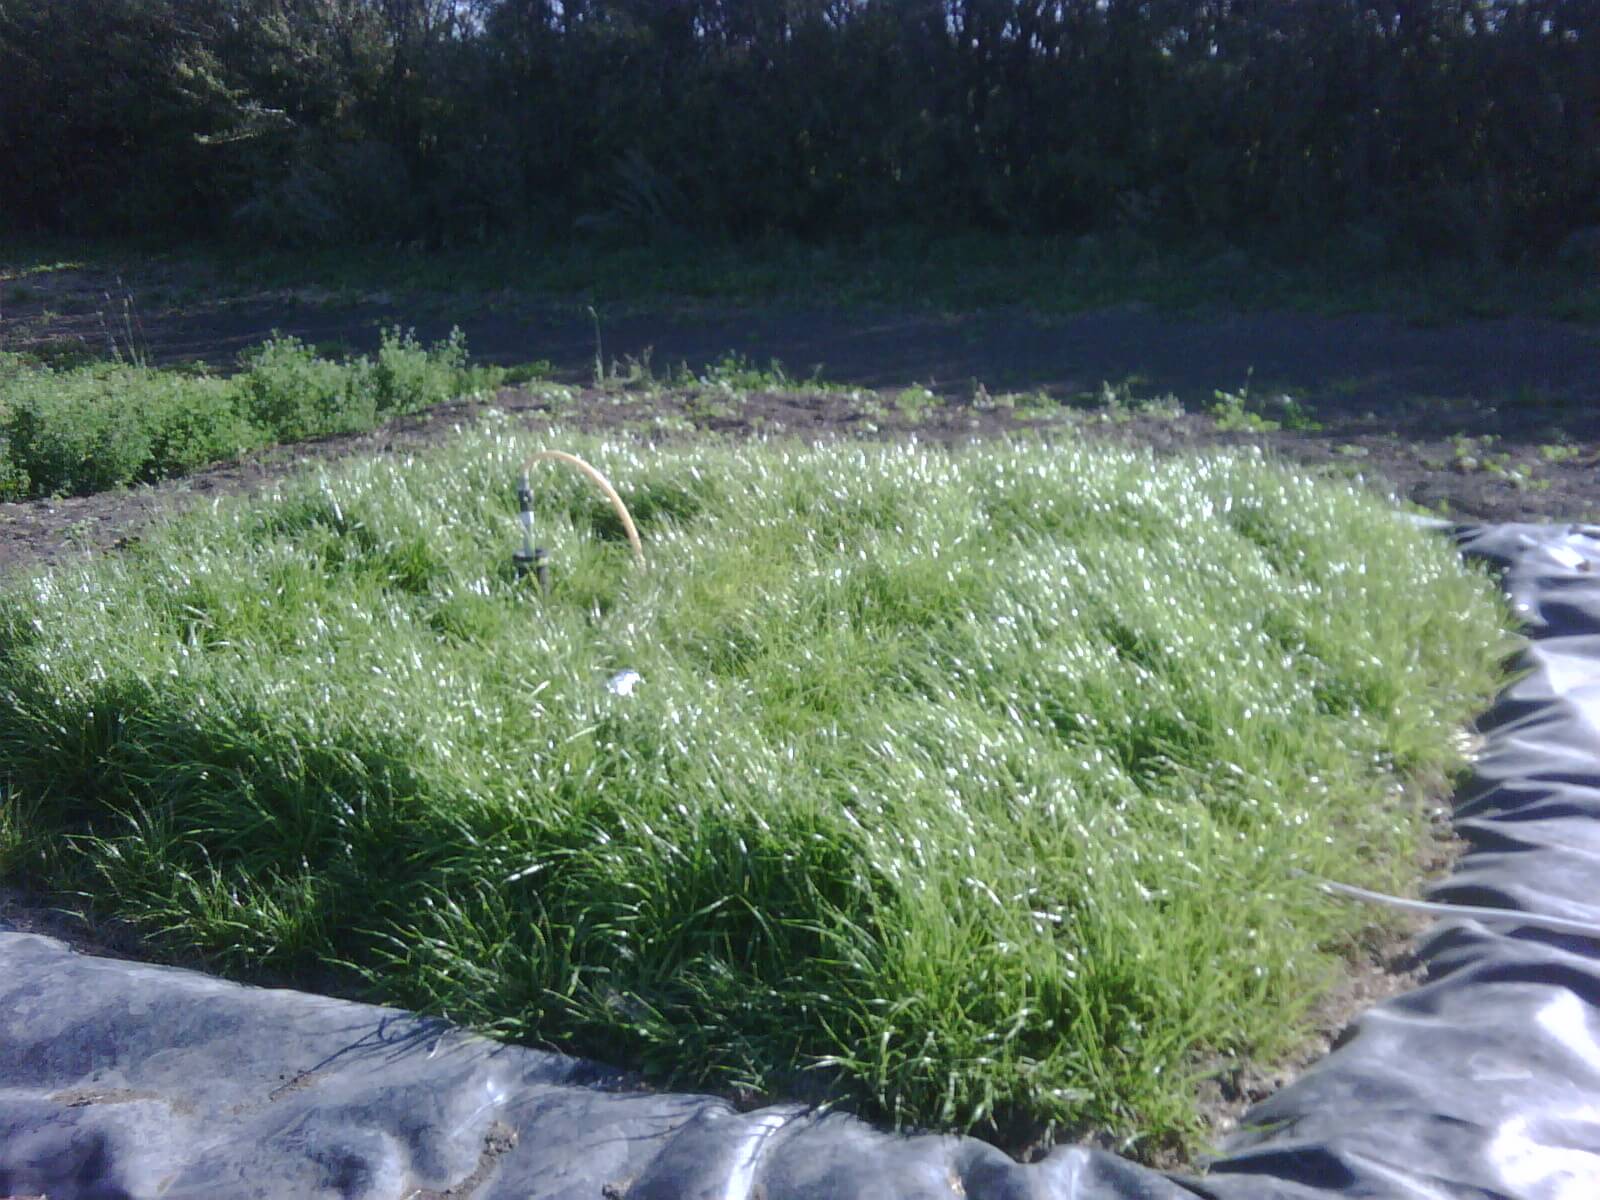
    Figure 2: Canada’s first commercial biobed installation at Indian Head, SK, 2009 (Source: Murray Belyk, Bayer CropScience (retired)).

    The effluent from a properly constructed biobed system contains 90 to 99% less pesticide than what was introduced, depending on the pesticide.

    Biobeds have been extensively studied and are now found throughout Europe and many parts of Central and South America. Canada currently has 6 research biobed sites in the West, and a further 17 in Quebec. The systems have been researched by Agriculture & Agri-Food Canada (AAFC) in recent years, with promising results.

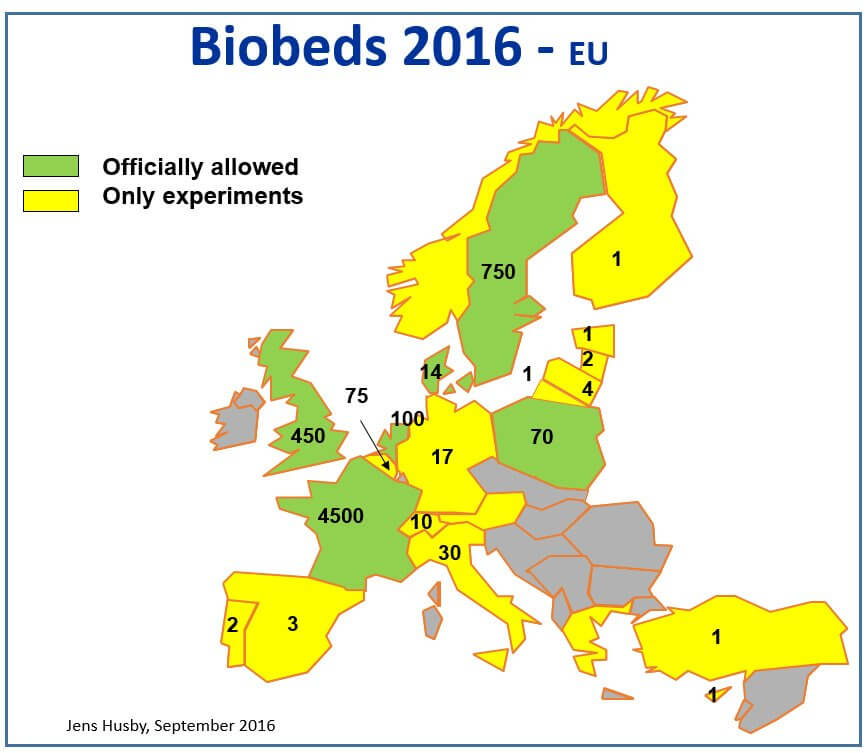
    Figure 3: European biobed installations, 2016 (Source: Jens Husby, Biobeds.org).

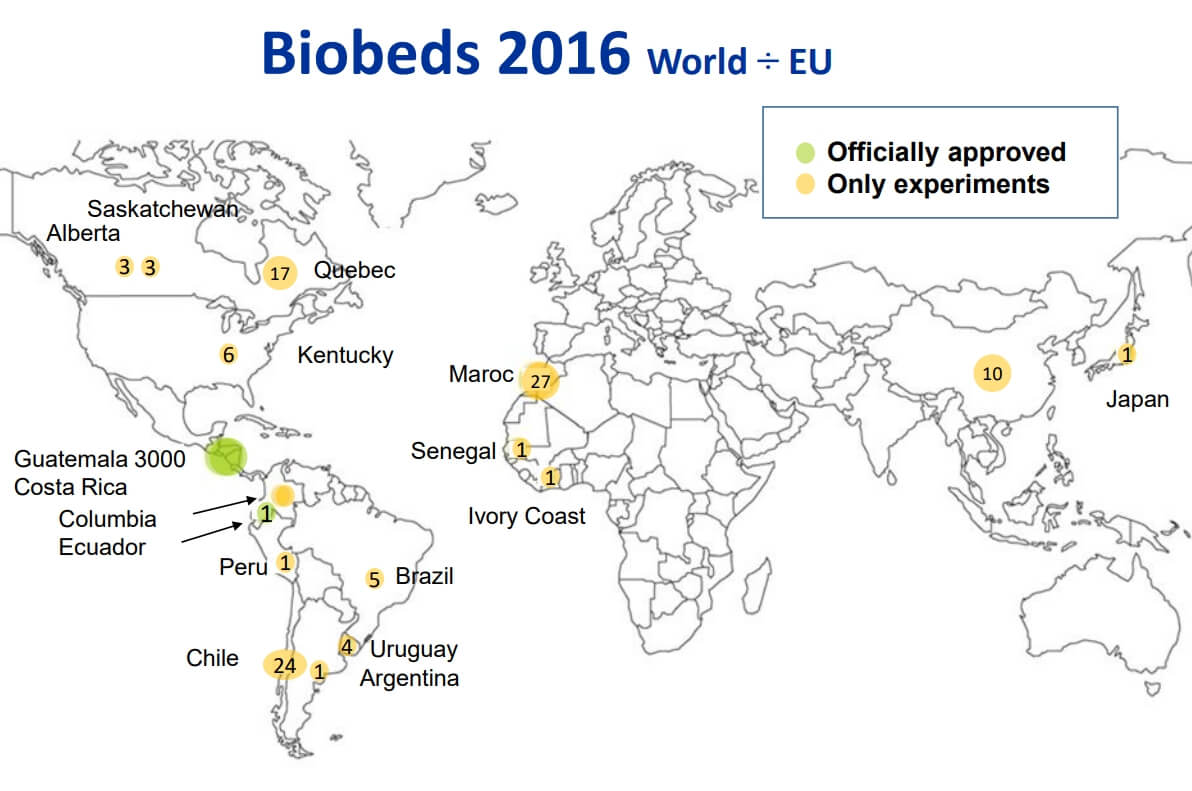
    Figure 4: Global biobed installations, 2016 (Source: Jens Husby, Biobeds.org).

    Constructing a biobed

    There are many possible variations of biobeds, some relatively simple and others engineered to address certain specific needs. A great deal of creativity can be used to customize a biobed for any operation.

    A simple biobed

    The following is a variation of the simplest biobeds, and these are the types first tested by AAFC in Saskatoon and Indian Head, Saskatchewan about 10 years ago. This design is based on the biobeds established in Sweden and the UK, and is a good way to learn about the system.

    Note that this biobed has an impermeable liner, so it’s a closed system. Excess water that leaches to the bottom must be removed and cycled back to the top of the biobed.

    • Create the biomix by blending two parts, by volume, chopped cereal straw or wood chips (not cedar), one part mature plant-sourced compost or peat and one part relatively coarse-textured soil (for optimal drainage). Add water as necessary as if making compost. Allow to sit for four to six weeks.

    Figure 5: Biomix preparation.

    • During this waiting time, the biomix will warm and form a white-mold complex. This is the microbial basis for its ability to break down pesticide residues. White mold will be visible on the cellulose portions of the biomix.

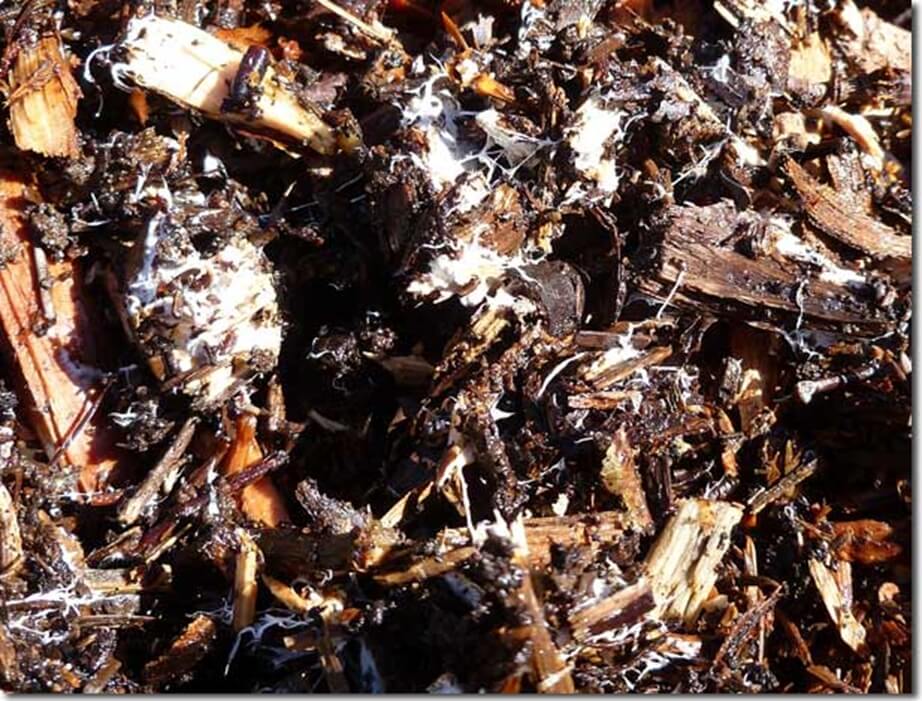
    Figure 6: white mold (Source: AAFC).

    • Identify a well-drained site easily accessible by spray equipment. Avoid low spots as water management becomes problematic.

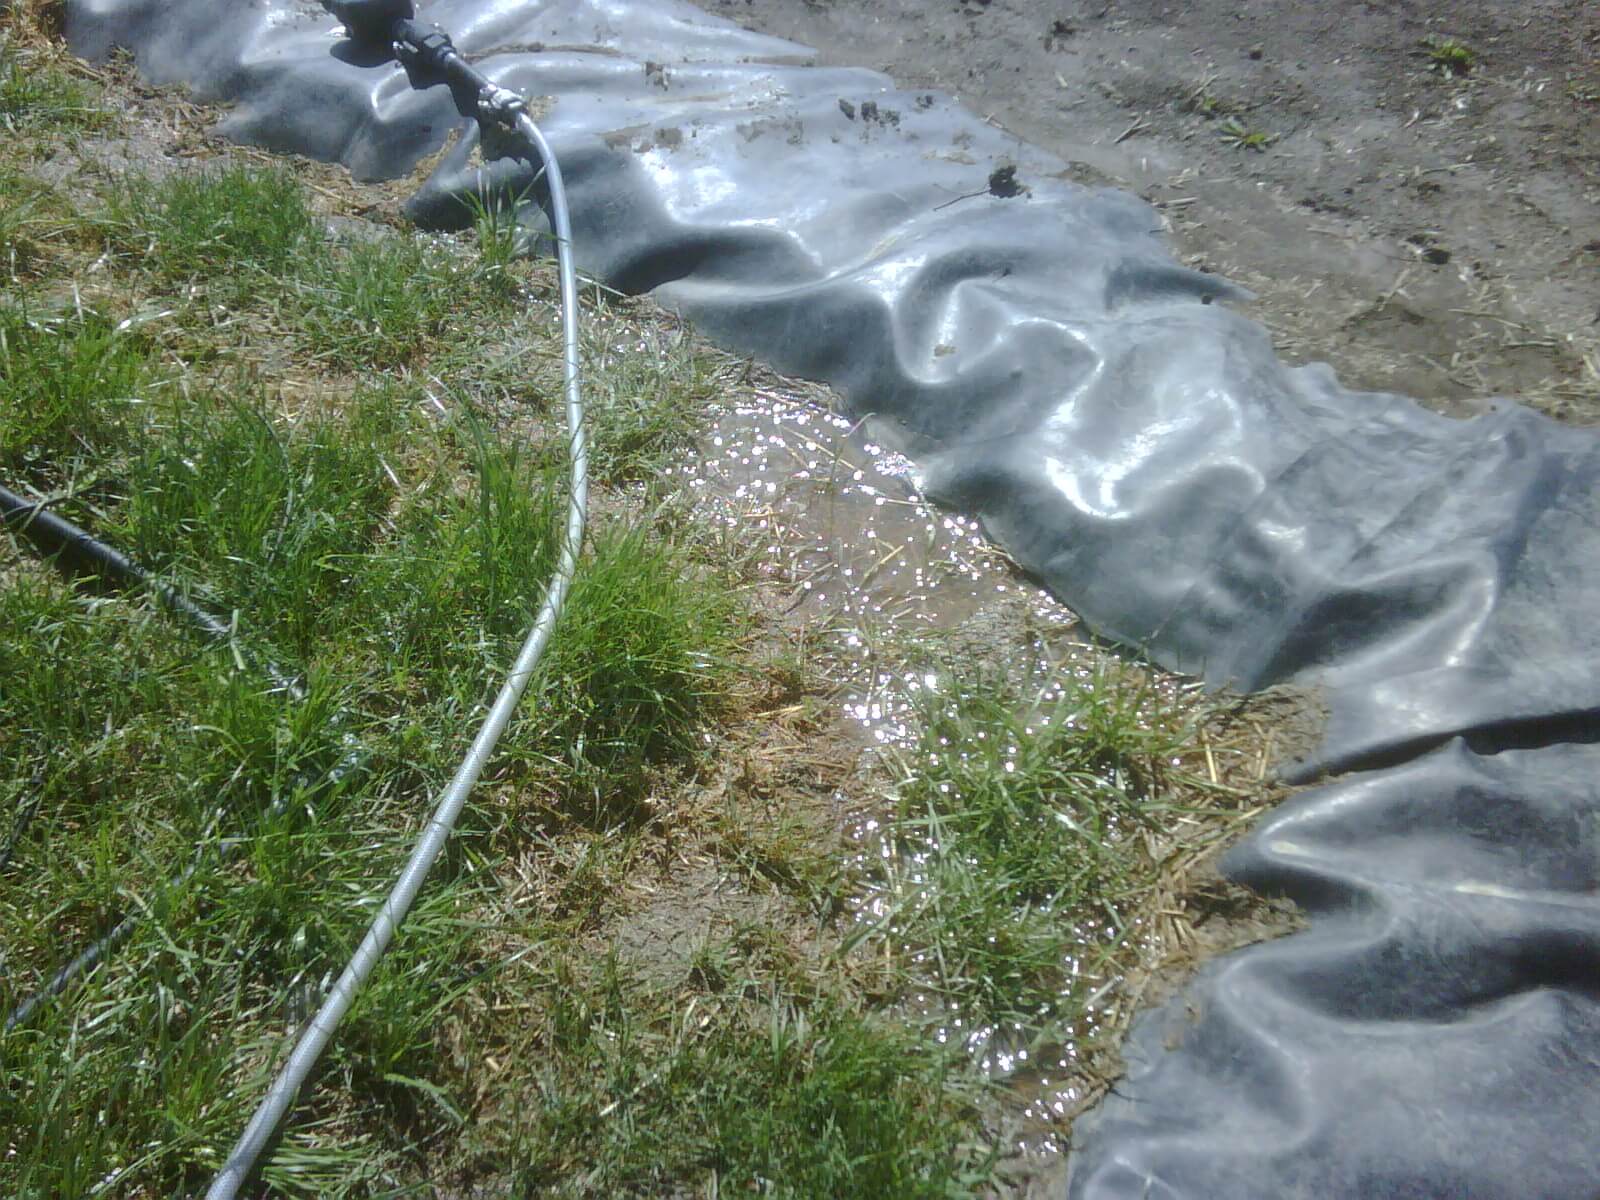
    Figure 7: Site selection and/or biobed covering are essential to avoid waterlogging (Source: Murray Belyk, Bayer CropScience (retired)).

    • Dig a pit sized to suit your requirements. As a rule of thumb, 1 m3 can process about 1000 L of liquid in a season. Rainfall is included in this amount.

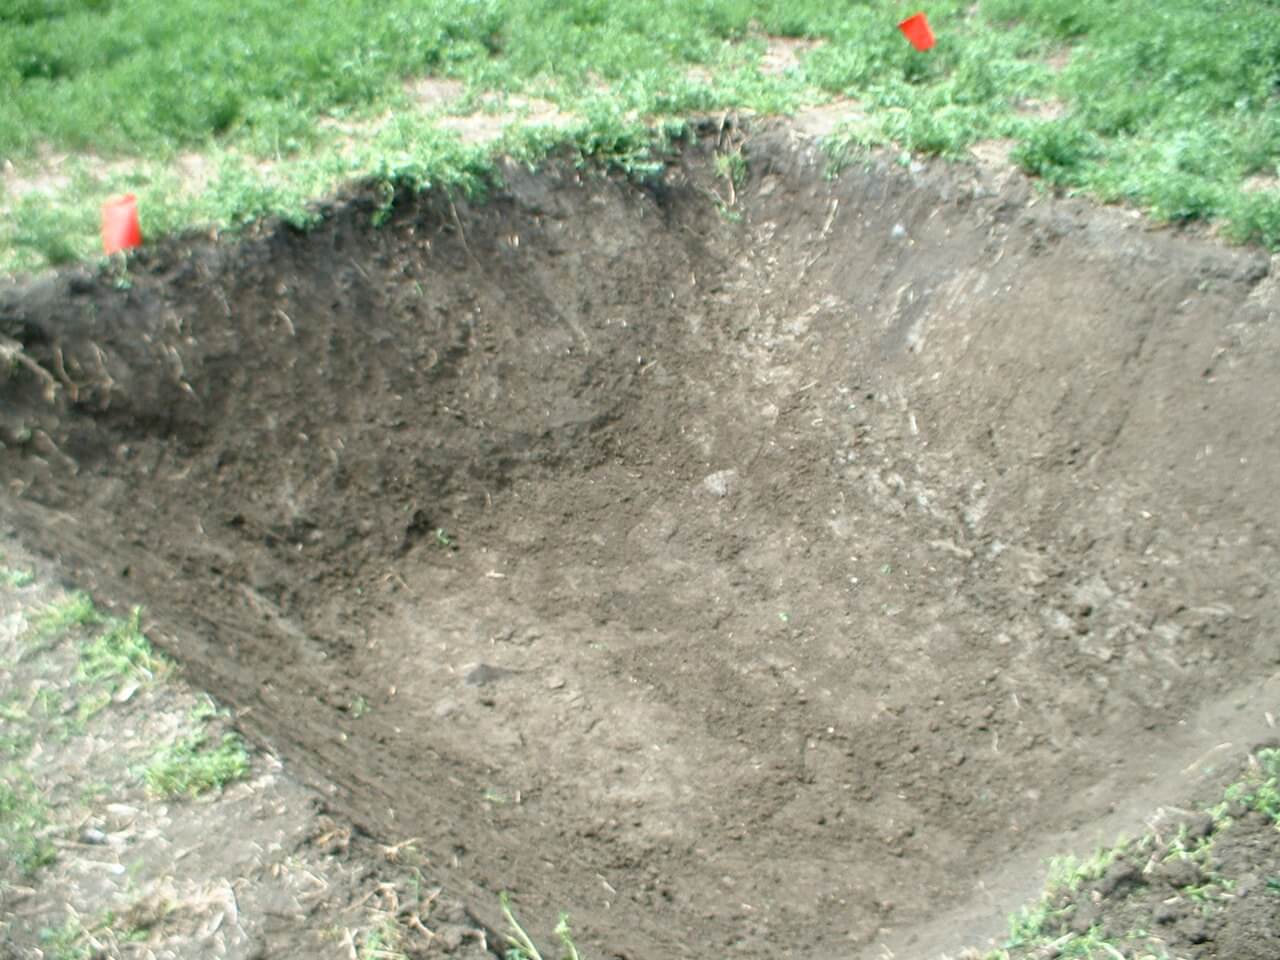
    Figure 8: A nice looking pit.

    • Line the pit with a geomembrane liner. 40 mil is plenty thick; any thicker and it gets hard to handle. Include a raised berm at the edge.

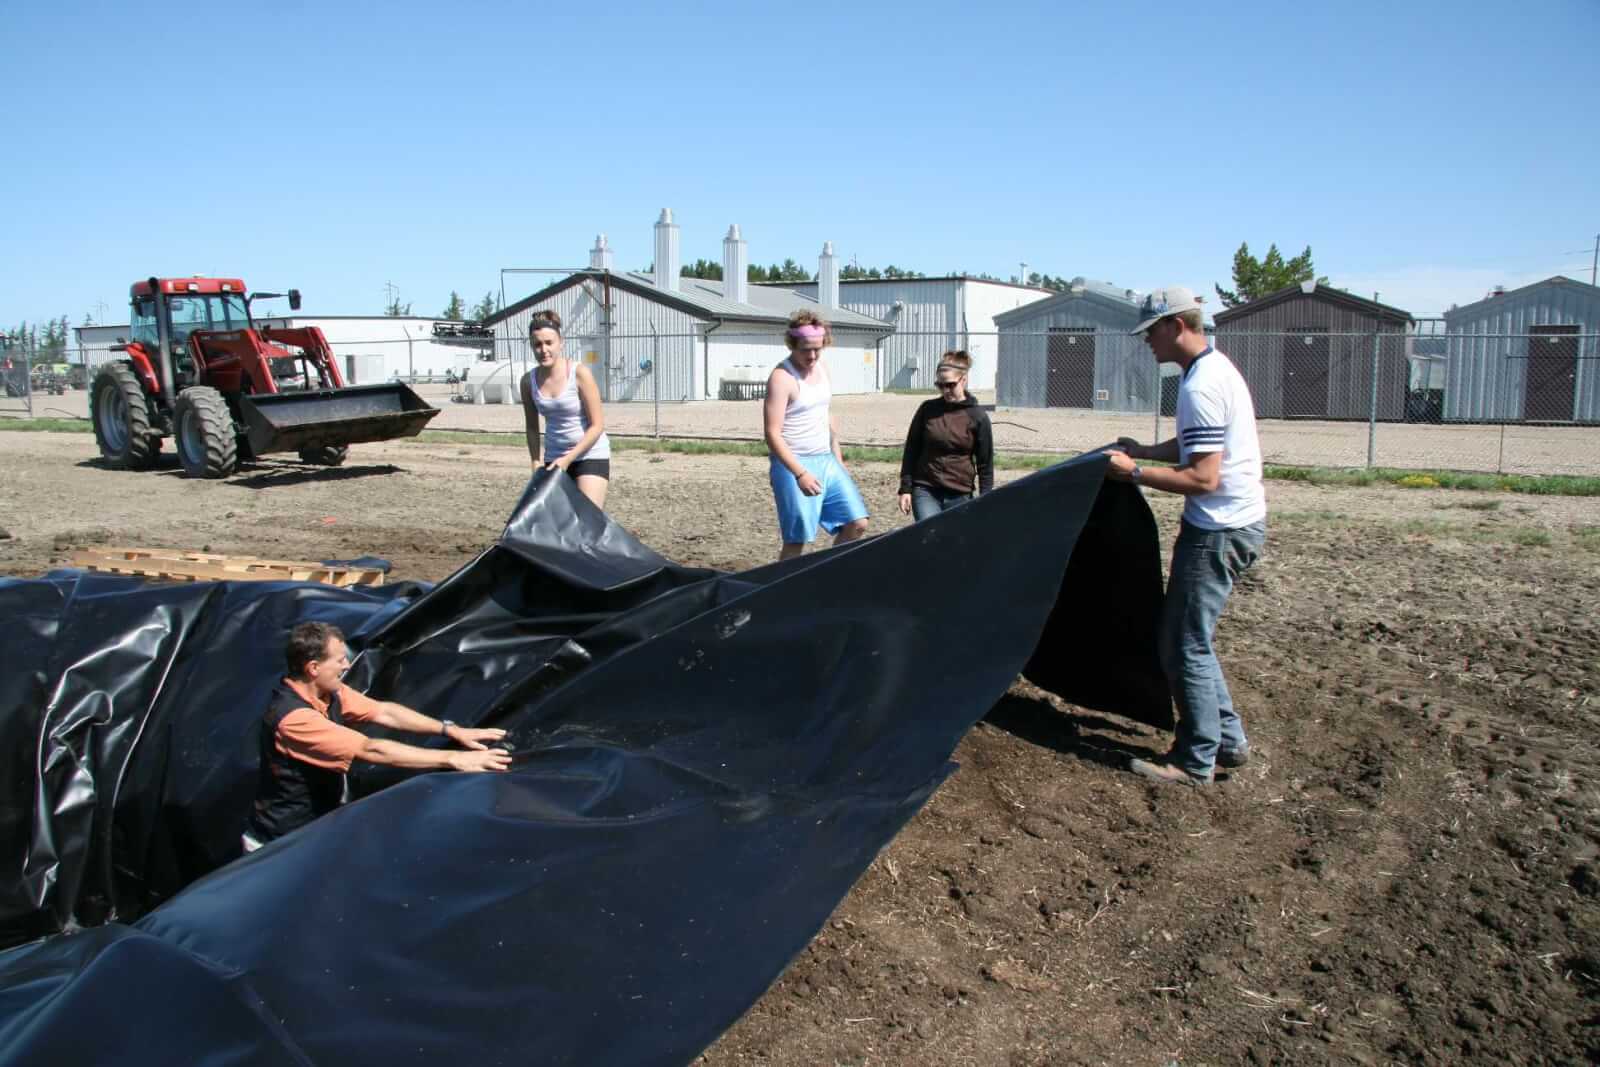
    Figure 9: Liner creates a closed system that will require a way to remove leached water.

    • Install weeping tile at bottom of pit, and extend it to ground level. This will be useful to determine water status and remove water if necessary.

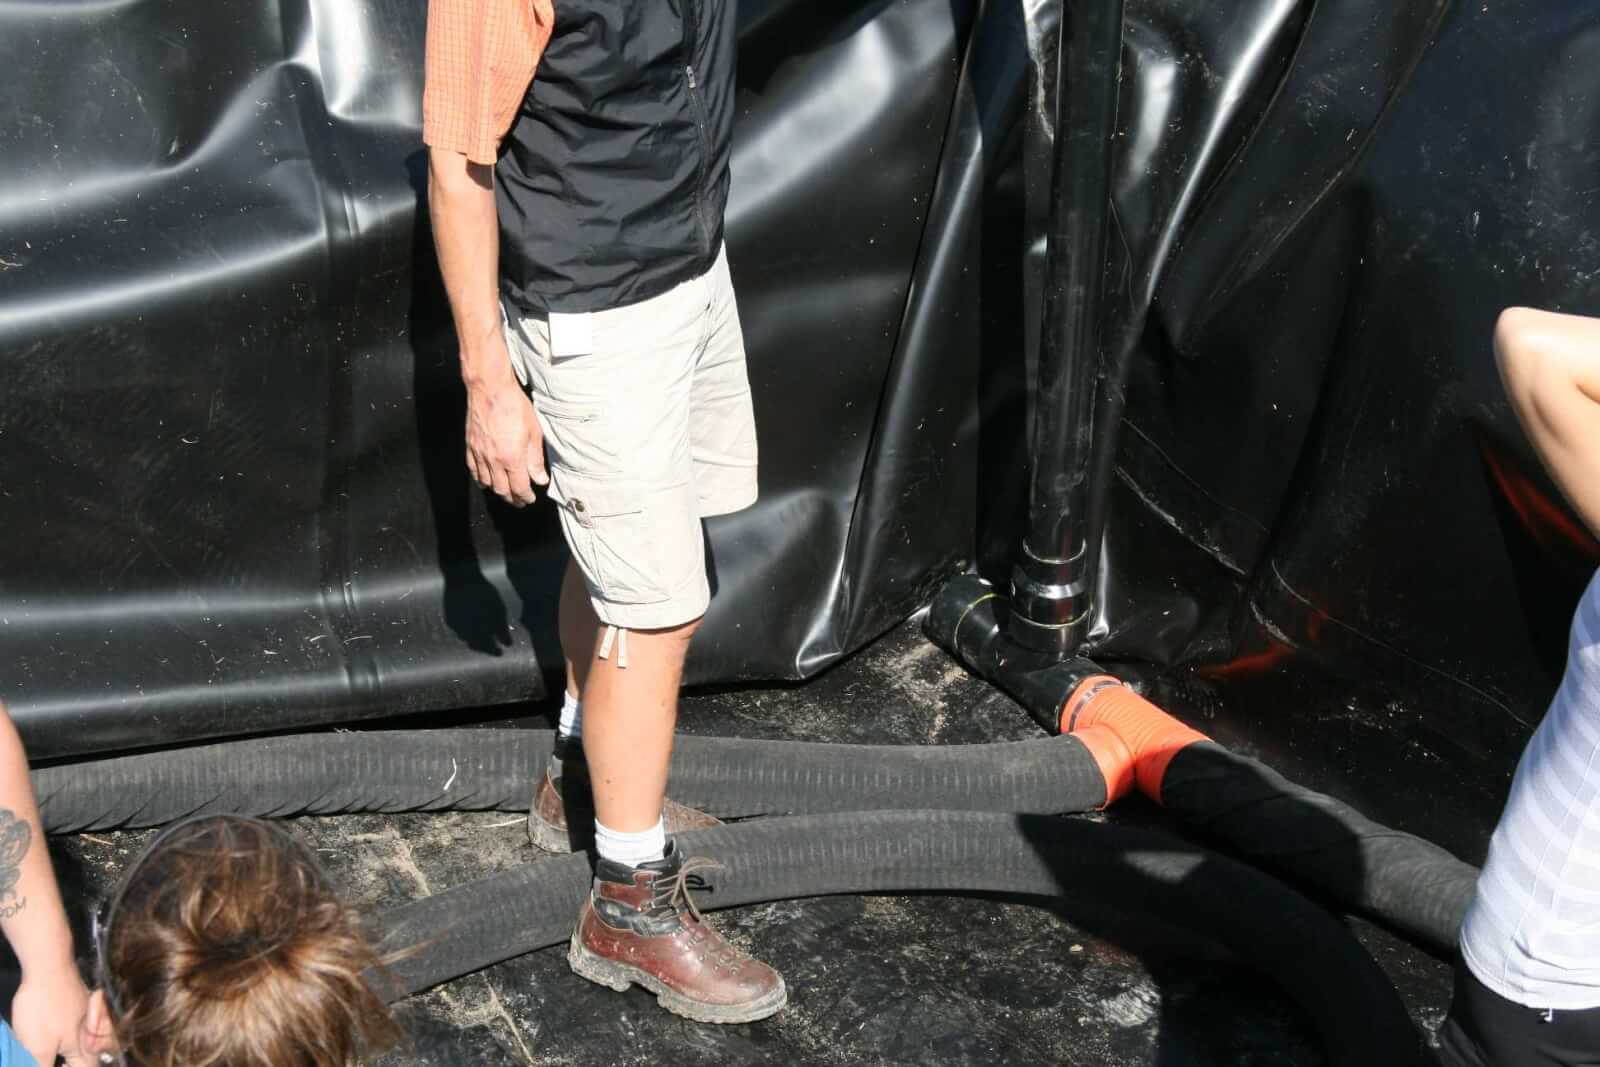
    Figure 10: Weeping tile to collect excess water.

    • Cover weeping tile with pea gravel and a silt trap. This serves to make leached water freely available for removal.

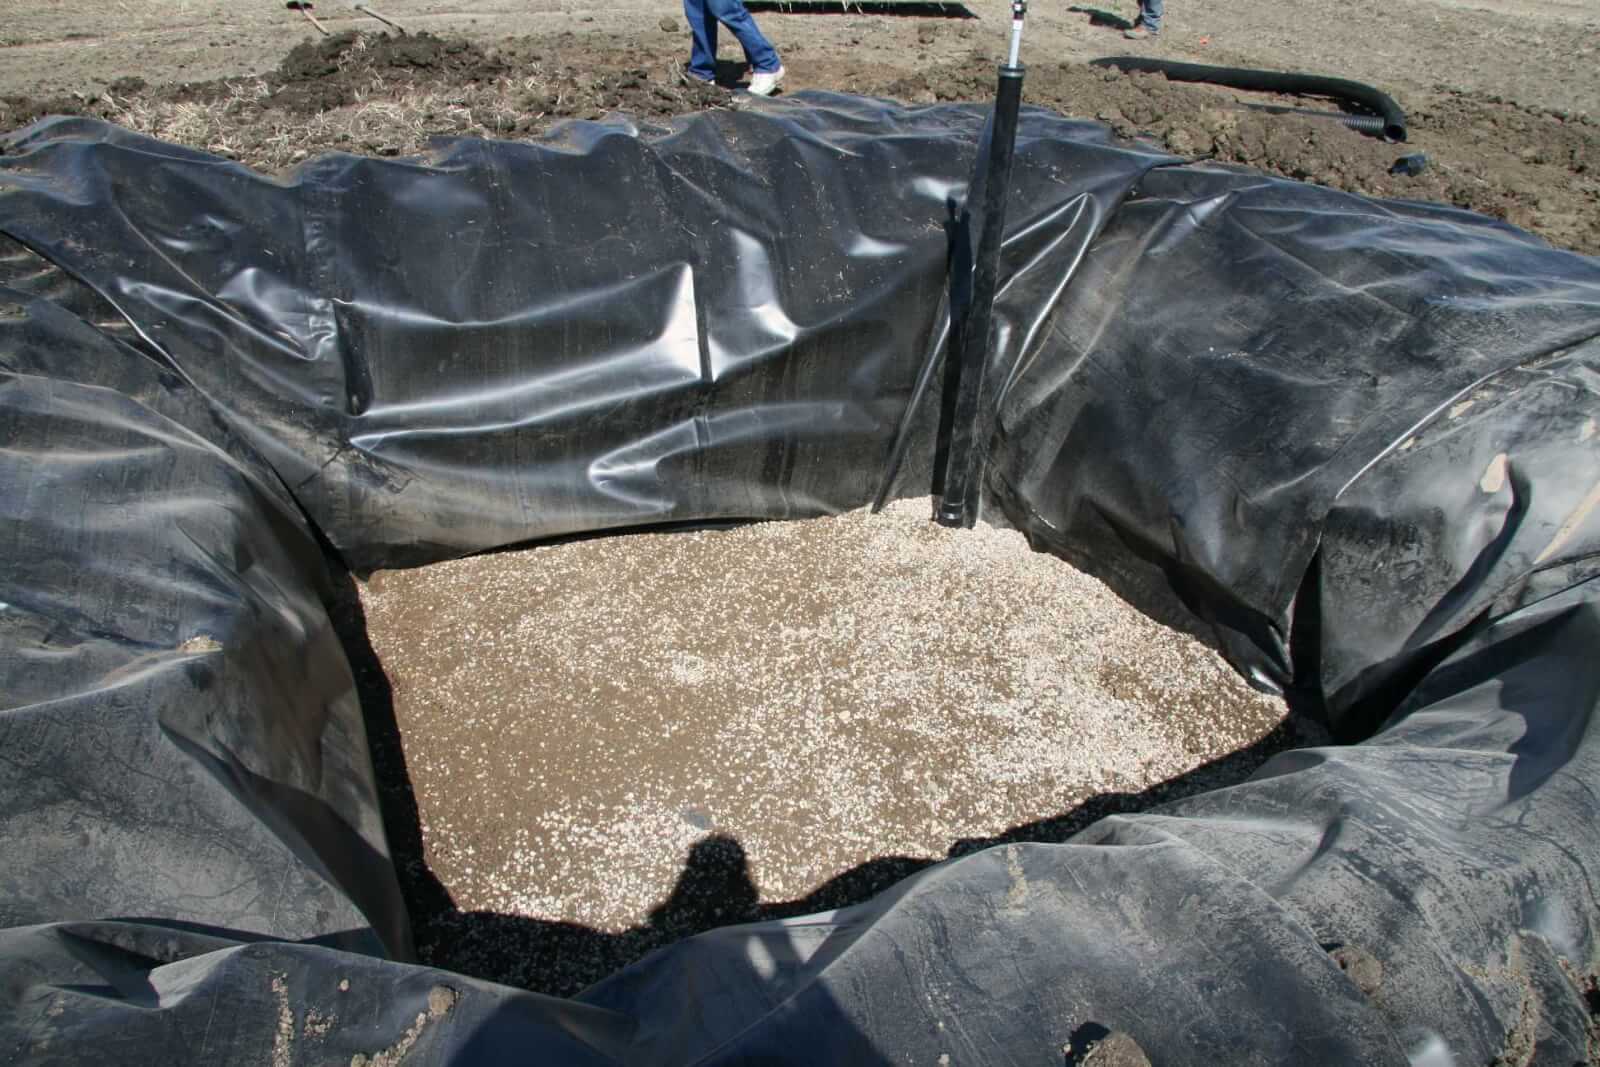
    Figure 11: Pea gravel over weeping tile.

    • Fill pit with biomix, anticipating significant settling. Top up as necessary over next few weeks. Use extra biomix to create a slope away from berm.

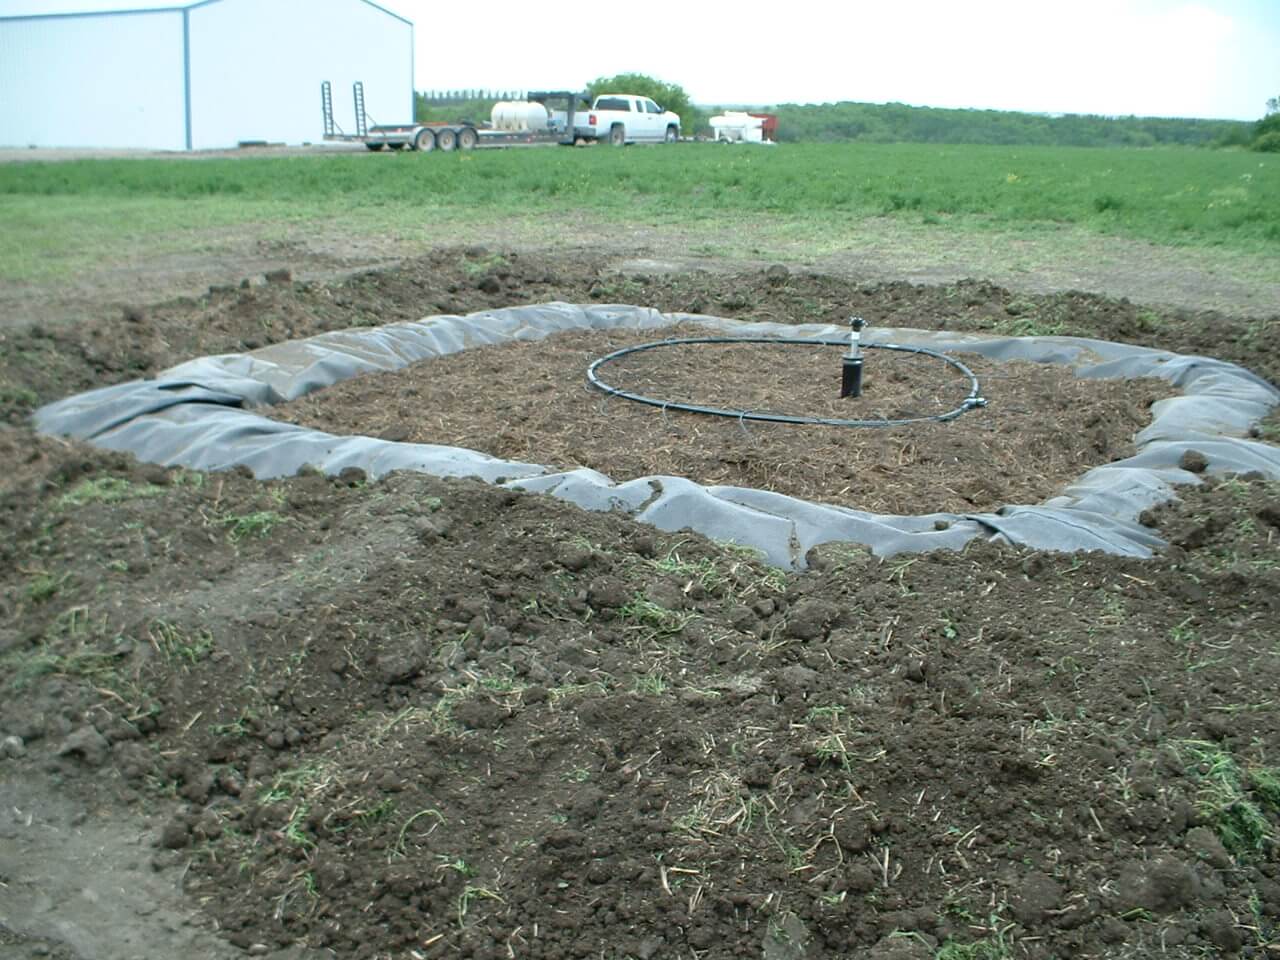
    Figure 12: Filled biobed.

    • Establish a bromegrass cover by transplanting or sodding. This is an important way to remove excess water via evapotranspiration.

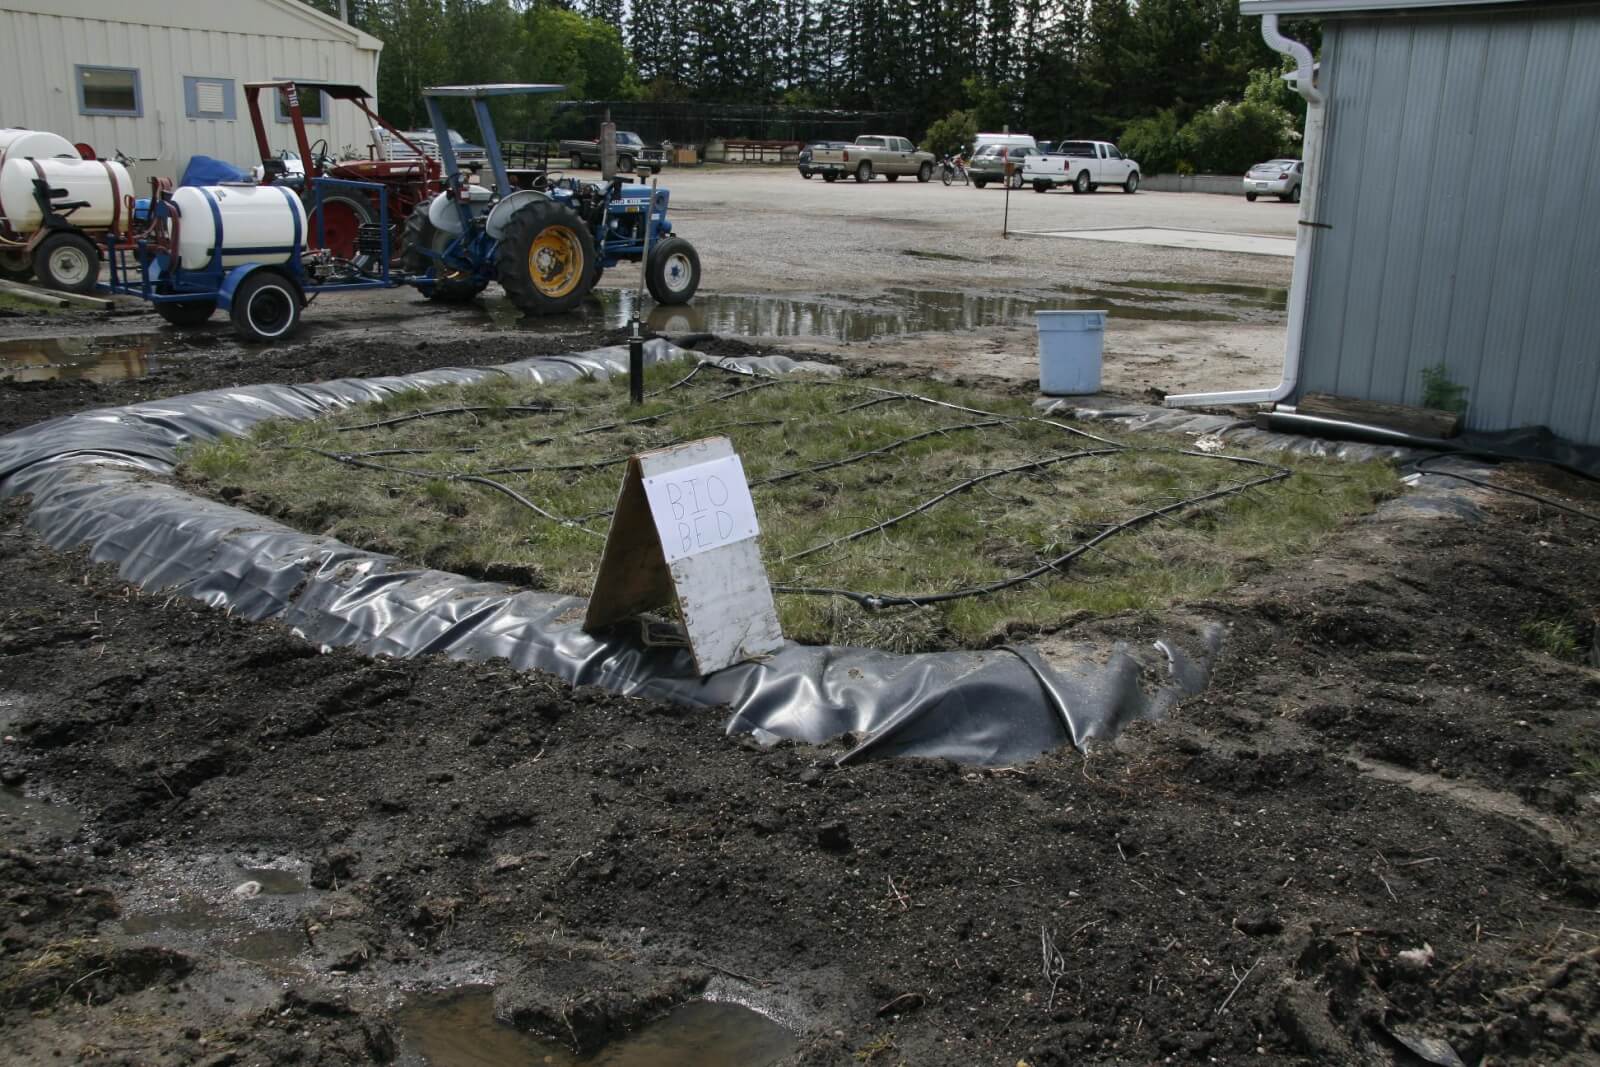
    Figure 13: Early sod growth on biobed at Indian Head, SK.

    • Introduce pesticide waste to biobed, managing moisture content to avoid waterlogging.

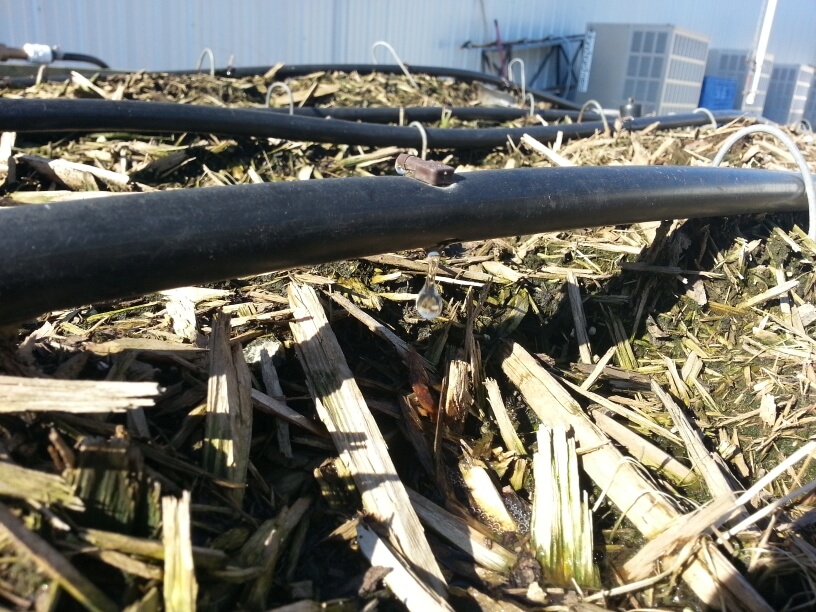
    Figure 14:  Pesticide waste entering biobed via drip irrigation.

    Introduction of pesticide waste to the biobed

    Moving pesticide waste from the sprayer to the biobed should be easy and trouble free. A simple pad built beside biobeds, either sealed with concrete or asphalt, or with a hardy geomembrane liner, works well. The sprayer is cleaned on this pad and rinsate flows into a drain. A sump pump lifts the rinsate to a storage tank from which it is introduced via gravity or pumped drip irrigation.

    Figure 15: Biobed system in Simpson, SK. Rinsate from sprayer is collected in a sump, which is pumped to the black storage tank in background. Rinsate is introduced into biobed (blue tub) as needed (Brian Caldwell in foreground, left, Larry Braul, right).

    When not in use, the sump drains freely to dispose of rain water.

    Others choose to pump or dump rinsate directly into a holding tank, from where it can be pumped onto the biobed.

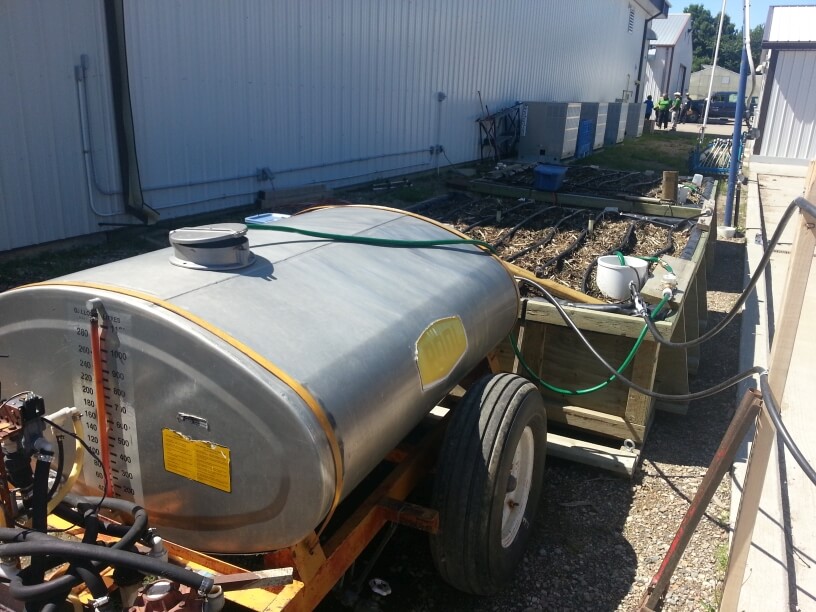
    Figure 16: Holding tank at biobed in Outlook, SK.

    Some European systems include driving supports on the biobed so the sprayer can be parked directly over top.

    Figure 17: Steel beams can allow (light) sprayer access (Source: Eskil Nilsson via Biobeds.org).

    A two-stage biobed

    The same basic building principles apply as in the original simple biobed. However, instead of reintroducing the effluent to the top of the biomix as it collects on the bottom, it is instead pumped onto a second biobed. This biobed then degrades any remaining product. This system is more efficient at degrading persistent products, and allows for better water management.

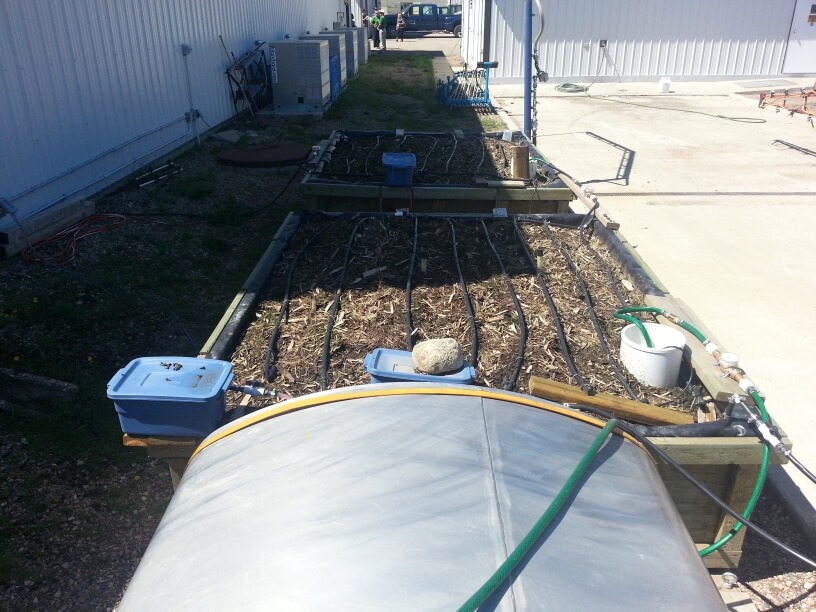
    Figure 18: Two-stage biobed system at Outlook, SK.

    The principle has proven effective, helping degrade more difficult pesticides to acceptable levels.

    Above-ground biobeds

    One of the problems with below-ground biobeds in wet climates is the difficulty managing water. Above-ground biobeds can address this issue by eliminating the possibility of surface runoff being added to the biomix. Adding a rain cover would also be easier and more effective.

    Above-ground biobeds can be edged with plywood, or placed entirely into plastic tanks whose tops have been removed.

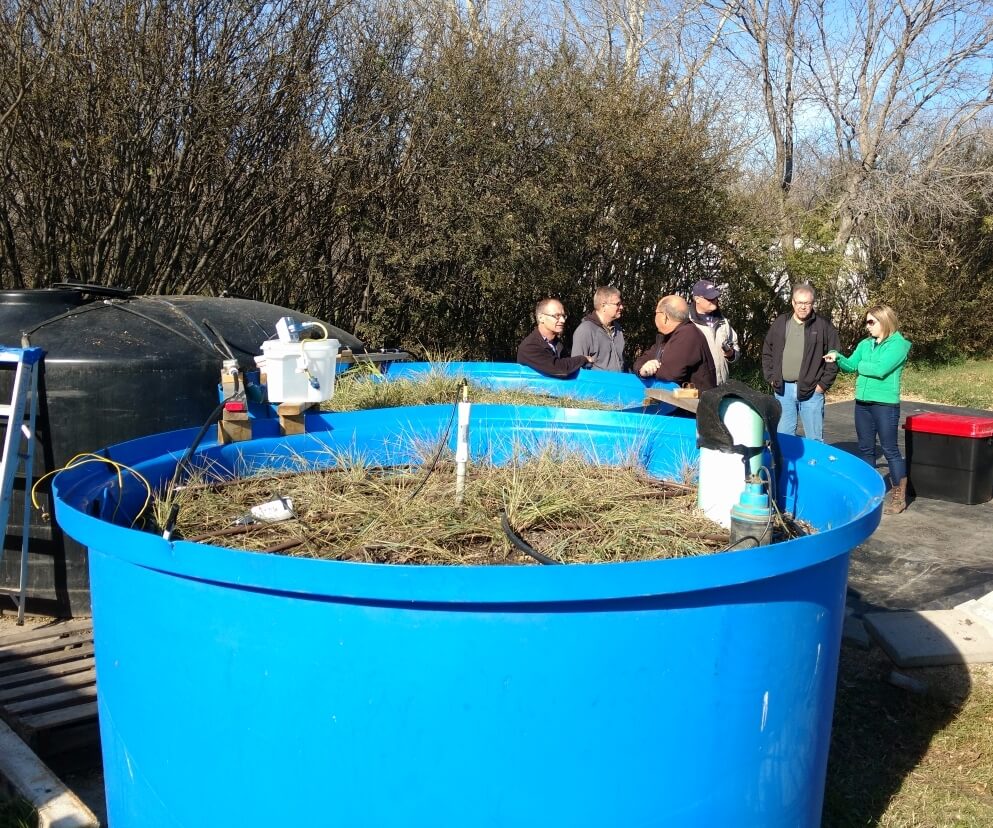
    Figure 19: Above ground biobed installation with plastic tub.

    One potential problem with above-ground biobeds is the later spring warming of this installation compared to below-ground types. Cold temperature reduces the effectiveness of biobeds due to the reliance on microbial activity. Heat tape has been tested by AAFC and shown to be very effective at warming the biomix and stimulating initial microbial activity. Passive solar systems have also been studied but are more difficult to install.

    Figure 20: Heat tape (Source: AAFC).

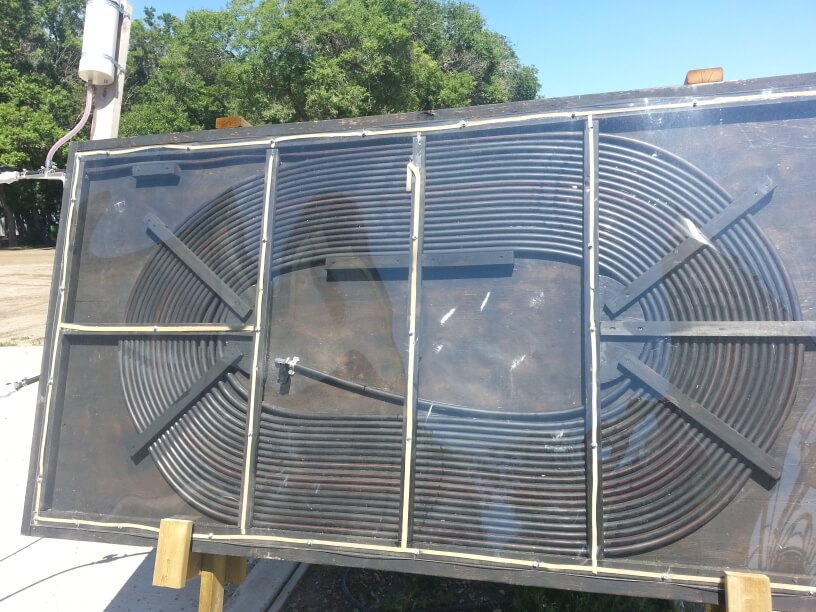
    Figure 21: Passive solar biomix heating system.

    Phytobac and Biofilters

    European designs have utilized plastic containers to form of various designs, including the commercial “Phytobac” systems from France and developed with the support of Bayer CropScience.

    Sequential biofilters have also been implemented. The leachate simply migrates through the biomix into the next container below. Eventually, adjacent biofilters containing plants act to remove the moisture.

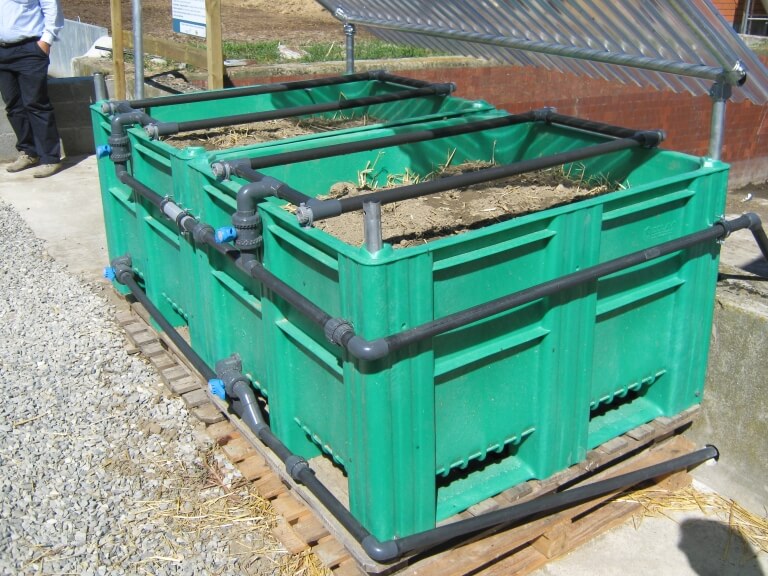
    Figure 22: Phytobac installation, cross-section.

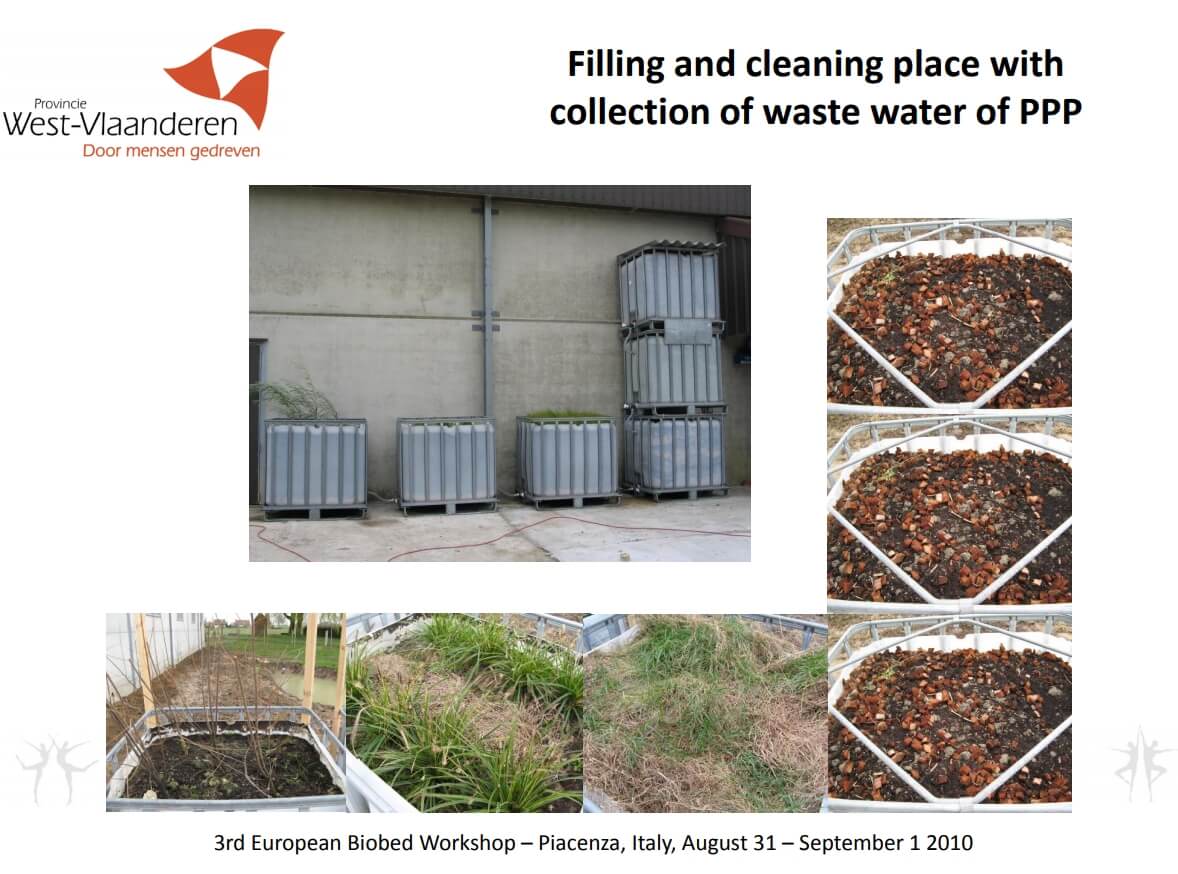
    Figure 23: Biofilter installation in Belgium (Source: Inge Mestdagh via Biobeds.org).

    Biomix longevity

    Swedish and UK research has suggested that biobeds require minimal maintenance aside from water management in closed systems. Biomix will settle over time and may need to be topped up. After five to eight years of use, it has been recommended to remove biomix and distribute it over a field with a manure spreader.

    Canadian research results

    Extensive analysis of pesticide degradation in five biobeds across Western Canada was conducted as part of a three-year study led by AAFC. Between eight and 51 products were analyzed per site, including herbicides, fungicides, and insecticides. Their results showed that single biobeds could remove about 90% of the introduced pesticide, and two in sequence usually removed more than 98%.

    Pesticides that tended not to degrade rapidly were removed to a greater degree in the second biobed.

    In the AAFC studies, three herbicides were more difficult to remove in the tested biobeds: clopyralid (e.g., Lontrel, Stinger), bentazon (Basagran, Storm) and imazethapyr (Pursuit, Arsenal). For these three, roughly 60% was removed in a two-biobed system.

    Concentrated pesticides should not be introduced to a biobed as this will kill the microbial populations.

    Some fungicides were shown to depress microbial populations but only temporarily. Microbial breakdown still occurred.

    Biobed manual

    AAFC has authored a comprehensive manual on biobed operation and installation based on research experience in Canada and elsewhere. It will be available here in late June 2018.

    The future of biobeds

    Research into biobeds remains active around the world. Different substrates for the biomix are being studied to suit local availabilities. Various systems, ranging from simple to highly engineered are being studied. Degradation effectiveness for various influents remains a topic of significant interest. Producer adoption and implementation are being reported.

    Thanks to funded research projects, biobeds are up and working at Canadian institutional sites such as government research centres, and there are opportunities for county and municipal government sites. For biobeds to be a viable option on North American farms, their design needs to remain simple and their integration into established practices needs to be seamless. Producer experience and feedback are essential

    Learn more

    Valuable information on biobeds can be obtained from these two websites:

    Voluntary Initiative (UK industry)

    Biobeds.org (International research)

    Note: Brian Caldwell and I first learned about biobeds from Eskil Nilsson (website) during a visit to Sweden in 2001, and obtained support for initial studies in Saskatoon and Indian Head from the Pest Management Centre as well as Bayer CropScience. Brian took a lead in our creative and technical efforts over many years. Dean Ngombe, under the co-supervision of Diane Knight at the U of S and myself, produced the first M.Sc. thesis, and with significant input from Allan Cessna, the first scientific publications in Canada on biobeds. Thanks for Larry Braul and many collaborators for leading the most recent AAFC study and generously sharing resources, and Erl Svendsen, Bruce Gossen, and Claudia Sheedy for editorial input.

  • “Bee” Responsible with Pesticide Sprays

    “Bee” Responsible with Pesticide Sprays

    Horticultural crops cannot be produced commercially without the use of pesticides to manage the impacts of insects and pathogens. Growers recognize the importance of pollinators and in some cases, rely on bees for pollination. Growers are practicing due-diligence to try to minimize the effects of necessary pest management activities on bees. There’s a fine balance between managing pests effectively and economically and minimizing the effects of pesticides on pollinators. Impact on pollinators is a major consideration for the registration of pesticides.

    Not all pesticides are toxic to honeybees.

    Not a honeybee, but a great photo of a pollinator on a spray boom near some nozzles. Too good not to use.

    Growers use IPM practices which means that they are spraying only when necessary (monitoring for pest levels) rather than following a calendar-based program. Because each droplet of spray that does not land on the target (the crop) is wasted money, growers are more conscious of drift and are using technology to reduce off-target drift.

    The Ontario Bees Act states “No person shall spray or dust fruit trees during the period within which the trees are in bloom with a mixture containing any poisonous substance injurious to bees unless almost all the blossoms have fallen from the trees.” While some crops, like grapes and peaches, do not rely on insects for pollination, bees may still visit their flowers and they are still present in vineyards and orchards before and after bloom, foraging for nectar and pollen on flowering plants in row middles and surrounding vegetation areas. We have been promoting row middle management with flowering plants to encourage the presence of beneficial insects. Honey bees are also attracted to these plants. For this reason, it’s important to recognize that sprays applied to manage pests may have adverse effects on honey bees as well.

    One of the most important things to do is to maintain communication between growers/custom operators and beekeepers. While it’s common sense to not allow insecticides to drift directly onto bee hives, bees will usually forage up to 3 km from a hive and when food sources are scarce, they are known to fly as far as 12 km (8 miles) (Download reference).

    BeeConnected is an app connecting registered beekeepers with registered farmers and spray contractors, enabling anonymous communication on the location of hives and crop protection product activities. The app is available free of charge through a web browser, the Apple App Store and Google Play.

    Here are a few others things you can do:

    Read the pesticide label:

    Carefully follow listed precautions with regard to bee safety. In some cases a product may not be used while bees are actively foraging.

    Product selection:

    Pesticides (insecticides and fungicides) are not all equally toxic to honey bees. It is also important to be familiar with the relative toxicity of pest control products to bees. In Publication 360, Fruit Crop Protection Guide, the relative honeybee toxicity is now listed in the fungicide and insecticide activity tables of each chapter. The impact of products that are moderately toxic to bees can be can be minimized if dosage, timing and method of application are correct. Highly toxic products may cause severe losses if used when bees are present at treatment time or within a few days thereafter.

    Choose the least hazardous insecticide formulation. Emulsifiable formulations normally have a shorter residual toxicity to bees than wettable powders and flowables which, in addition to having residual characteristics can be more easily picked up from the flowering plant while bees are gathering pollen.

    Spray timing:

    Whenever possible, apply products with toxicity to bees in late evening, night or early morning while bees are not foraging (generally between 8 p.m. and 8 a.m.). Evening applications are less hazardous to bees than early morning applications. Warm days and nights can extend the foraging period; therefore applications may be necessary later in the evening or earlier in the morning under unusually warm conditions. Do not apply insecticides when cool temperatures are expected after treatment. Residues will remain toxic to bees for a much longer time under cool conditions. Do not apply insecticides that are toxic to bees on crops in bloom, including crops containing weeds or cover crops in bloom. Avoid treating during hot evenings if beehives are very close to the target field and honey bees are clustered on the outside of the hives.

    Remove alternate pollen sources:

    Where feasible, eliminate weeds or flowers in row middles by mowing at least 2 days before a pesticide with toxicity to bees is to be applied.

    Minimize off-target drift:

    Drift of spray applications can cause significant bee poisoning problems, particularly when drift reaches colonies or adjacent flowering weeds. In general, sprays should not be applied if wind speed exceeds 10 mph and favors drift towards colonies. Give careful attention to position of bee colonies relative to wind speed and direction. Ensure that there are no colonies directly in the orchard at the time of spray. Select drift-reducing spray nozzle technology, whenever possible. Since fine droplets tend to drift farther, apply spray at lower pressures or choose low-drift nozzles that reduce drift by producing a medium to coarse droplet size.

    Calibrate spray equipment often. Air-blast sprayers can produce finer droplets with greater drift potential. When using an air-blast sprayer, consider redirecting or turning off nozzles, or use technologies that reduce drift (for example, towers, multirow, tunnel and target-sensing sprayers). Shut off sprayer when making turns at field ends or gardens, near large puddles, ponds and other sources of water that may be used by pollinators and other wildlife.

    There is a precaution to nighttime spraying: you must be aware of inversions. When you spray during an inversion, the larger drops fall quickly (per normal), but smaller lighter droplets fall very slowly (a few centimetres per second). They do not disperse. Instead, they move with the air they were released into, evaporating very slowly, over great distances. These small particles, as well as vapours from volatilizing products, are capable of moving for kilometers and are therefore subject to drift.

    The only sure way to know if you are in an inversion is to take two air temperature readings: the first about 10 cm from the ground, and the second about three metres off the ground. If the surface air temperature is cooler, you are in an inversion. The magnitude of the difference indicates how strong the inversion is. Accurate measurements are difficult to manage with conventional thermometers (Although the new Spot-On Inversion Detector makes it possible). It is generally easier for sprayer operators to watch for the following cues:

    • Large temperature swings between daytime and the previous night.
    • Calm (e.g. less than 3 km/h wind) and clear conditions when the sun is low.
    • Intense high pressure systems (usually associated with clear skies) and low humidity where you intend to spray.
    • Dew or frost indicating cooler air near the ground (fog may be too late).
    • Smoke or dust hanging in the air or moving laterally.
    • Odours travelling large distances and seeming more intense.
    • Daytime cumulus clouds collapse toward the evening.
    • Overnight cloud cover is 25% or less.

    If you suspect a strong inversion, don’t spray. Postpone the application if possible.

    Reducing pesticide injury to honey bees requires communication and cooperation between beekeepers and growers and applicators. It is important that beekeepers understand cropping practices and pest management practices used by farmers in the vicinity of their apiaries. Likewise, pesticide applicators should be sensitive to locations of apiaries, obtain a basic understanding of honey bee behavior, and learn which materials and application practices are the most hazardous to bees.

    Furthermore a number of native pollinators such as bumblebees, leaf cutter bees, sweat bees and squash bees are also important pollinators in some crops and they too require consideration. While it is unlikely that all poisonings can be avoided, a balance must be struck between the effective use of insecticides, the preservation of pollinators and the rights of all — the beekeeper, farmer and applicator.

  • Spraying Large Nut Trees – Part 2

    Spraying Large Nut Trees – Part 2

    This article continues from Part 1.

    Droplet size

    Droplet size influences droplet behaviour. The following table lists the pros and cons to changing droplet size when overall spray volume (e.g. L/ha) remains constant.

    Relative Spray QualityProsCons
    Coarser DropletsLower drift potential because they resist deflection by wind and evaporation from heat and low humidity.Lower droplet count may reduce coverage.
    Greater mass means they move ballistically, propelled at higher speeds by pressure for greater distance.May fall out of the spray before reaching the top or centre of the canopy.
    Coarser droplets do not penetrate dense canopies as easily as finer droplets.
    Redistribution due to bounce, shatter or run-off may either improve or compromise coverage.Redistribution due to bounce, shatter or run-off may either improve or compromise coverage.
    Finer Droplets Higher droplet count may improve coverage (if they arrive at the target).Higher drift potential from wind, and evaporation from heat and low humidity.
    Finer droplets penetrate denser canopies better than coarser.
    Finer droplets move unpredictably and require optimal air settings to direct them to the target. Sprayer design and air settings will determine if it is optimal for nearby or distant targets, but it is rarely if ever both.Finer droplets move unpredictably and require optimal air settings to direct them to the target. Sprayer design and air settings will determine if it is optimal for nearby or distant targets, but it is rarely if ever both.

    It is preferred to use nozzles that create coarser droplets at higher rates (to compensate for fewer droplets) in the higher boom positions. They are more likely to stay on course to the tops of the trees, and when they miss, many fall out of the air rather than contribute to drift.

    Learn more about strategies to reach the top of a canopy here.

    Finer droplets have very little mass and therefore very little kinetic energy. This means they slow quickly (imagine throwing a feather) and require entraining air to carry them to the target. Finer droplets also evaporate quickly, particularly on hot and dry days (i.e. unsuitable Delta T conditions). If employed, they should be distributed in the lower-middle portion of the boom where they have the least distance to travel and are most likely to be intercepted by canopy.

    Boom distribution

    Unlike a broad acre boom sprayer, where each nozzle emits the same rate, an airblast boom can distribute spray unevenly. For a curved (axial) boom, the rule of thumb is to produce 2/3 of the overall volume from the top 1/3 of the boom. This compensates for the distance and greater proportion of canopy it is intended to cover.

    A vertical (tower) boom positions each nozzle roughly the same distance from the target, and if that target is a hedged canopy, the spray can be distributed equally over the boom. Research has demonstrated that there is no appreciable advantage to one spray shape over another (e.g. flat fan, hollow cone, full cone) other than the spray quality they produce.

    In extreme cases, operators might elect to “fire hose” spray to the tops of canopies using high pressures. This is achieved by using streaming nozzles or removing the swirl/whirl/disc plate in a disc-core combination nozzle in the top few nozzle positions. Given the heavy demand on the pump and the inaccuracy of the method, this should only be considered when air fails to reach the tops of trees.

    Learn more about nozzling an airblast sprayer here.

    Spray coverage and diagnostics

    It’s well understood that spray coverage has a negative correlation with tree height. The irony is that in large nut trees the upper portion of the canopy produces much of the harvest. Taken collectively, this may explain why pest activity is also highest in the upper canopy. When choosing a spray volume and boom distribution, the metric is threshold coverage in the top 1/3 of the canopy. This requires us to define threshold coverage.

    If ribbons and leaf movement represent the feedback mechanism for air settings, then water sensitive paper (WSP) is the choice for spray coverage. Placement in tall trees can be tricky, given that we are most concerned with coverage at the top, but this can be overcome by mounting the WSP on telescoping poles. Papers can be oriented horizontally to represent a leaf, or curled around the pole to give panoramic coverage and emulate a nut. Beware over-blowing in the lower canopy, which creates a shingling effect where leaves cover one another (or the WSP) and block coverage.

    Fluorescent dyes and kaolin clay show spray coverage in situ, but there are drawbacks. Few growers will spray dye and come back at night with a black light to examine targets. Further, a target sprayed with dye or clay cannot be sprayed a second time, which means the grower can’t adjust the sprayer and try again in the same canopy. And finally, it’s very difficult to determine if there is more or less coverage with clay or fluorescent dye.

    Learn more about how to use water sensitive paper here.

    WSP is fast, cheap and effective. With the exception of drench applications, the most demanding spray application (e.g. contact fungicide) should produce a spray coverage pattern of 85 drops per cm2 and 10-15% total coverage on 80% of the targets. This threshold comes from collective research and experience in many horticultural crops, and should true hold for tree nut.

    Be prepared to make changes to your sprayer calibration to compensate for tree height, canopy density, and weather conditions throughout the season. The feedback from water sensitive paper is far more accurate than shoulder-checks and leaf residue. It takes some time and effort, but it’s well worth it. Coverage is King.

    What others have done

    Researchers like Brad Higbee (Paramount Farming Co.) and Ken Giles (UC Davis) have explored spray coverage and efficacy from different sprayer configurations to combat Naval Orange Worm in almond. What follows is a summary of their observations. This information comes from their presentations and conversations with Brad.

    Ten years of trials spanned travel speeds of 3-6.5 km/h, volumes of 1,400-2,150 L/ha, and sprayer-generated airspeeds (measured at source) of 80-290 km/h. They looked at efficacy, residue levels and WSP coverage both in leaves and on the nuts themselves. When comparing sprayer configurations, the target almond tree was divided into four levels:

    • Level 1 = 1.8 m to 2.5 m (Lower canopy)
    • Level 2 = 3.0 m to 3.7 m
    • Level 3 = 4.2 m to 4.9 m
    • Level 4 = >5.5 m (Upper canopy)

    Many configurations were tested, but the following figure shows the top four. Of those not shown, most notable are the Bell 206 helicopter (280 L/ha at 50 km/h) and the Curtec AC 1000 Cross-Flow tower.

    A. Air-O-Fan low profile axial D-240 (Also used Air-O-Fan 232).
    B. Progressive Ag two-head 2650 electrostatic air-shear with 4 m tower (Also used 4.9 m three-head and 5.5 m four-head).
    C. Blueline Accutech 10-head air-shear tower.
    D. Low-profile axial airblast with two Sardi-style fans on mast. Upper fans set to 70% overall fan speed and spray volume. Axial fan and nozzles set to 30%

    Here is a summary of their observations:

    • Spray coverage and residue deposition was weakest in upper half (Levels 3 and 4) of canopy. Tower sprayers tended to provide more uniform coverage across vertical levels. For low-profile axial sprayers, most of the residues were deposited in the lower half of the tree.
    • The Air-O-Fan low-profile axial had the highest overall residues. But, above 3.7 m there was severe drop off in coverage. PTO-driven sprayers seemed as effective as engine driven. Incremental improvements were observed on this sprayer when using multiple banks of booms, full cone and hollow cone nozzles.
    • The Progressive Ag tower provided the highest residue deposition above 3.7 m and modest deposition in the lower canopy. While tower sprayers tended to provide more uniform coverage, the Progressive Ag was not significantly better than the Air-O-Fan overall.
    • Aerial application (280 L/ha) combined with the Air-O-Fan low-profile axial sprayer (1,870 L/ha) did increase residues in the upper canopy, but did not result in greater damage reduction relative to the Air-O-Fan alone.
    • Slowing the Air-O-Fan low-profile axial sprayer from 4 to 3.2 km/h resulted in 30% more coverage and 47% higher residue deposition overall.
    • Electrostatic treatments did not perform well on WSP (small droplet size was suspected), but they were among the best in residue deposition at full volume and “delivered surprising residues at high speeds/low volumes”.

    Brad has done remarkable work studying the impact of several sprayer configurations. While many were tested, there are still more that might be considered.

    Canopy management

    When all else fails, we are left with only one alternative: canopy management. Hedging and pruning the trees to create sprayer clearance opens canopies to spray (and light and air) and is a critical part of crop protection.

    Learn more about the benefits of canopy management here.

    Topping trees to bring them to a manageable height to improve coverage and reduce drift may be the only viable option for protecting the crop. I acknowledge that a great deal of nut production takes place in the upper third of the canopy, and it is beyond the scope of this article to discuss production and yield economics. However, when the crop is left unprotected, the yield quality is negatively impacted and it has been shown that a reduction in harvest weight is offset by the improvement in overall quality.

    Where plants are very old and overgrown (such as macadamia), it is highly recommended that the orchardist engage a local crop expert and discuss a strategy for canopy management. There are many benefits, including:

    • Improved harvest quality
    • Fewer refills (saving time and water)
    • Less time to spray means more timely applications
    • Potential chemistry savings
    • Savings in gas, noise and equipment wear and tear
    • Potential for reduced off target spray drift

    Summary

    Spraying large nut trees is a challenging proposition. A number of inter-connected factors are involved and an operator must address all of them make spraying as efficient and as effective as possible.

    • Adjust sprayer air settings first, using canopy penetration as your guide to travel speed.
    • Distribute the 2/3 of the volume and coarser spray quality to the top 1/3 of the boom.
    • Consider an air-assisted vertical boom configuration to improve coverage uniformity and reduce drift.
    • Use water sensitive paper for critical coverage feedback and make changes based on that feedback.
    • Develop a canopy management strategy to improve spray coverage and yield quality.