Spray application is one of the most important activities regularly done in any crop operation. It can also be one of the most expensive and time-consuming. Integrated Pest Management (IPM) is a multi-step process that helps sprayer operators make informed choices about when and what to spray. But, the decision to spray is not the end of the process.
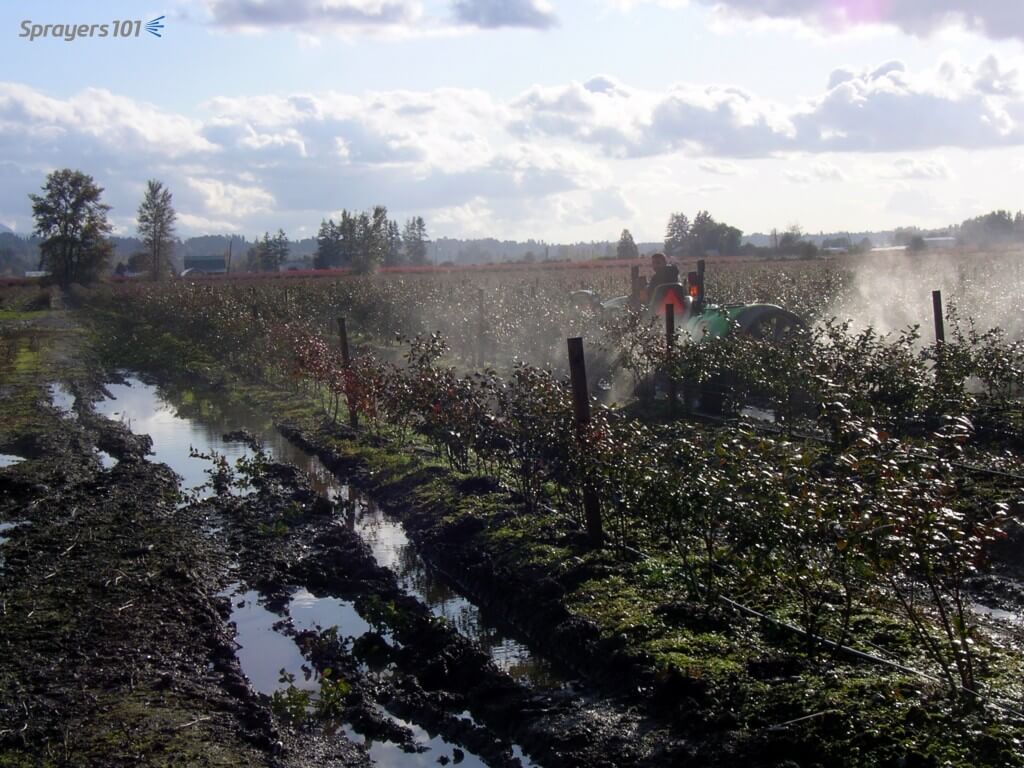
Spraying highbush blueberry in British Columbia just after a rain. Not ideal, but sometimes the window for application is very small. It’s not the ideal situation, but one strategy for spraying a protectant fungicide on wet leaves is to concentrate the tank mix and use less spray per hectare. The fewer, and more concentrated, spray droplets will dilute in the water already on the leaves and the possibility of run-off is reduced. This is a stop-gap measure, only. The spray will not dry or distribute as it was intended and this strategy will require an additional full-rate application as soon as the weather improves, as long as the label permits. It is often said there is no such thing as a wasted fungicide application.
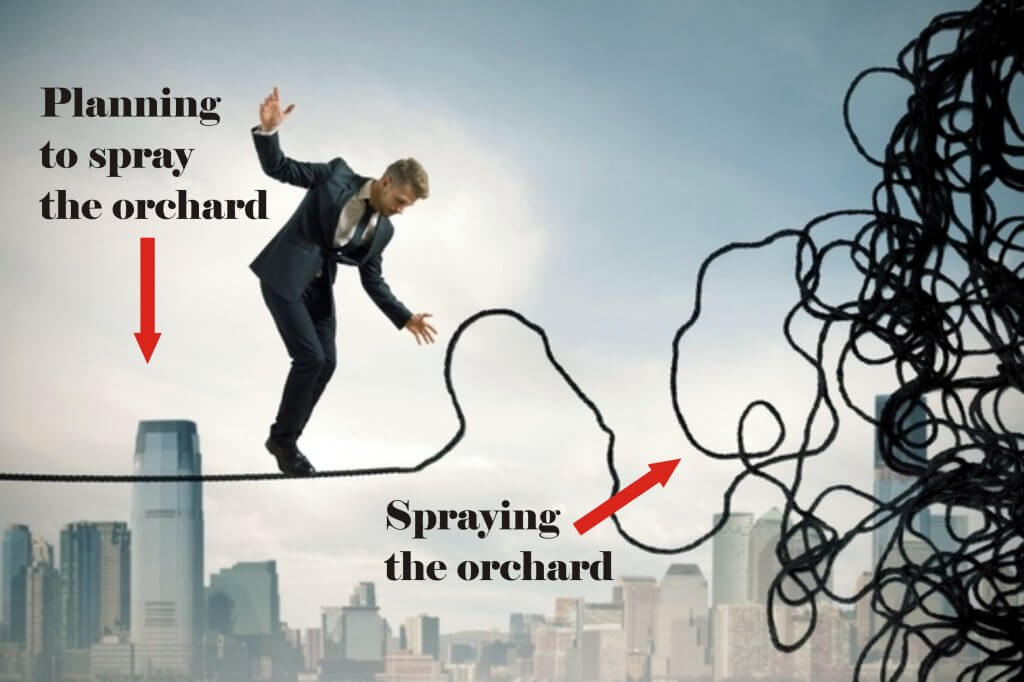
The sprayer operator now faces a lot of decisions about sprayer set-up and application method. These decisions determine if the application will be effective, and they also determine if it will be efficient. Efficient spraying saves money and reduces environmental impact. The goal is to be both effective and efficient.
So what should the operator be aware of?
A quick Google search reveals a seemingly endless number of sprayer articles by government, industry and academia (and many on this website!). There are differences in definitions, opinions on priorities vary, and classic sprayer wisdom is sometimes supported and sometimes debunked by current research. But, if you read enough of them you will find more similarities than differences, and common themes will emerge.
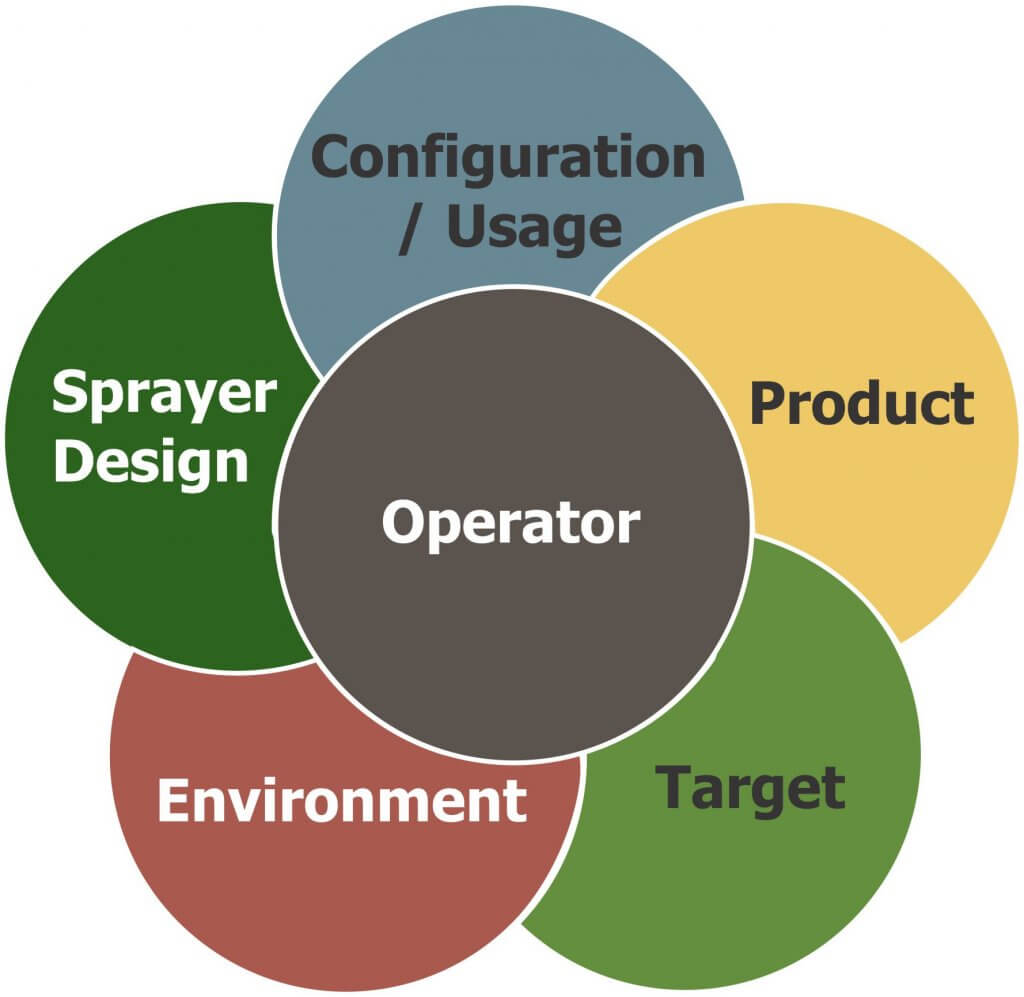
Most agree that the objective of spraying is the safe and timely delivery of an effective, uniform dose of product to a target area. Any product not deposited on the target (e.g. spray drift, sprayer leaks, run-off, etc.) reduces efficiency and is called wastage. The literature points to six broad elements that affect spray efficiency and effectiveness. Sprayer operators should actively consider all six elements before, and during, each spray application.
The six elements in the illustration overlap because changing one of the elements often means reconsidering others. For example, increasing droplet size to reduce drift potential also reduces the number of droplets sprayed. This may warrant higher spray volumes, which means you might require a more dilute tank-mix to maintain the rate-per-area. Only the sprayer operator’s decisions affect all the elements, which is why it’s pictured in the centre. Technology or technique can not compensate for an inattentive operator; an operator’s skill and willingness to do a good job impacts the overall efficiency and effectiveness of every spray application. Understanding how droplets behave (or misbehave) is essential.
The six elements of effective and efficient spray application.
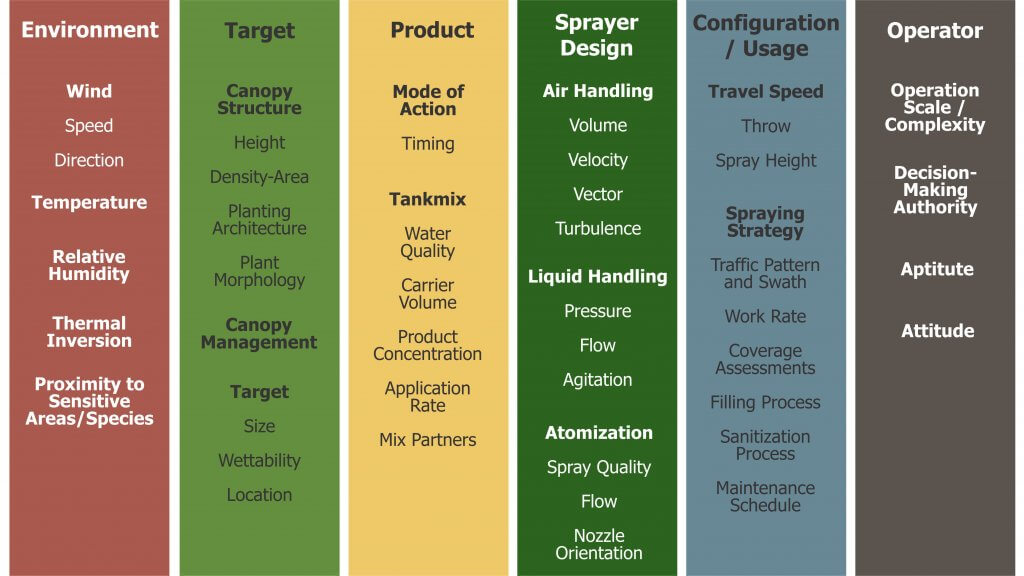
Each element is comprised of many contributing factors. Some of these factors might fit under multiple elements and certainly we’ve reorganized this list many times over the years. No matter how they are presented, all of these factors (and more) contribute to the success of spray applications and they should figure into the operator’s considerations.
The expanded six elements of effective and efficient spray application.
So, as sprayer operators, we should all be aware of how the factors that affect an application. Take an active role! Don’t be afraid to get out of the tractor and make changes to your pressure or your nozzle choice. Check your coverage as you spray, and make adjustments as the weather changes. Finally, recognize when it’s a waste of time and spray, and know when to pack it in. The days of “set it and forget it” are no more!
Most pesticides are either pre-formulated with the required adjuvants, or the label specifies their addition. However, compelling claims by manufacturers create interest in tank mixing additional adjuvants to improve some aspect of pesticide performance. In a previous article we advised caution when using adjuvants in airblast sprayers (see here). Specifically, we stated that unless an adjuvant has been tested with airblast equipment, do not assume it will perform as it does in a boom sprayer. In the last year, we’ve received a lot of questions about anti-drift adjuvants, so we decided to test one of the more popular products.
The Adjuvant
According to the manufacturer, InterLock is a vegetable oil-based adjuvant intended to improve deposition, canopy penetration and drift reduction from both aerial and ground applications. Independent research has validated its ability to reduce the population of Finer droplets produced by a nozzle without shifting the entire droplet spectrum into a Coarser category. As such, InterLock is used extensively in aerial and field sprayer applications, but we wanted to explore its fit in airblast applications.
There are fundamental differences in how an airblast sprayer functions compared to a field sprayer. An airblast sprayer operates at pressures considerably higher than field sprayers, and many use paddle agitation to churn tank mixes. Further, droplets are entrained by air and can be carried several meters before reaching their target. So, does the collective impact of paddle agitation, droplet shear and the increased opportunity for evaporation affect the adjuvants performance?
The Trials
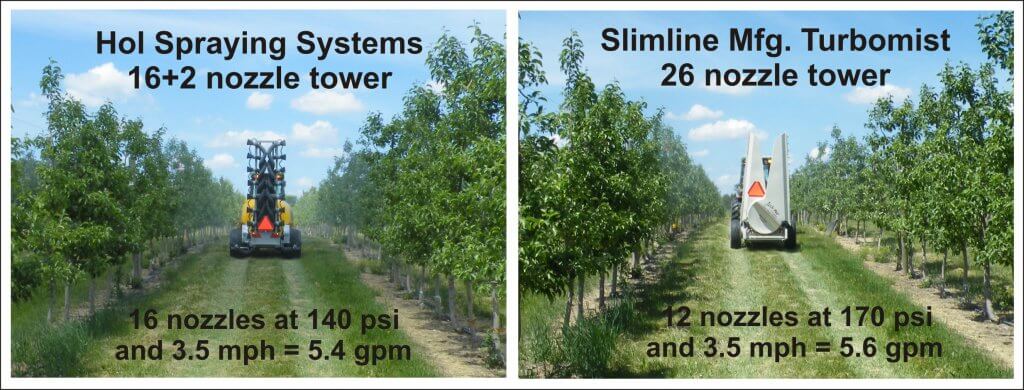
Water sensitive cards were distributed throughout target trees in an apple orchard. We elected to use two models of airblast sprayer to eliminate the chance of sprayer-specific results. Both models applied either water or water-and-adjuvant. So, the four treatments were:
Hol Sprayer: Water Hol Sprayer: Water-and-Adjuvant Turbomist: Water Turbomist: Water-and-Adjuvant
Weather Conditions
On the afternoon of May 30, 2016, the crosswind was 6-11 kmh (3.7-6.8 mph), the temperature was 27 ˚C (80.5 ˚F), and the relative humidity was ~50%. While warm, conditions were reasonable for spraying.
Orchard and Targets
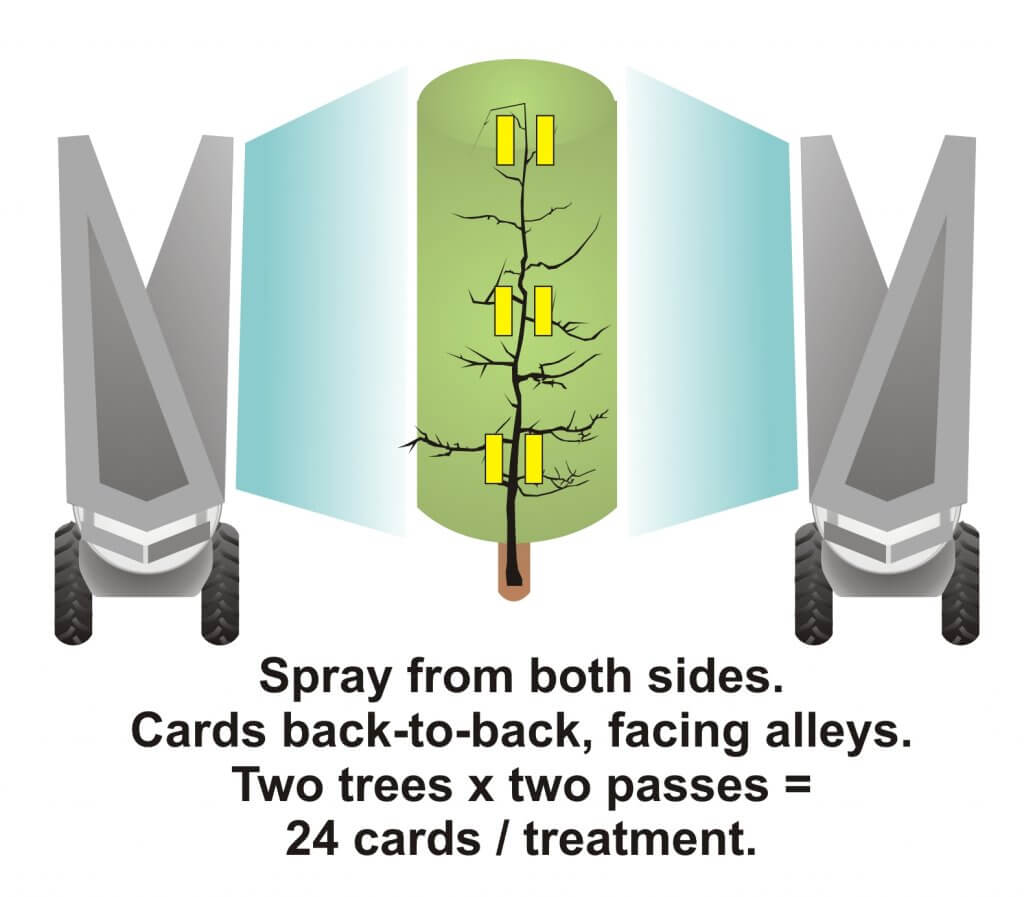
We worked in high-density Honeycrisp apples planted in 2008 on M.26 rootstock. Row spacing was 5 m (16’), average canopy width was 1.2 m (4’) and average height was 3.3 m (11’). Water sensitive cards were located at the top, middle and bottom of each target tree, close to trunk. In each location, the cards were placed back-to-back with sensitive sides facing the alleys.
We placed cards in two trees in the same row, and the sprayer passed down both sides to complete the application. We performed this twice per treatment. That’s four trees per treatment representing a total of 24 cards (comprised of eight per position).
Sprayers
As previously mentioned, we used two models of airblast sprayer. In both designs, nozzle bodies are outside the airstream, causing additional shear as nozzles spray into the air on an angle.
A Hol sprayer with tower operated at 9.6 bar (140 psi) and driven at 5.6 kmh (3.5 mph). The sprayer was calibrated and spray was distributed to match the canopy. Nozzles were TeeJet AITX 8004s and TXR 80015’s spraying 10.2 l/min. (2.7 gpm) per side for a total rate of approximately 500 l/ha (53.5 gpa).
A Turbomist with tower was operated at 11.7 bar (170 psi) and driven at 5.6 kmh (3.5 mph). The sprayer was calibrated and spray was distributed to match the canopy. Nozzles were TeeJet AITX 8004s and TXR 8002’s spraying 10.6 l/min. (2.8 gpm) per side for a total rate of approximately 500 l/ha (53.5 gpa).
Spray mix
Sprayers were filled with water for the control trials, and then dosed with the equivalent of 250 ml per 500 L (8.5 oz in 132 US gal.) of spray mix, per manufacturer’s recommendation. We ensured lines were primed and sprayer was up to speed before spraying.
Analysis
Water sensitive cards were scanned and digitized to compare coverage and median droplet size using DepositScan software (created by Dr. Heping Zhu, USDA ARS, Ohio). Water sensitive cards have a limitation when quantifying average droplet size: once a card exceeds about 30% coverage, too many droplets overlap and their combined profile is wrongly counted as a single droplet. This can skew droplet size analysis.
For the sake of an accurate comparison, we selected subsets of the overall data; we analyzed only those cards with 40% coverage or less, then refined our comparison to those cards with 30% or less, and finally cards with 20% or less. In each subset, the data remained fairly robust because they included at least one card from each canopy position (i.e. top, middle, low) and three from each treatment.
In the following tables, the range of droplet sizes is represented by DV0.1, DV0.5 and DV0.9 in µm. Basically, this is the span of droplet diameters from the smallest 10%, to the median to largest 10% in microns. The standard error of the mean and the number of papers are also indicated.
Data subset 1: Cards with 40% coverage or less
Avg. DV0.1 (µm) ±SEM
Avg. DV0.5 (µm) ±SEM
Avg. DV0.9 (µm) ±SEM
Hol
Adjuvant: 255±33 (n=8) Water: 254±24 (n=12)
Adjuvant: 664±137 (n=8) Water: 736±114 (n=12)
Adjuvant: 1,175±223 (n=8) Water: 1,391±204 (n=12)
Turbomist
Adjuvant: 252±38 (n=8) Water: 258±31 (n=9)
Adjuvant: 545±86 (n=8) Water: 697±141 (n=9)
Adjuvant: 964±168 (n=8) Water: 1,175±237 (n=9)
Data subset 2: Cards with 30% coverage or less
Avg. DV0.1 (µm) ±SEM
Avg. DV0.5 (µm) ±SEM
Avg. DV0.9 (µm) ±SEM
Hol
Adjuvant: 221±30 (n=6) Water: 189±22 (n=6)
Adjuvant: 553±127 (n=6) Water: 495±118 (n=6)
Adjuvant: 1,007±245 (n=6) Water: 969±235 (n=6)
Turbomist
Adjuvant: 240±42 (n=7) Water: 192±22 (n=5)
Adjuvant: 502±86 (n=7) Water: 433±89 (n=5)
Adjuvant: 912±184 (n=7) Water: 759±187 (n=5)
Data subset 3: Cards with 20% coverage or less
Avg. DV0.1 (µm) ±SEM
Avg. DV0.5 (µm) ±SEM
Avg. DV0.9 (µm) ±SEM
Hol
Adjuvant: 163±19 (n=3) Water: 172±28 (n=4)
Adjuvant: 371±107 (n=3) Water: 472±176 (n=4)
Adjuvant: 617±137 (n=3) Water: 904±315 (n=4)
Turbomist
Adjuvant: 240±78 (n=4) Water: 192±22 (n=5
Adjuvant: 439±140 (n=4) Water: 433±89 (n=5)
Adjuvant: 691±189 (n=4) Water: 759±187 (n=5)
Conclusions
In the first subset (i.e. 40% coverage or less) there was no trend to suggest the sprayer model made any difference in coverage. Nor did there appear to be any change in the droplet spectra produced by water or water-plus-adjuvant. In particular, there was no apparent increase in the DV0.1 when adjuvant was used, which we would expect to see if the Finest droplets produced by the nozzle were made Coarser. We hoped that by further subdividing the data to cards with 30% coverage or less, and then 20% coverage or less might resolve some trend, but there were no significant differences to speak of.
These trials are not drift studies, so we cannot say that the adjuvant has or doesn’t have an effect on particle drift. However, according to the water sensitive cards, there is no apparent impact on droplet size or deposition. This suggests that some property of airblast application has reduced or negated the benefit of using the adjuvant. As such, the use of InterLock in an airblast sprayer cannot be recommended. It supports our position that unless an adjuvant has been tested with airblast equipment, you should not assume it will perform as it does in a boom sprayer.
Thanks to Winfield for the educational donation of InterLock, to TeeJet for the nozzles and to Provide Agro for use of the Hol sprayer. Special thanks to Donald Murdoch of the University of Guelph for operating the sprayers.
Sprayer operators recognize the importance of matching their sprayer settings to the crop to optimize efficacy. For example, spraying a protective fungicide in field tomato should require a different approach from spraying a locally systemic insecticide in staked peppers. Knowing this, many operators make ad hoc changes and then wait to “see if it worked”. A process is required that empowers the operator to make systematic changes to their program and assess coverage immediately.
Such a process would require some fundamental understanding of how droplets behave, the location of the target, and the physical structure of the crop. This would be tempered by broader concerns such as weather (e.g. wind, rain and inversions as they affect coverage and spray drift), pest staging, and sprayer capacity (i.e. the sprayer’s ability to cover the crop in the window of time available). Finally, there has to be a mechanism for the operator to make a single change, then assess the impact in a quick, convenient, and yet quantitative manner.
There are always exceptions to a rule, but an operator looking to assess spray coverage might consider the following process:
Understand how the pesticide works. Not only do certain tank mixes and weather conditions affect pesticide efficacy, but the mode of action plays a big role. A contact product must hit the target, while a locally systemic offers more latitude and can withstand less coverage.
Use IPM to determine where the pest is, whether it’s at a stage of development where it is susceptible to the spray, and where the spray needs to be to affect it. For example, if the pest is deep in the canopy, or under a leaf, or in the flower, this is where spray coverage should be targeted and assessed.
Understand droplet behaviour.
Coarser droplets move in straight lines and are prone to runoff (especially on waxy and vertical targets). They rarely provide acceptable canopy penetration in dense, broadleaf canopies and do not give under-leaf or panoramic stem coverage. The Coarser the droplet, the fewer the sprayer produces, reducing droplet density. However, they are not prone to drift and can tolerate higher winds.
Finer droplets slow quickly and tend to move in random directions without some form of entrainment (e.g. air-assist). While they are not prone to runoff, they can get caught up on trichomes (leaf hairs) and may not reach the leaf surface. They provide improved canopy penetration and some under-leaf and panoramic stem coverage, but their lack of momentum leads some operators to use higher pressures to “fog them in”. Higher pressures are generally not advisable because they increase the potential for drift and often result in less spray available to the crop.
Consider the droplets’ point of view. Look along the droplets potential path from nozzle to target. If there’s something in the way, consider re-orienting the nozzle using drop-arms, or a nozzle body that can be adjusted to change the spray direction.
Understand the impact of water volume and travel speed. Higher volumes improve spray coverage by increasing the number of droplets. Slower speeds give more opportunity for spray to penetrate the canopy and reduce the potential for drift, leaving more spray available to cover the crop.
Use water-and-oil sensitive paper to assess spray coverage. The operator should pin or clip papers in the crop, in locations and orientations representing the desired target. Wire flags and flagging tape mark their locations:
Spray using water to establish baseline coverage.
Retrieve the papers and replace them with a new set in the same locations and orientation.
Make one change to the sprayer set-up and determine whether or not coverage was improved.
Continue to tweak the sprayer until coverage is improved. Sometimes, improving spray efficiency means maintaining coverage while using less spray.
Understand how much is enough. Knowing whether to drench the target, or be satisfied with a low droplet density depends on how the pesticide works and whether or not the pest is mobile. As a general rule for foliar insecticides and fungicides, 85 drops per square centimeter and 10-15% surface coverage on 80% of all targets should be sufficient.
Now, a few caveats: Know that under-leaf coverage is VERY difficult to achieve and that improved coverage does not necessarily mean improve efficacy. Further, know that a systematic approach requires time and effort, and should only be performed in weather conditions the operator would spray in.
Read about how a similar process was used to assess coverage in field tomato and in staked pepper. It may take time out of an already busy schedule, but performing this assessment is always worth it.
Before we dive into the details, let’s start with a quick video summary filmed by RealAgriculture at Canada’s Outdoor Farm Show in September, 2016.
When the pressure drops and the nozzles begin to sputter, the sprayer is considered empty. However, it can still retain a lot of spray solution. Repeated rinses or tank dumps in the same location can lead to accumulation and cause point source contamination.
In response to unacceptably high levels of environmental pesticide contamination, the European Union published an amendment to their directive regarding machinery for pesticide application (2009/127/EC). Their intention was to raise the standard of equipment design to reduce the standing volume of spray solution, and to improve cleaning practices. In order to comply, sprayer technology and operator practices would have to change. But the the amendment didn’t specify how, or to what level.
France (2006) and Denmark (2009) legislated that a rinsed sprayer must not have more than 1% or 2%, respectively, of the original tank mix concentration, as sampled at the nozzle. In response, P G Anderson et al. suggested that residual concentrations should be sampled from at least three places on the sprayer. They conducted research (download here) that showed that both field and airblast sprayers can retain 10-15% of the original concentration in the empty/fill valves, boom ends and filters, while rinsate measured 1-2% at the nozzle. They also stated that in order for sprayer designers, operators and authorities to comply with these new rules, someone had to develop a simple but robust method for cleaning sprayers.
Continuous cleaning
In a later paper, the author and his team proposed a method called “Continuous cleaning” (download here), which employs a dedicated clean water pump to push spray solution from the tank and out the boom in the field. For comparison, the traditional triple rinse method employs the main pump to dilute the remaining spray solution with clean water in a series of rinses and sprays. You can learn more about point source contamination and rinsing methods in this clear and informative presentation by P. Balsari and P. Marucco (download here) given in 2015 at the University of Turin in Italy.
The continuous cleaning method isn’t new. In the 1970s some farmers cleaned their sprayers by plumbing a water supply hose into the suction line while spraying out the rinsate. They were on to something, because formal testing in the late 1990s showed that continuous cleaning was more efficient than triple rinsing. Then, from 2005 onward, research by groups such as betterspraying aps, TOPPS, the Julius Kuhn-Institut and AAMS further refined the process for both field and airblast sprayers.
Anderson et al. made compelling claims about the continuous cleaning method. They stated that a 4,000 L sprayer with a 400 L clean water reservoir would require only 100 L to clean the plumbing as effectively as triple rinsing, which would require the entire 400 L. The remaining 300 L could be used to rinse the exterior and the entire process could take place in the field, in rotating locations. Perhaps most intriguing of all was that it would only take five minutes.
But, it is important to note that their rinsate samples came from the nozzles, as required by France and Denmark. The issue of higher concentrations in dead-end plumbing is not addressed.
European adoption
In anticipation of the regulations, some manufacturers were already developing continuous cleaning kits to upgrade sprayers of all makes, models and ages. In Denmark (and to a lesser extent in France and Germany) these kits were used at workshops to upgrade sprayers. But, the installation process was not always straight-forward.
Some kits performed better than others and expertise was needed to match the flow rate, tank rinse nozzles and the pump’s power requirements to the sprayers. Depending on the sprayer’s design, it sometimes required trial and error to establish a process of opening and closing valves during rinsing. Independent testing showed that many sprayers were greatly improved,(download here) but others proved incompatible due to the volume or inaccessibility of residual spray mix remaining in the plumbing. Specific cases include dead-ends on boom sections, or exceptionally long return lines on circulating booms
Defining a fit for North America
In early 2016, we wrote a preliminary article describing what we knew of the method and it created a lot of interest. We decided to test it our for ourselves in a demo at the Canadian Outdoor Farm Show. But before we describe what we did, let’s clarify a few terms. You may have noted that in Europe the process is called “Continuous cleaning” but moving forward we will refer to the method as “Continuous rinsing”. This is because we feel cleaning a sprayer and rinsing a sprayer are different processes with different objectives.
“Cleaning” a sprayer is a total decontamination that should be performed when changing chemicals and at the end of every spray day. It requires the use of a detergent and any label-required additive (such as ammonia following the new dicamba products). Perhaps most importantly, it requires the operator to address the dead-end plumbing areas. There is no universally-accepted process, but we describe fairly common protocols for field sprayers here and for airblast sprayers here.
“Rinsing” is a less intensive process intended to reduce the amount of residue that can build up on, or soak into, sprayer surfaces. Water is brought into contact with most of the plumbing to dilute any solution left in the sprayer, and is then sprayed out in the field. This process should be performed every few loads, or when moving an empty sprayer between fields, or if the operator has (perhaps unwisely) decided not to clean the sprayer at the end of the day because they are spraying the same chemical tomorrow. Often, this is accomplished using the triple rinse process, which we describe here:
Triple Rinse Process
The pressure drops and nozzles sputter (i.e. spray tank is empty).
If the sprayer has an inductor bowl or loading bypass, and if the operator doesn’t already rinse these systems following filling, the operator will exit the cab, open the valve to clean water reservoir, and use a portion of the clean water to clean these circuits. In some cases, the rinse process can be performed without the operator having to leave the cab.
Sprayers with dead end plumbing on boom section ends warrant special consideration. Spray mix can be harboured in the dead ends and is a significant source of contamination, no matter how much rinsing is performed (see video). Therefore, the first rinse (step 5) should be interrupted before it is complete to allow boom ends to be opened, flushed and closed.
The operator then introduces 1/3 of the clean water reservoir to the spray tank through the rinsing nozzle(s) and circulates for 5 minutes (including the agitation line).
The operator returns to cab, and drives to spray the volume out in the field until the nozzles sputter.
Operator exits the cab and introduces 1/3 of the clean water reservoir to the spray tank through the rinsing nozzle(s) and circulates for 5 minutes (including the agitation line).
The operator returns to cab, and drives to spray the volume out in the field until the nozzles sputter.
Operator exits the cab and introduces 1/3 of the clean water reservoir to the spray tank through the rinsing nozzle(s) and circulates for 5 minutes (including the agitation line).
The operator returns to cab, and drives to spray the volume out in the field until the nozzles sputter.
The process, illustrated in this field sprayer plumbing animation, takes about 40 minutes and may require the operator to leave the cab multiple times.
Continuous rinsing requires a second pump to be installed in the system. Rather than performing a serial dilution in three batches, this rinsing essentially pushes spray solution out of the sprayer using clean water. The agitation line creates some dilution since it loops back to the tank, but that small volume is quickly diluted by the process, as below:
Continuous Rinse Process
Pressure drops and nozzles sputter (i.e. spray tank is empty).
If the sprayer has an inductor bowl or loading bypass, and if the operator doesn’t already rinse these systems following filling, the operator will exit the cab, open the valve to clean water reservoir, and use a portion of the clean water to clean these circuits.
There can be no dead-end plumbing at the end of boom sections for this process to work (e.g. sections terminate with air-aspirating end caps).
The operator returns to cab (if they left), and begins introducing clean water to the tank through the rinsing nozzle(s).
When a small volume has been introduced, the operator engages the agitation line with reduced flow to tank and begins driving and spraying at a rate slightly higher than the clean water pump’s flow rate.
Operator continues to spray until the nozzles sputter.
The process, illustrated in this field sprayer plumbing animation, takes about 10 minutes and requires the operator to leave the cab once at most.
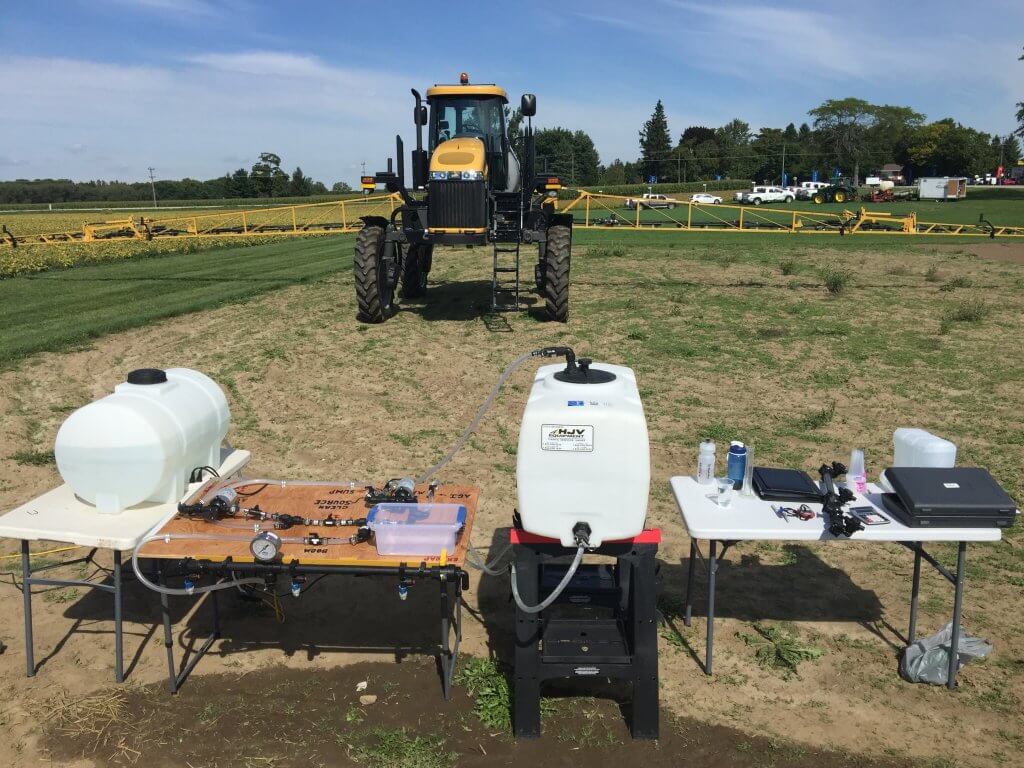
Building a demo system and model
We worked with HJV Equipment in Alliston, Ontario to build a bench-top model representing a simple, scaled-down sprayer rinse system. Using the model, we planned to compare the effectiveness and the efficiency of triple rinsing to continuous rinsing – and we would do so in front of an audience. HJV felt that to make an appropriate model, we should base it on an installed system. So, they plumbed a working system into a RoGator 700.
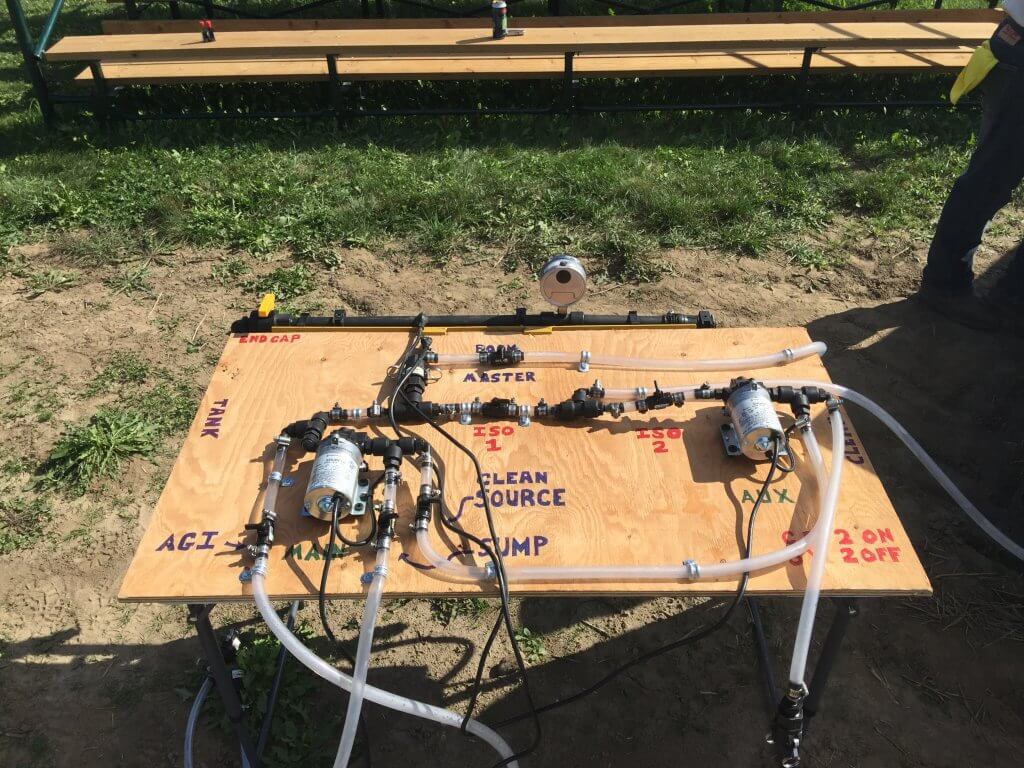
They used two Hypro electric roller pumps (model 4101 N-H) in parallel, plumbed into the clean water reservoir. Anti-backflow valves led the water to the tank rinse nozzles. The system could be engaged from the cab and could be isolated from the existing rinse system, leaving the sprayer’s original system intact and available for when full cleanings were required. The designer/mechanic points out key features in the following video.
The RoGator 700 has a 700 US gallon tank and a 50 US gallon clean water reservoir. By tapping into an existing compressor, HJV created a means for blowing out the boom with air, greatly reducing the amount of spray solution left in the empty sprayer. Still, the “empty” sprayer would retain about 15 US gallons in the pump, sump and remaining lines. Based on those parameters, we designed and constructed our scaled model. We used 10 L in the main tank and 4.5 L in the clean water reservoir. The lines and sump held about 1.25 L so we felt breaking the 4.5 L of clean water into three 1.5 L volumes was fair.
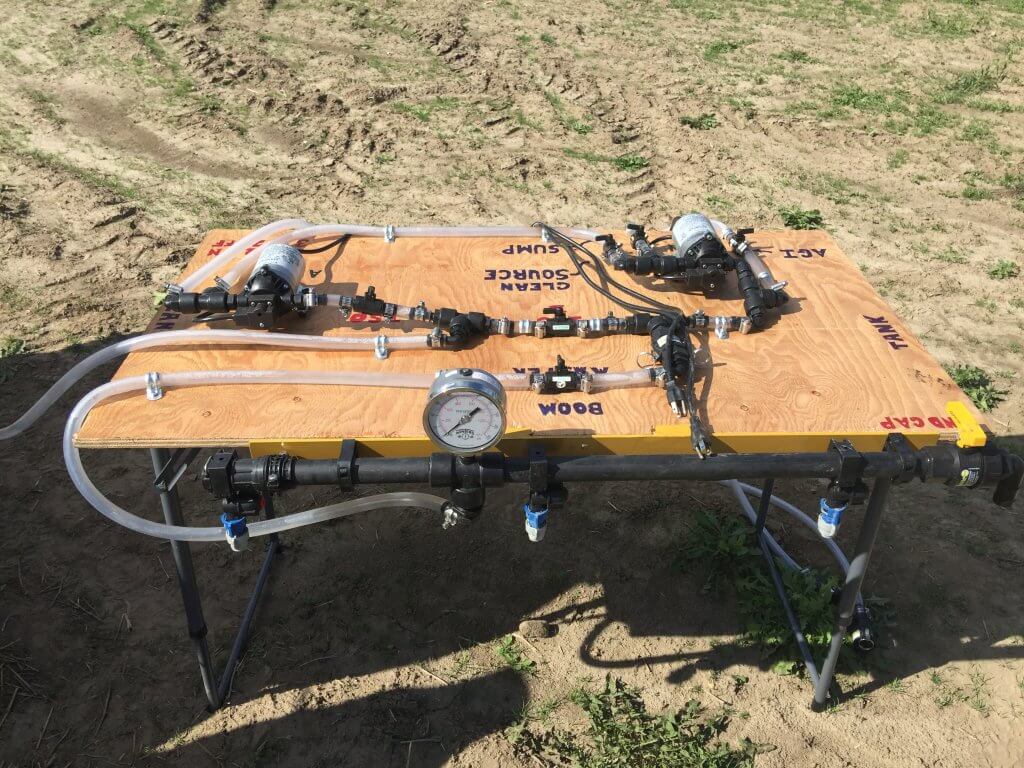
In the images that follow you can see the components. Basically we have a spray tank, clean water reservoir, main pump, dedicated clean water pump, the sprayer boom, and some clever anti-backflow and valves to switch the “sprayer” from one method of rinsing to the next.
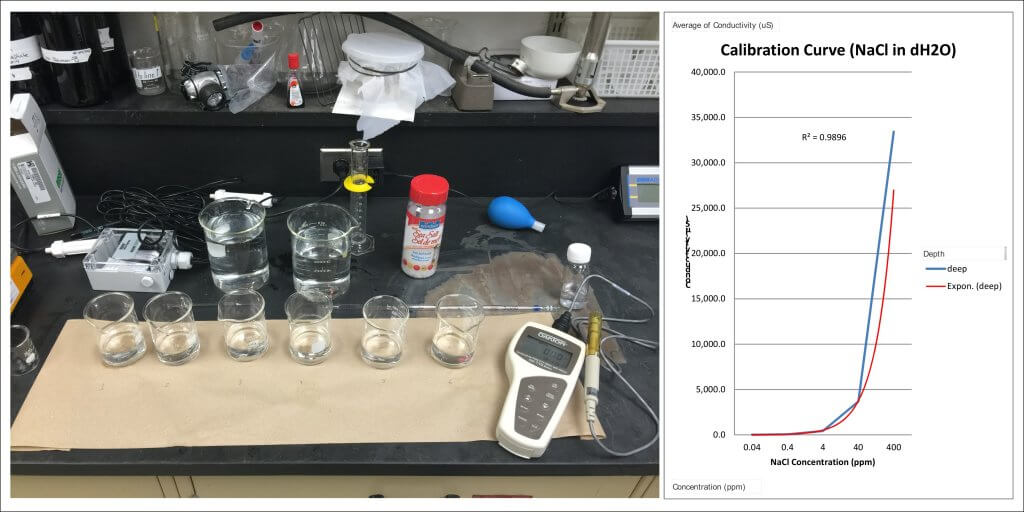
But, we still had to devise a means to measure the effectiveness of the two rinsing systems. UV dye would be difficult to use with a live audience in real time, and food colouring would be too subjective. We decided to use a conductivity meter, which quickly measures the electrical conductivity of a liquid. Using NaCl (table salt) as a readily-dissolved conductor, we calibrated the unit and found we could reliably register table salt in parts per million.
The demo process
We ran the demo six times over three days and recorded how long each rinse took and how effective each rinse was in reducing the original concentration. Here’s how we did it:
Triple Rinse (~4.5 minutes)
Fill the main tank to 10 L.
Introduce 10 cc of salt (and coloured with green food dye) to create our spray mix.
Circulate the solution through the main pump and agitation line to ensure it was completely homogeneous.
Start the system spraying out of the boom.
Draw a sample of the spray mix to serve as our baseline concentration.
When the nozzles began to sputter, the tank was “empty” (duration: 150 seconds).
We drained the boom via valve on the boom-end to simulate “blowing out” the boom. (duration: 5 seconds)
We introduced 1.5 L of clean water through the tank rinse nozzle (duration: 15 seconds).
We circulated the solution through the agitation line. (duration: 30 seconds).
We sprayed the solution out of the boom, drawing a sample of rinsate before the nozzles sputtered (duration: 30 seconds)
Repeat steps 8-10 two more times to represent the other two rinses.
Continuous Rinse (~1.5 minutes)
Fill the main tank to 10 L.
Introduce 10 cc of salt (and coloured with green food dye) to create our spray mix.
Circulate the solution through the main pump and agitation line to ensure it was completely homogeneous.
Start the system spraying out of the boom.
Draw a sample of the spray mix to serve as our baseline concentration.
When the nozzles began to sputter , the tank was “empty” (duration: 150 seconds).
We drained the boom via valve on the boom-end to simulate “blowing out” the boom. (duration: 5 seconds)
We reduced the agitation flow to a low rate and introduced 1.5 L of clean water through the rinse nozzle using our dedicated pump (duration: 5 seconds)
At the 5 second mark, we started spraying while still introducing clean water.
Samples of rinsate were drawn at regular intervals, with particular attention to collect the last volume fraction as the nozzles were sputtering (duration: 100 seconds)
Results
Triple Rinse
The average starting conductivity for the triple rinse demo was 2,520 µS (n=6). The final sample of rinsate registered a conductivity of 490 µS (n=6) representing a final concentration that was 19.4% of the original. Average time: 4.5 minutes.
Continuous Rinse
The average starting conductivity for the continuous rinse demo was 2,145 µS (n=6). The final sample of rinsate registered a conductivity of 342 µS (n=6) representing a final concentration that was 16% of the original. Average time 1.5 minutes.
We were surprised the model could not reduce the concentration of salt to an acceptable 1-2% level. The Agrimetrix Dilution Calculator App suggests it should have been much better. We suspect the standing volume of the system is higher than we predicted, and we weren’t using enough clean water to dilute it. We may have had better results if we’d used a lower concentration of salt to begin with, and/or a higher volume of clean water. We will continue to tweak the demo model and will update this article as we collect more information. The more stringent research in Europe showed that continuous rinsing is a effective as triple rinsing.
The most interesting result is that continuous rinsing took 1/3 of the time triple rinsing required (1.5 minutes versus 4.5 minutes). Research in Europe suggested 1/4 of the time as triple rinsing. The difference is likely accounted for by the time the operator used leaving and entering the cab.
You can see the effectiveness of the process in this AAMS demonstration video. Sure, their demo unit is nicer than the one we built, but our rustic version has charm 🙂 Note the sequence of opening and closing valves to ensure all circuits are rinsed clear of dye.
Conclusion
If continuous rinsing is as effective as triple rinsing and can be performed in a fraction of the time with less operator exposure, then we should be modifying our sprayers to support the method. Airblast sprayers and small field sprayers are relatively easy to modify, and can be even be equipped with a spray wand so excess clean can be employed to rinse down the exterior.
Larger field sprayers, however, may be more challenging as they do not all lend themselves to the conversion:
The clean water pump (hydraulic or electric) must have sufficient power.
Matching the pump capacity to the sprayer can be problematic; The clean water pump flow rate must be 30-50% of the boom flow rate.
Sprayers with dead-end boom sections or circulating-flow return lines may not be compatible, and those with pneumatic systems to clear the boom of solution are preferred.
More sophisticated electronic rate controller systems (e.g. on the larger self-propelled sprayers) may not be compatible.
And, of course, we must remember that neither triple or continuous rinsing should be seen as a replacement for the sprayer cleaning process. Any drain-able part of the sprayer will still harbour high concentrations of residues (e.g. filters, valves, inductors, bypass lines – any dead-end plumbing). With new stacked chemistries being introduced in North America (some still active when residues register as little as a few parts per million), diligent sprayer sanitation is more important than ever.
Thanks to Jan Langenakens of aams for his help researching and informing this article.
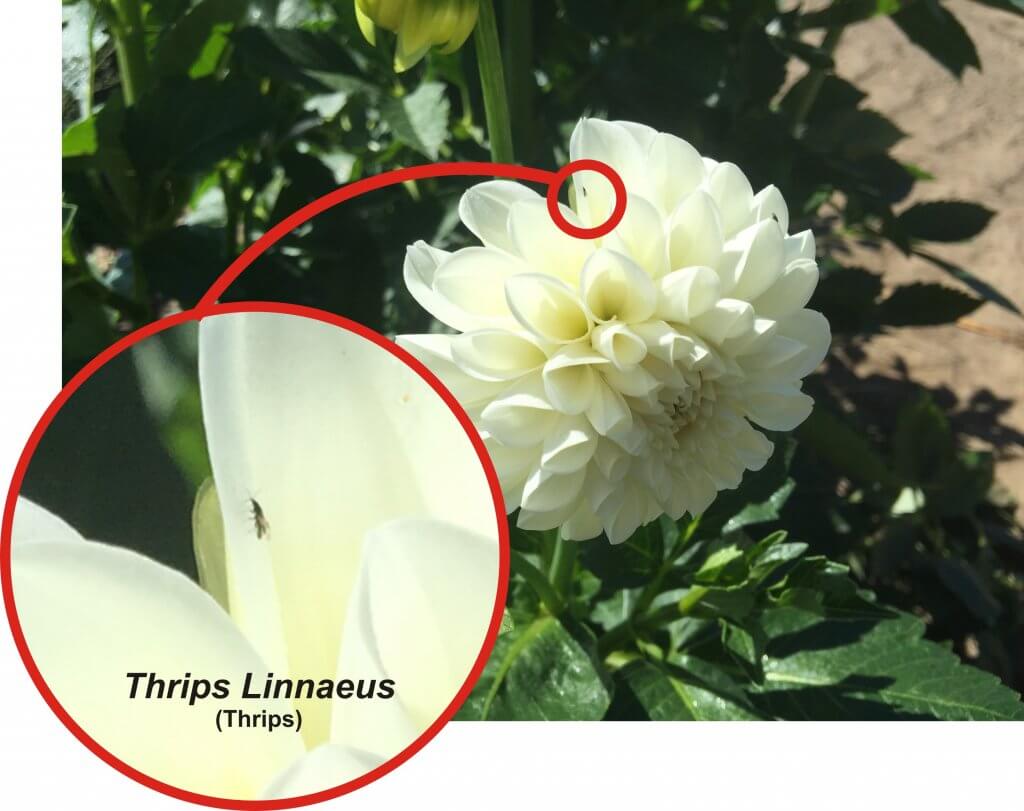
In August, 2016, we were contacted by a cut-flower grower specializing in Dahlias. There are photos in this article, but they don’t do justice to this beautiful perennial flower. Imagine a chrysanthemum crossed with a zinnia: lots of tight petals in the bloom. Unfortunately, they’re a perfect place for insects to hide.
Those that buy cut flowers may be some of the most discerning clients in horticulture. A scar on an apple may or may not cause the buyer to reject the fruit, but imagine leaning in to smell a beautiful white bloom only to see a black bug crawl out of it! For many, the revulsion is the equivalent of finding a hair in their food.
The challenge
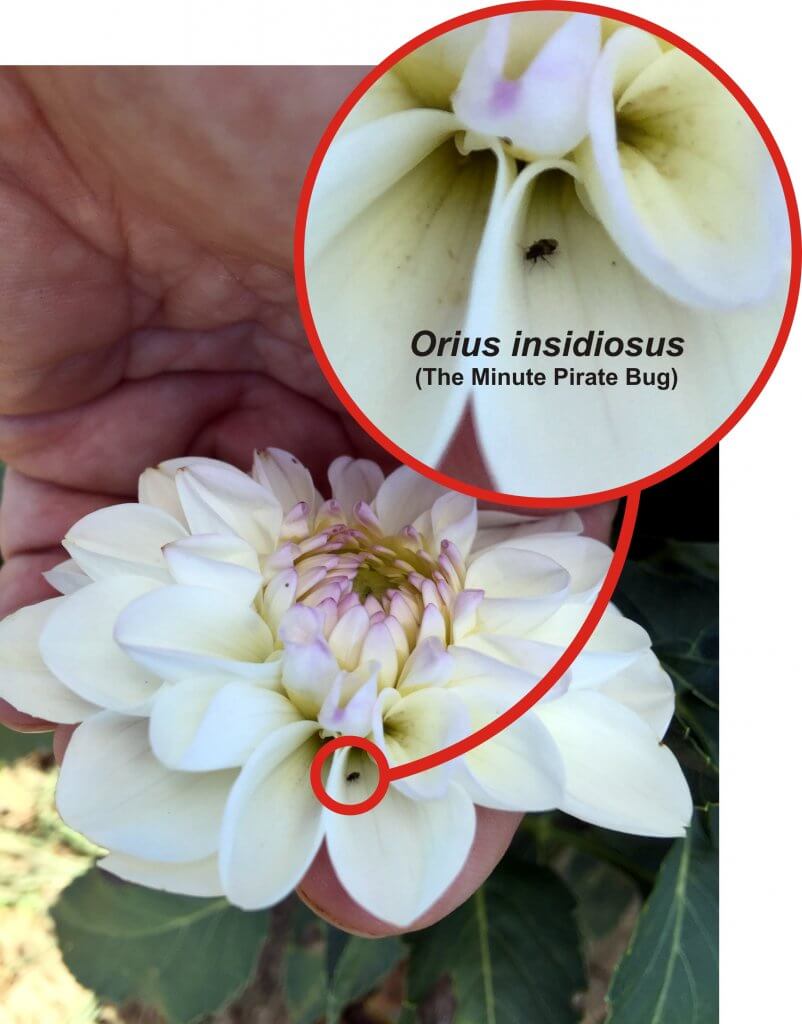
According to the grower, the 2016 season has been very bad for Thrips, which could easily exceed five per bloom even after spraying. The grower had the insect identified as “Western Flower Thrips” which, in Ontario’s greenhouses, are demonstrating resistance to chemical control. With such high insect density comes natural predators, such as Orius (the Minute Pirate Bug). While it does an admirable job hunting thrips, it must also be controlled because to the buyer it is just another undesirable black bug. Getting the contact spray in between all those petals is exceedingly difficult. The grower wanted to know how he could improve spray coverage deep in the bloom itself. So, we had a discussion.
The ideas
Adjuvants
Our first thought was an adjuvant. Wetting agents have been helpful for controlling thrips in other crops, such as those located deep in green onions in Ontario. We consulted the grower’s insecticide labels looking for possible incompatibilities. We found they had the potential to damage tender foliage if applied in periods of high humidity or high heat (i.e. > 25 °C). They also noted that the use of an adjuvant may increase the potential for damage. The grower confessed that he had already experimented with a non-ionic spreader and saw damage to the blooms. So, a water-conditioning option to improve spread was off the table.
Volume and travel speed
Our next idea was to increase the volume being applied per hectare. This strategy is a safe bet for improving coverage because it increases the number of droplets available for contact. There are a few ways to achieve higher volumes, but we elected to drive slower, which has the added advantage of reducing drift.
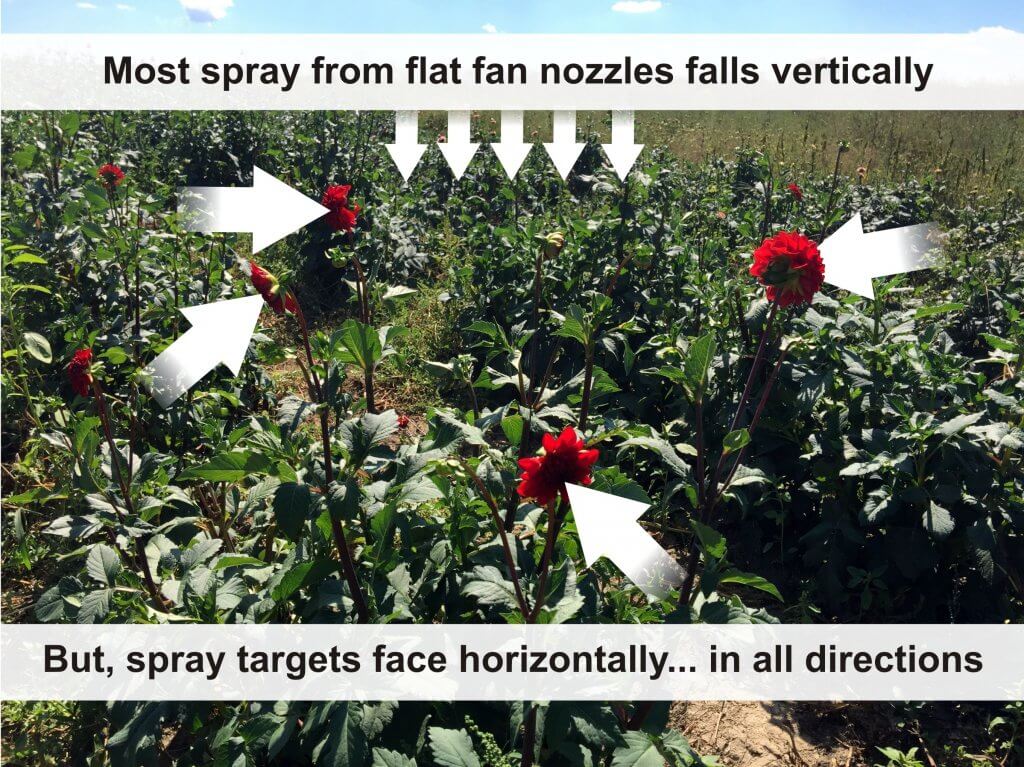
Spray angle
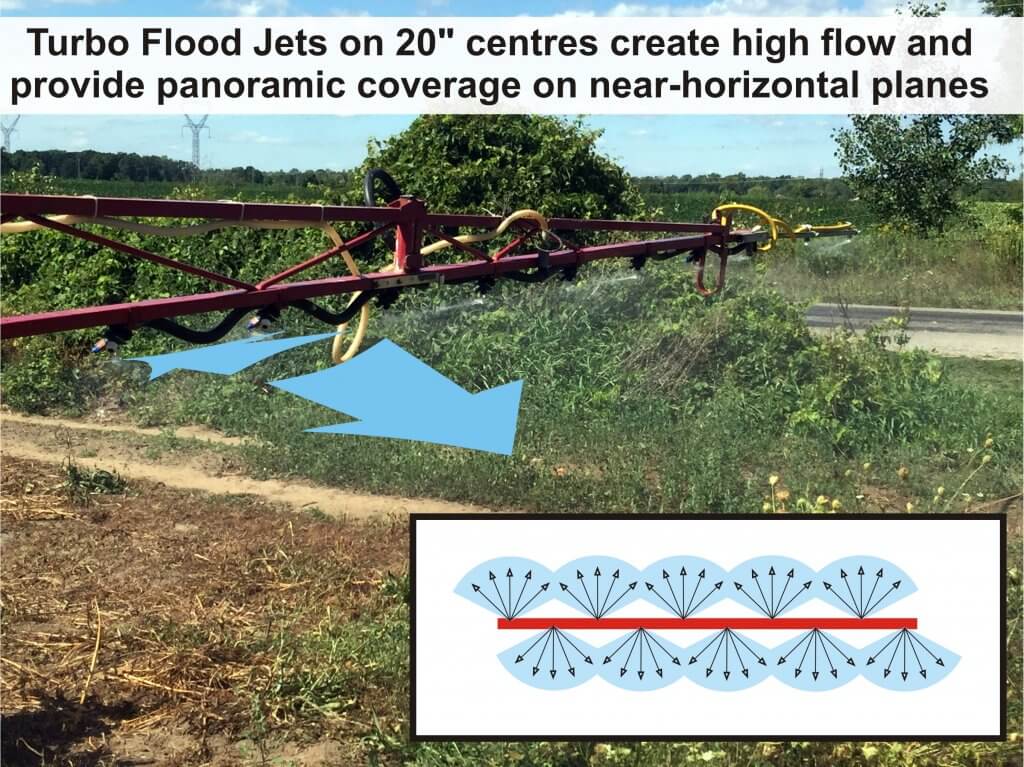
We also talked about spray angle. Dahlia blooms face horizontally in all directions, not vertically (i.e. side-ways, not straight up). Consider the spray from the nozzle’s point of view: The spray from the grower’s flat fans would fall predominantly downward. Theoretically, most of it would settle on the upper edges of the flower. We wondered if we could use an angled spray to hit the blooms face-on and improve penetration into the bloom.
We felt twin fans and asymmetrical fans weren’t an aggressive enough angle, and they didn’t address the fact that the flowers faced in all directions. So, in order to get panoramic coverage on a near-horizontal plane, we decided to try alternating (one back, one forward) TeeJet Turbo FloodJets. They have been used to great effect by the University of Guelph’s Dr. David Hooker to provide panoramic coverage to wheat heads, so perhaps they would help here.
To prove the principle, we decided to run a short qualitative trial to see if there was a difference.
Nozzles
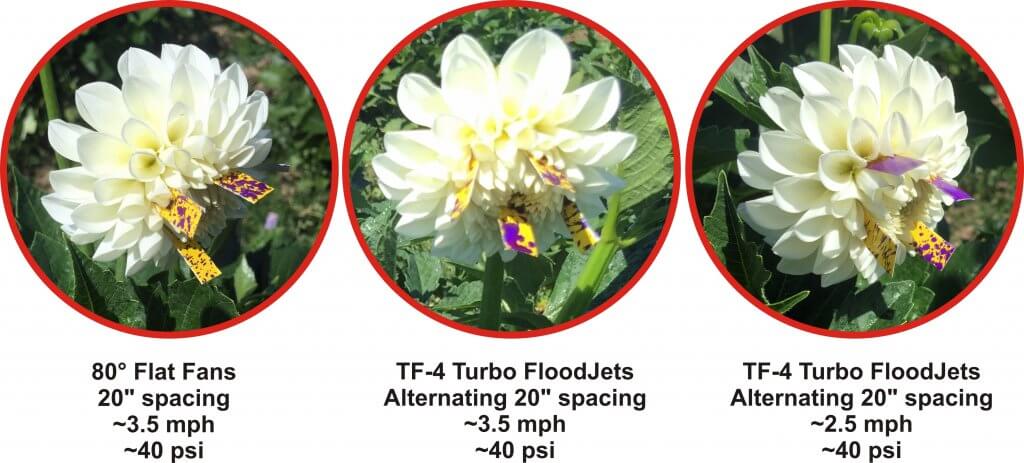
In the video below you can see how we nozzled the sprayer. We kept the left wing of the boom in the grower’s configuration: conventional 8004 flat fans (red) operated at 40 psi on 20” centres. That was a Medium spray quality and 0.4 US gallons per minute. On the other wing (right) we used TF04’s (white) operated at 40 psi on 20” centres. That was an Extremely Coarse spray quality and 0.8 US gallons per minute.
Coverage and Efficacy
We cut water-sensitive paper into strips and slotted them into the blooms. By orienting them in multiple directions we hoped get a visual indication of bloom coverage. Plus, when they were extracted after spraying we could see how deeply the spray penetrated the bloom.
We ran a pass using water at the grower’s typical speed of 3.5 mph, but when we didn’t see a big difference on the papers, we slowed to 2.5 mph. That’s 47.5 US gallons per acre (~500 L/ha) from the flat fans (left) and 95 US gallons per acre (~100, L/ha) on the right. A few typical results are shown below.
We weren’t sure if we were seeing an appreciable difference in bloom coverage, but it looked promising. In retrospect, they may have been more effective indicators if we’d oriented a few flat against the bloom face. We decided to use the nozzle arrangement for a few insecticide applications and see if there was a difference in efficacy.
The grower sprayed in the evening and returned the next morning to perform counts in 20 random blooms from each treatment. Normally, a scout looking for thrips would tap the bloom over a piece of white paper to do counts, but the grower’s method was to blow into the bloom. He said Thrips and orius climb out to the edges of the petals immediately and can be counted. We sprayed in the white Dahlia to make the counts easier. We did this twice. The counts were less than spectacular and we were disappointed:
1st application: Turbo FloodJets: 16 orius and 31 thrips in 20 blooms Conventional flat fans: 10 orius and 21 thrips in 20 blooms
2nd application: Turbo FloodJets: 2 Orius and 1 thrip in 20 blooms Conventional flat fans: 2 Orius and 3 thrip in 20 blooms
Conclusion and next steps
The grower reported that even though we raised the volumes by slowing down, the efficacy from his flat fans had not improved compared to what he was doing previously. Adding insult to injury, the Turbo FloodJets (which were spraying twice the volume as the flat fans) did not seem to improve matters. Before we could try another approach, the insect pressure fell and the season drew to a close. You might wonder why we’d publish an article that didn’t pan out. It’s because you can learn as much from what doesn’t work as what does
So why didn’t we see improvement? Perhaps the boom was too high and the spray from FloodJets fell vertically. Perhaps the spray quality from the FloodJets was too coarse. Perhaps the grower’s method for counting insects was biased or inaccurate. It’s all speculation. As we pointed out earlier in this article, this hardly constitutes a formal experiment. We were hoping to see some indication of improvement before designing a more intense study. We didn’t see one.
We hoped to try again between June and August, when thrips and orius counts are highest. Our plan was to use drop-hoses to suspend nozzles at bloom-height and to use a double nozzle body to mount two back-to-back full-cone nozzles in each position. They would alternate 180° along the boom aiming in front-to-back and left-to-right orientations to provide panoramic coverage using a Medium spray quality. And, finally, we would have engaged a scout in a blind study to eliminate bias and increase our sample size.
Unfortunately the study didn’t take place – any takers?
Thanks to the grower co-operator, and TeeJet Technologies for providing the water-sensitive paper and nozzles for the study.