Tag: drift

  • Spray Drift Basics

    Spray Drift Basics

    This article is intended as a basic overview of what pesticide spray drift is and how to avoid it. If you want a more in-depth study of the physics of drift, head over here.

    Defining Drift

    Pesticide spray drift is the aerial movement, and unintentional deposit, of pesticide outside the target area. Aside from being illegal, there are a lot of compelling reasons for avoiding it. Drift can be measured in financial loss associated with wasted pesticide, wasted time and reduced crop quality/quantity. Plus, if an application is unsuccessful, the operator may have to re-apply, incurring further cost. Pesticide drift increases any risk of damage to human health, susceptible plants (e.g. adjacent crops), non-target organisms (e.g. wild and domestic animals, pollinating insects, etc.), the environment, and property.

    We’ll limit our definitions to two forms of pesticide spray drift: Particle Drift and Vapour Drift.

    Physical Drift is the initial off-target movement of pesticide droplets. This occurs at the time of application, and it is generally on a scale of tens-of-metres. There is a secondary component to physical drift wherein particularly small droplets (or the evaporated remains of droplets) stay aloft for longer periods of time, during which they can move laterally with wind or vertically with thermals and turbulence.

    Vapour Drift is the off-target movement of pesticide vapours. This is a function of product chemistry (vapour pressure) and surface temperature. Rainfall (rewetting) can also affect vapour loss. If vapour gets caught up in a light breeze, moves downhill during a thermal inversion, or is redistributed in precipitation, movement is can be on a scale of kilometres.

    Managing Drift

    Drift cannot be entirely eliminated, but sprayer operators can greatly reduce the degree and impact. Much of what follows relates predominantly to particle drift from horizontal boom sprayers, but it’s never wrong to follow these best practices. Research and modeling have shown that the three biggest factors under the operator’s control are:

    • Apparent wind speed (i.e. the sum of wind speed and travel speed)
    • Boom height (i.e. release height)
    • Droplet size (i.e. nozzle spray quality)

    Therefore, the degree and impact of drift can be greatly reduced by following these guidelines:

    • Reduce the distance between nozzle and target. For a herbicide application, that means lowering the boom to the lowest practicable height. There are exceptions, but a good rule of thumb is that the boom height should be approximately the same as the nozzle spacing.
    • Use the coarsest effective droplet size, generally achieved through the use of drift reducing nozzles such as air induction.
    • Work with the weather.  Labels will specify appropriate weather conditions for spraying. Change sprayer settings to account for hot, dry and windy conditions or halt the job until conditions improve. Generally, avoid spraying when the weather is against you.
    • Identify any vulnerable nearby crop, landscape or environmental area. Choose a spray day when winds are blowing away from these sites. Explore voluntary watchdog sites like DriftWatch to see if there are registered sensitive crops nearby. Planting windbreaks or utilizing riparian areas can also help manage wind and provide localized downwind protection.
    • Observe labelled buffer zones and recommended sprayer settings. In Canada, using optimal sprayer settings in the right environmental conditions may reward the sprayer operator with buffer-zone reductions.
    • Work with your neighbours.  Let them know your intentions. For example, greenhouse growers need to be notified to close vents during morning spray times to avoid any possibility of drift.
    • Understand the potential damage off-target herbicides can cause and make this part of your planning when selecting a herbicide. Where possible, choose herbicides with a low risk of volatility. Avoid products like dicamba near susceptible crops (grapes, tomatoes, peppers, sweet potato, tobacco, IP soybeans, etc.) or greenhouses. While not necessarily volatile, other synthetic auxins such as 2,4-D are extremely damaging to horticultural crops at very, very low doses.
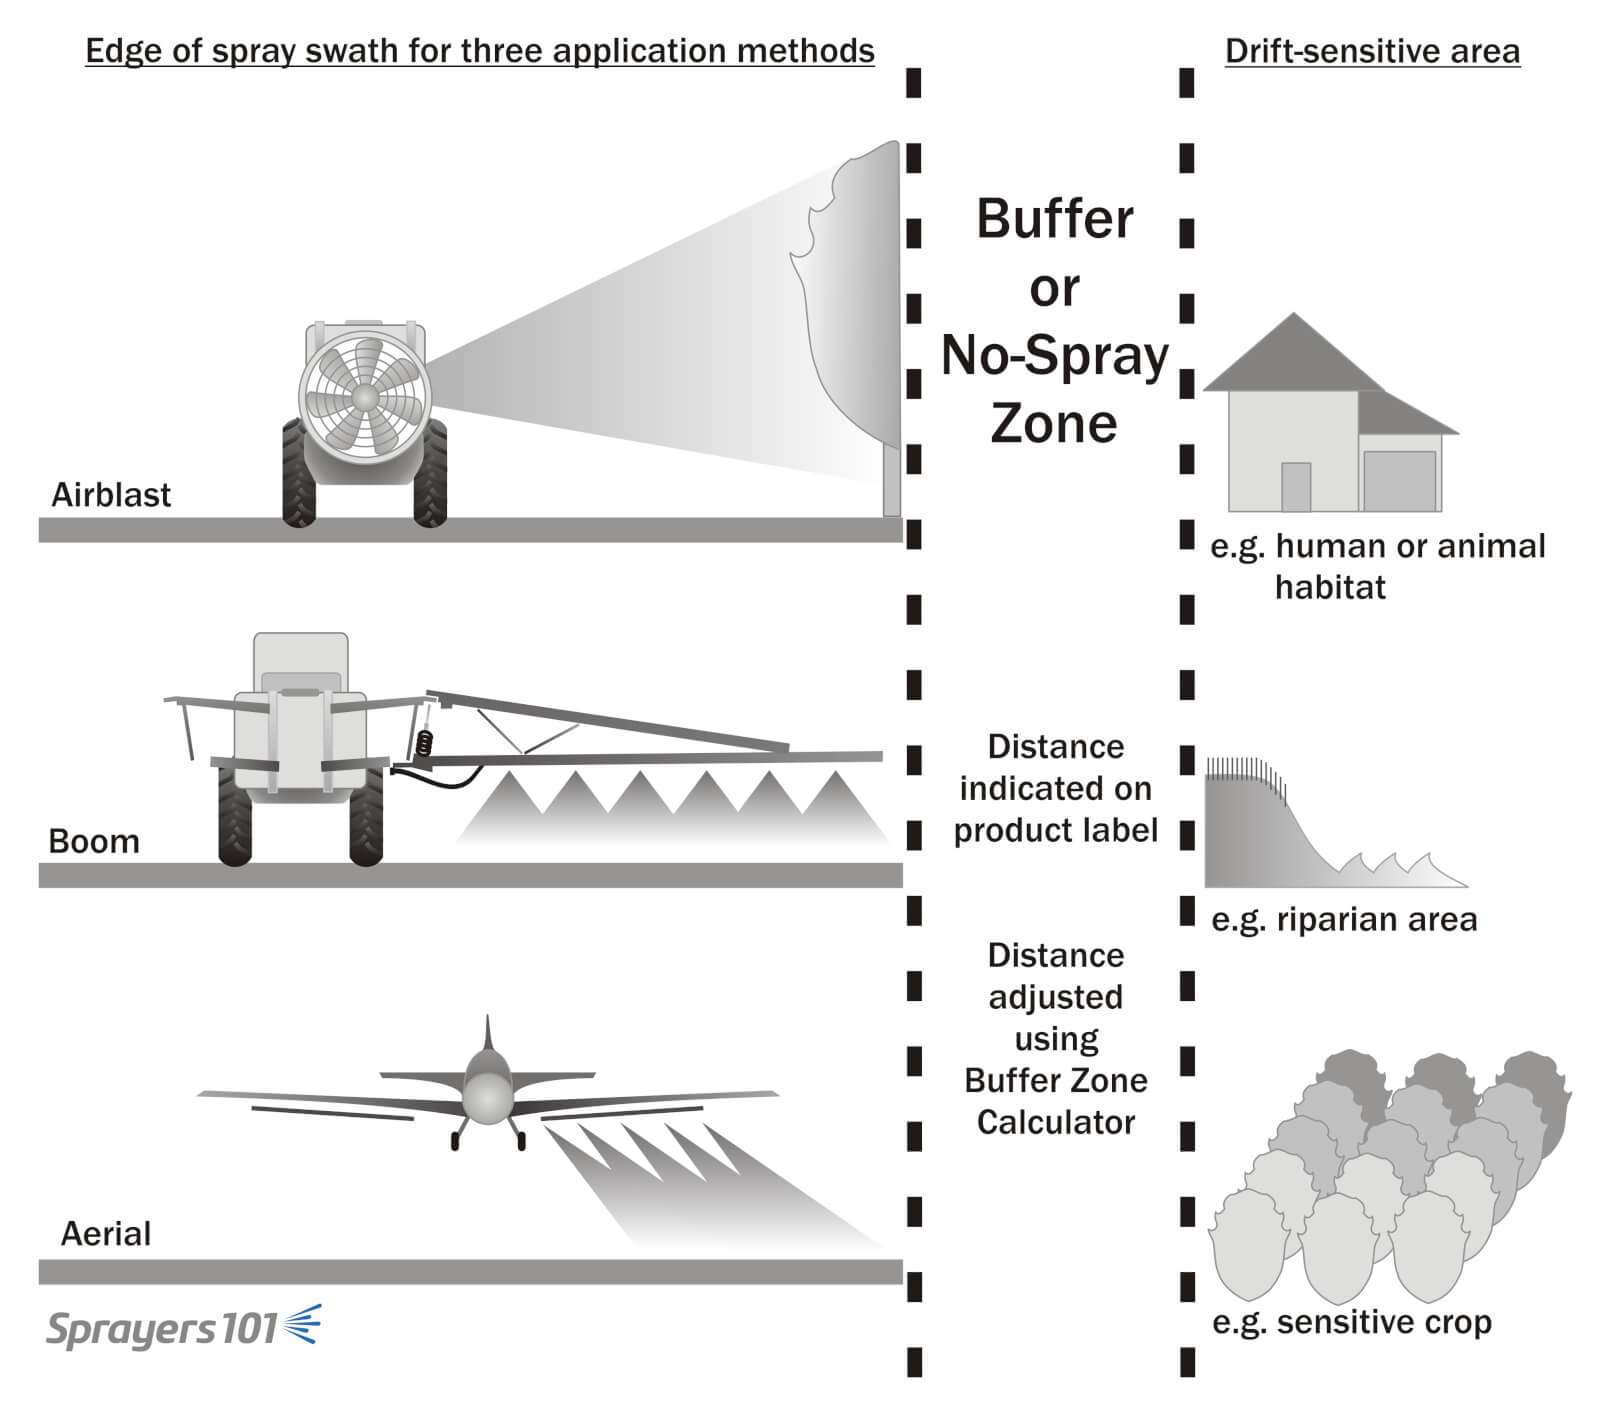
    Buffer zones or No-Spray zones physically separate the end of the spray swath for the nearest downwind sensitive area.
    Buffer zones or No-Spray zones physically separate the end of the spray swath for the nearest downwind sensitive area.
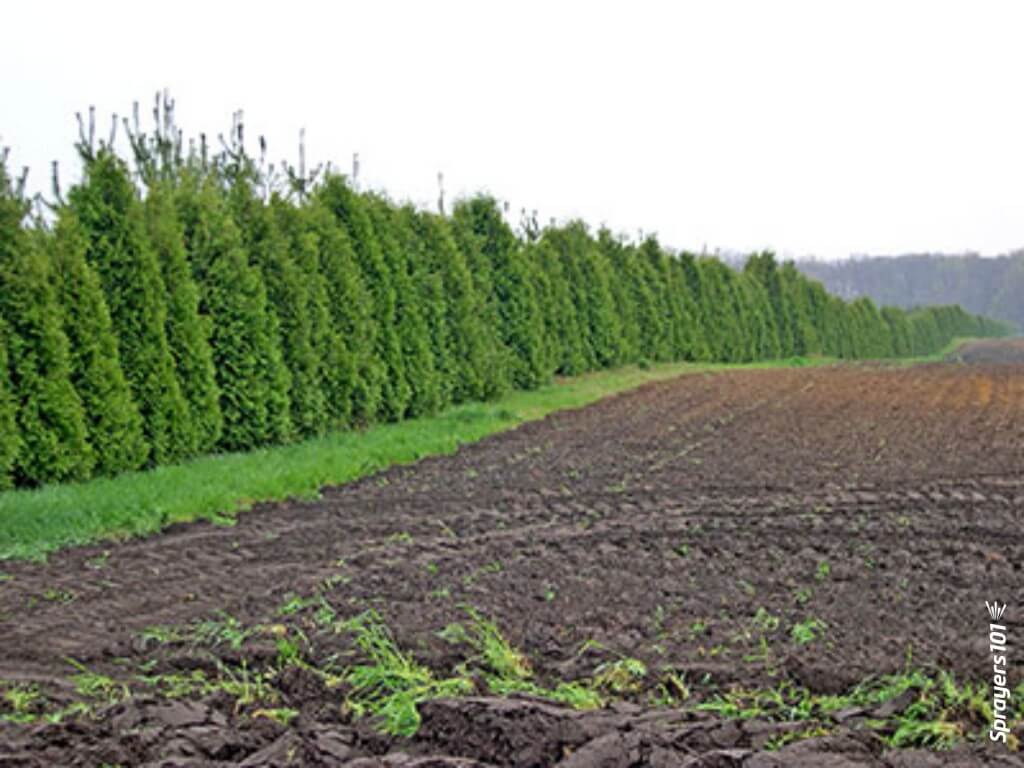
    Consider planting windbreaks between your operation and sensitive downwind areas. Be aware that the windbreak should filter pesticide-laden air, not block it completely (~50 % porosity). Also be aware that there are potential impacts to nearby crop rows, such as creating shade as well as cool, still air conditions. Contact your local Nature Conservancy to discuss the right plants and management plan for you.
    Consider planting windbreaks between your operation and sensitive downwind areas. Be aware that the windbreak should slow and filter pesticide-laden air, not block it completely (~50 % porosity). Also be aware that there are potential impacts to nearby crop rows, such as creating shade as well as cool, still air conditions. Contact your local Nature Conservancy to discuss the right plants and management plan for you.

    Running an Airblast Sprayer?

    For airblast sprayer operators, the environmental factors that affect drift are the same, but the rules for optimizing sprayer settings are slightly different. Droplet size is less of an issue, and in some cases droplet size cannot be controlled. Air settings are the primary tool for reducing drift potential.

    • Adjust fan settings to produce the minimal effective air speed throughout the season.
    • Use deflectors to channel air into, not over or under, the target.
    • If possible, increase droplet size by using air induction nozzles or disc & core (or disc & whirl) nozzles that produce a coarser droplet size. Depending on canopy size, you could use them in every nozzle position, or only in highest nozzle positions.
    • Any sprayer design the brings nozzles closer to the crop (e.g. tower or wrap-around designs) will reduce drift.
    • Canopy sensors that turn boom sections on and off to match the size and shape of the canopy will reduce drift.
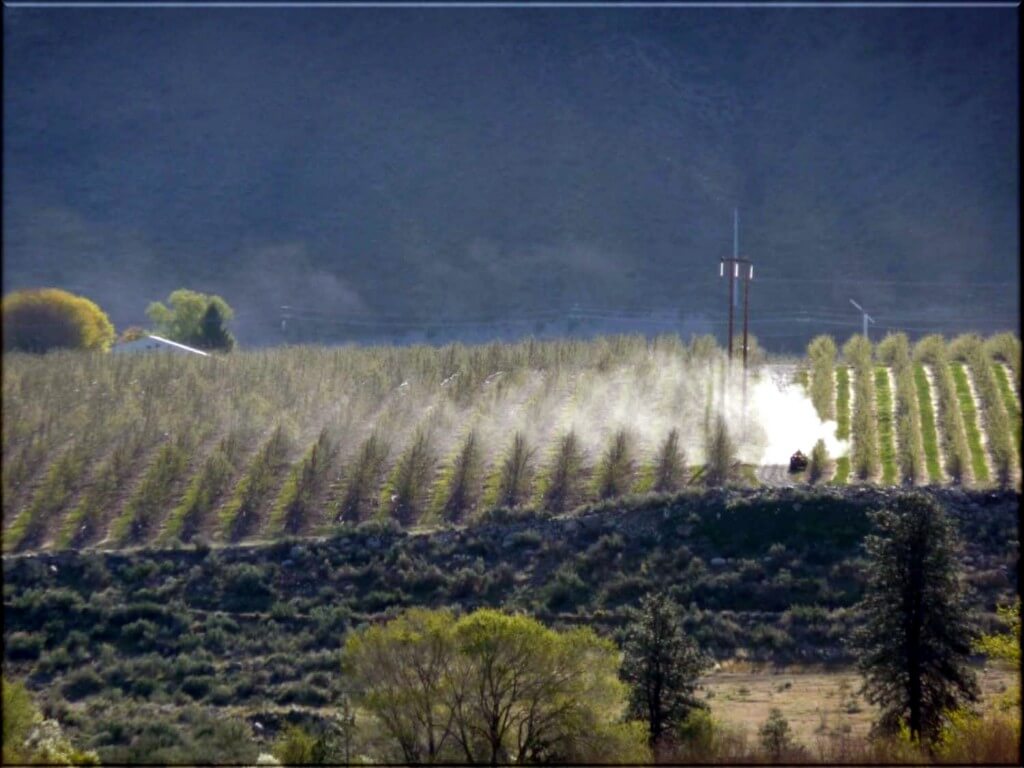
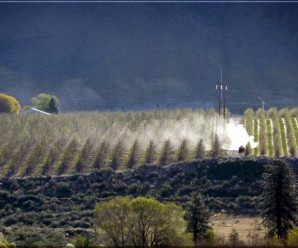
    It’s not only field sprayers that drift. Photo Credit – G. Amos and D. Zamora, Washington State.
    It’s not only field sprayers that drift. Photo Credit – G. Amos and D. Zamora, Washington State.
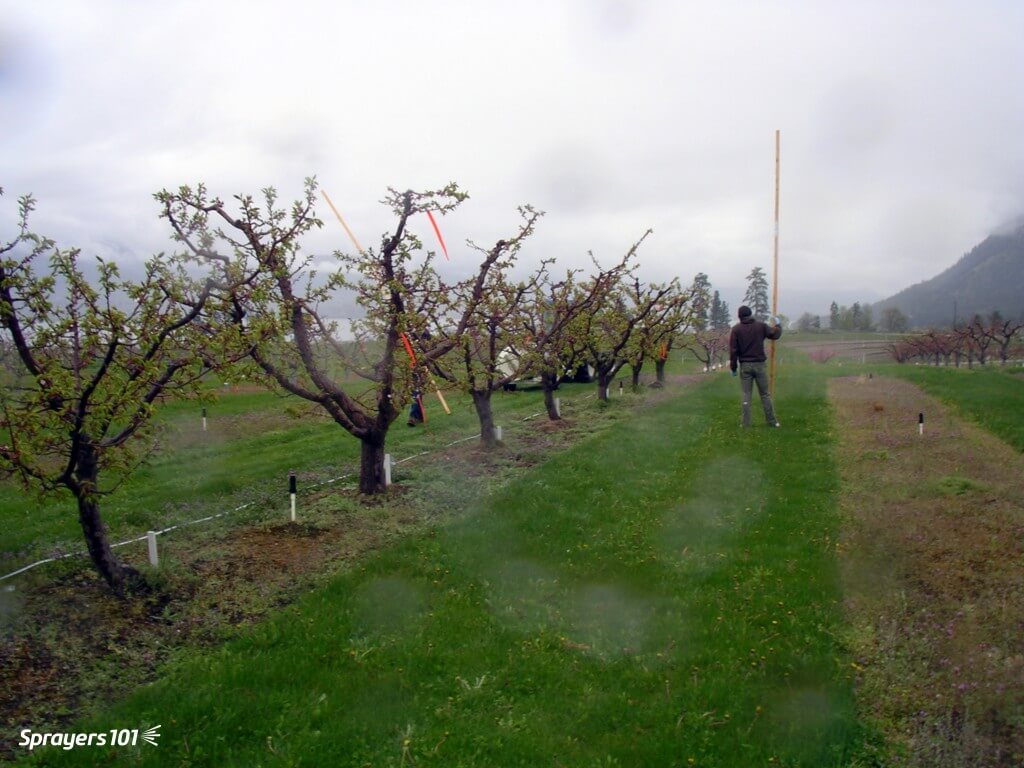
    Monitoring airblast drift using a tall pole with water-sensitive papers stapled along the length. This trial was run using only water so as not to expose the person holding the pole. Photo Credit – M. Waring, British Columbia.
    Monitoring airblast drift with ribbons and a tall pole with water-sensitive papers stapled along the length. This trial was run using only water so as not to expose the person holding the pole. Photo Credit – M. Waring, British Columbia.

    If You Suspect Drift

    If you suspect your crops or property have been damaged by pesticide drift, follow these steps (The contact info is specific to Ontario, so substitute your local authorities). The following information is based on this article in ONFruit which focuses on herbicide drift. Drift onto an organic operation would not necessarily cause visual injury, but steps are similar.

    1. Diagnose the problem

    • Is there evidence of a spray application (agricultural or vegetative management such as roadside spraying)?  Look for wheel tracks, weed symptoms, boom patterns and overlap on the headlands. Look for spray evidence in neighbouring fields, lawns, ditches, etc.
    • Familiarize yourself with the symptoms of drift injury on your crops.
    • Eliminate other possible causes. Disease, insects, nutrient deficiency, herbicide carryover, improper sprayer cleanout, and environmental stress can resemble drift injury.
    • Are there damage patterns? In the case of physical drift, damage is more pronounced on the upwind side of the damaged area, tapering away with distance from the source. In the case of vapour drift, damage can be uniform throughout damaged area and not necessarily downwind from the source. Pesticides can also move in cold air drainage and in surface run-off from rain events. If damage is patchy, it may be something else, such as soil pH or carryover (look where sprayer starts and stops).

    2. Contact the appropriate people

    • Talk to your neighbour or the sprayer operator. Ask what was sprayed, when it was applied and who performed the application.
    • Contact the Ministry of the Environment, Conservation and Parks District Office or Spills Action Center (SAC): 1-866-663-8477. The SAC is available 24/7 and they will then contact the appropriate Environmental Officer and pesticide specialist in your region. Local MECP offices can be found here.
      • It is extremely important to report as soon as possible because the concentration of herbicide drops quickly within the plant.  Do NOT wait until there are symptoms. Do NOT hesitate to call, even if you are unsure if it’s pesticide drift.
    • MECP officers can do a site visit, take samples of tissue and soil, and have them analyzed for suspect pesticides. Where appropriate, the offending applicator may face charges under Ontario’s Pesticides Act. Charges will be pursued only if off label use is identified from the information gathered.
      • Because of the wording of some of the labels and the difficulty of tracking down all the information needed, this has always been a very difficult thing to pursue in grower-to-grower drift incidents. 
      • The results from the MECP lab are available for the grower and, if enough information is collected, the grower is encouraged to pursue civil court if insurance and/or cooperation with the applicator does not work. According to the label of most pest control products, the applicator is liable for any damage caused by the misapplication of a pesticide.
    • Contact your (crop) insurance adjustor and advise the applicator to contact theirs. However, do not rely on your crop insurance; Insurance companies may not provide coverage for drift incidents. It is prudent to determine if you are covered before you need to file a claim.
    • Report the incident to the PMRA Voluntary incident reporting system
    • Report the incident to the manufacturer of the pesticide product. See the label for the toll-free number. Labels can be found on the PMRA label search.

    3. Document all details of the problem and consider lab analysis

    • Collect spray records. This includes yours (to ensure it was not your application), and the potential offending applicators’.
    • Collect weather records (temperatures, possible temperature inversions, wind speed, wind direction, rainfall) for the date of application).
    • Take timestamped, geolocated photos (most smartphones include this information automatically, but check your settings). Repeat photos several times through the season.
    • Document yield loss from the damaged area and an undamaged area. Choose a similar planting (same age, cultivar, rootstock, etc.). For perennial crops (e.g. vineyards, orchards, asparagus, berries) herbicides such as Group 4’s may necessitate documenting the effects for several years after the damage occurred.
    • Laboratory analyses of herbicide levels in plant tissue are often necessary to confirm the presence of herbicides, although symptoms may be helpful in diagnosing which herbicides caused the problem.
      • Research laboratories that will analyze crop samples for herbicide residues. Their requirements regarding sample size, labeling, storage, and shipping will vary, as will the list of pesticides they provide testing for and their minimal detection levels. Given the time-sensitive nature of pesticide detection, it would be prudent to know this information before need the service.

    Applicator Liability

    Anyone using pesticides is responsible for their safe application. For example, the Ontario Pesticides Act requires that licensed spray applicators carry a specialized liability insurance policy that provides appropriate coverage for their business. Operators who work on a “for hire” basis (e.g. a licensed spray applicator) or away from their own farm operation will need additional coverage. Where drift damages adjacent crops, insurance adjustors generally ask the following questions:

    • Was the damage to the applicator’s own crop? If so, it is unlikely that there will be coverage under any insurance policy.
    • Was the damage to a neighbour’s property? If so, the applicator’s liability policy may respond.
    • Was the product being applied according to label directions?

    Other Resources

    Managing spray drift is everyone’s responsibility. Extremely low, and often invisible, amounts of spray drift can be very damaging; even long after the application. For more information about drift mitigation, watch the following videos and download a copy of this Factsheet

    What is Pesticide Drift?- Ontario Ministry of Agriculture and Food and Ministry of Rural Affairs (2011)

    Equipment and Methods to Reduce Pesticide Drift- Ontario Ministry of Agriculture and Food and Ministry of Rural Affairs (2011)

    Preventing Pesticide Spray Drift- University of Missouri Extension (2013)

    Three simple ways to reduce drift. Thanks to Real Agriculture for filming and editing! (2014)

    Three simple ways to reduce drift. Thanks to Real Agriculture for filming and editing! (2014)

  • Herbicides in Asparagus – A creative solution

    Herbicides in Asparagus – A creative solution

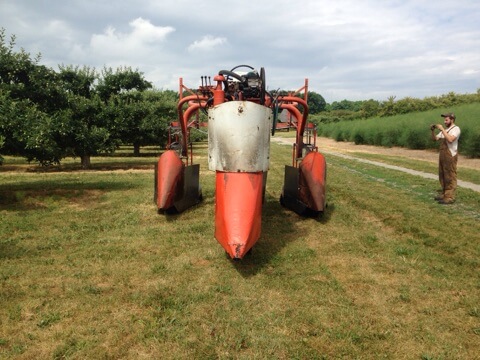
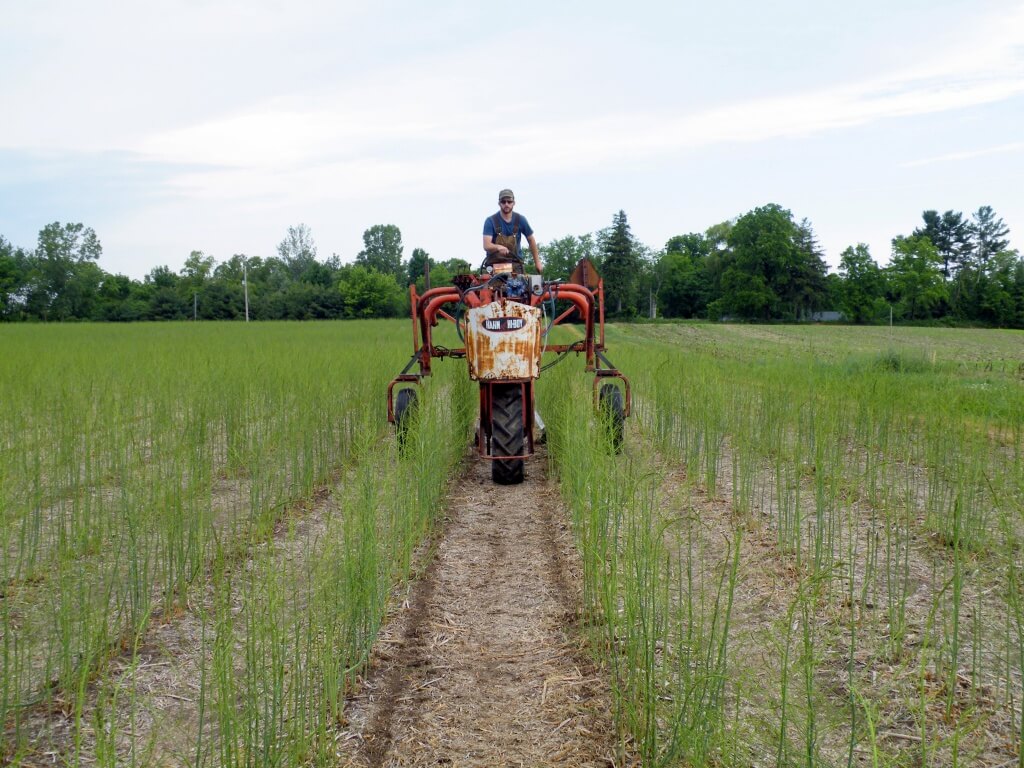
    In 2016, an asparagus grower in southern Ontario picked up a used De Cloet Hi-Boy originally used to spray tobacco. His vision was to create a three-row herbicide sprayer for asparagus and we were invited to participate. His concept was to design shrouds that would contain the herbicide, but not snag the asparagus or drag heavily on the ground. This article follows the development of the sprayer from concept to testing to final product.

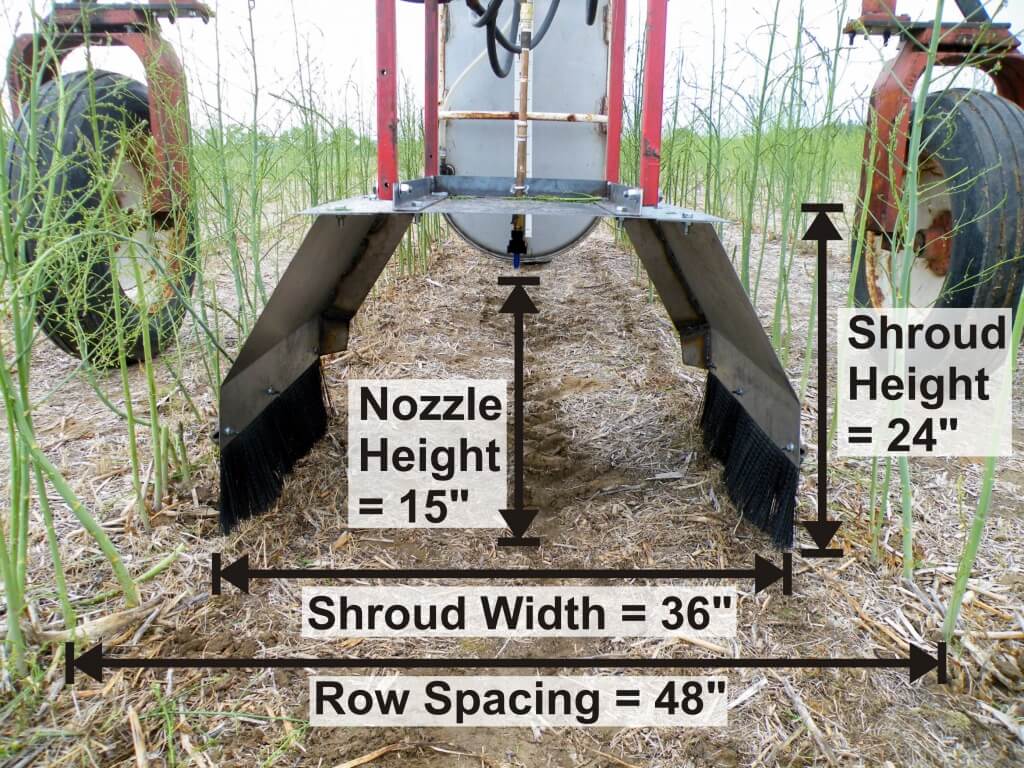
    The sprayer itself was a classic three-wheel, self-propelled affair. The asparagus was planted on four foot centres, leaving a three foot alley. While the goal was to hang three shrouds off the boom, we started with one to work out the bugs.

    DSCF3362

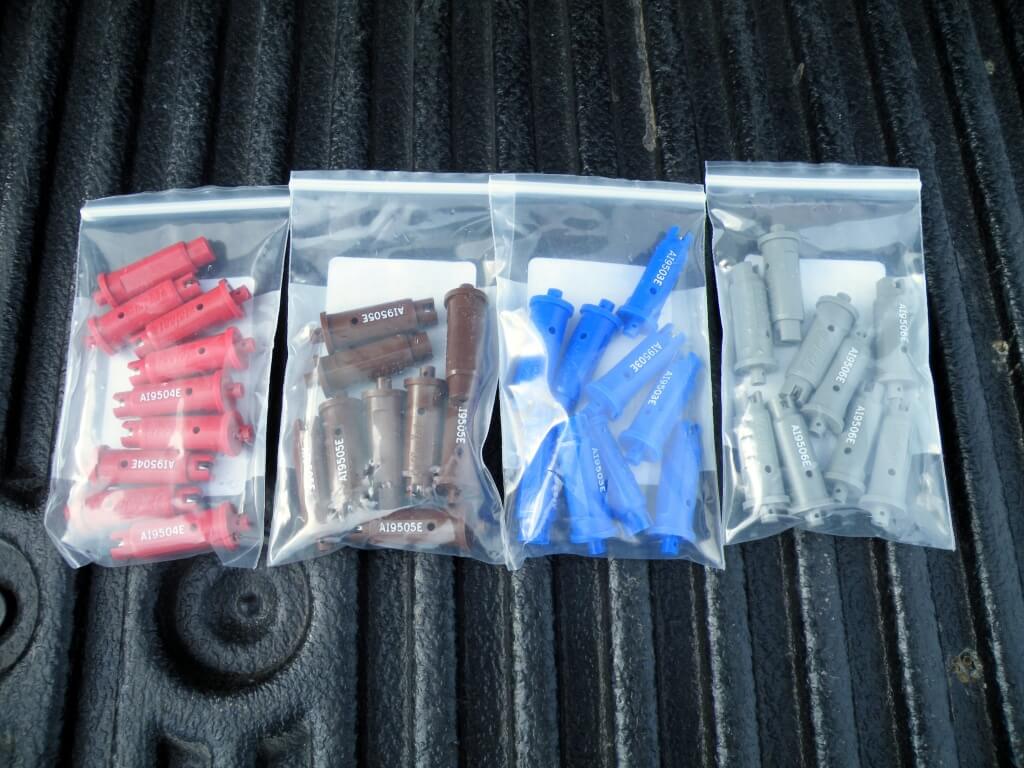
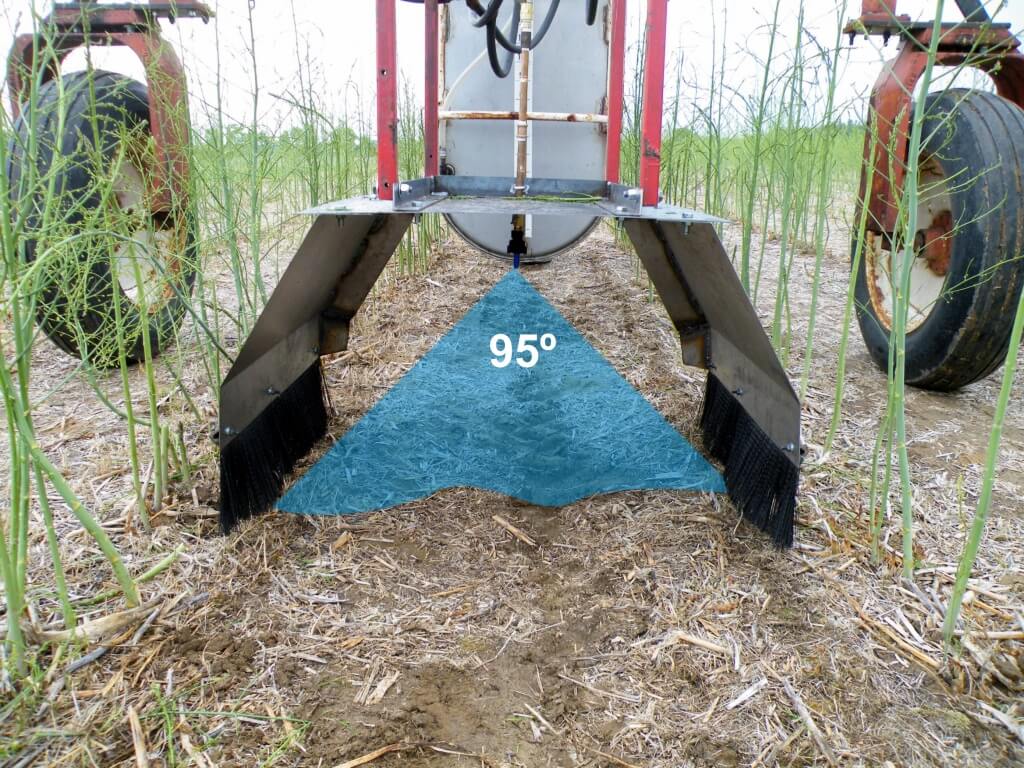
    This operation uses 2,4-D to control weeds in the alleys and while a little can hit the asparagus stem up to 12 inches (where the branching starts), we wanted to avoid contact at all costs. That led us to the TeeJet AI 95° flat fan nozzle, which produces a Very Coarse to Extremely Coarse spray quality. A single nozzle could be suspended to span the 3 foot width of the alley.

    DSCF3355
    2016_Asparagus_Herb_Shroud_2

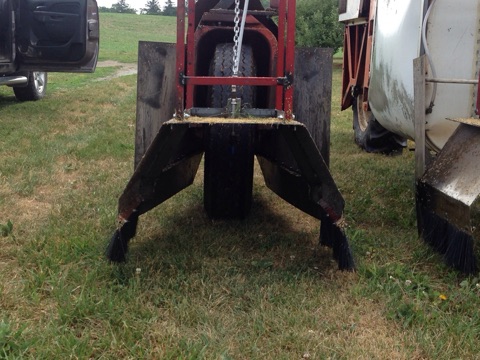
    The first version of the shroud was suspended off the boom from four anchorage points. A certain amount of of play was allowed so the shroud would find plumb (i.e. hang vertically), even when the sprayer boom yawed or pitched over uneven ground.

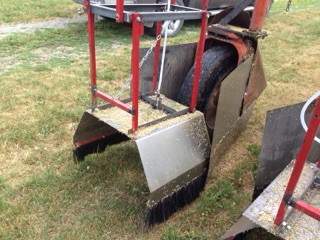
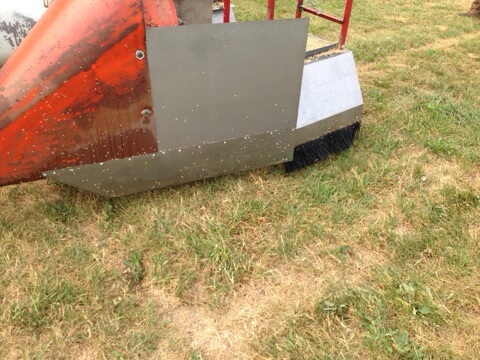
    The shroud was constructed of sheet metal, angled to reduce the potential for contact with the asparagus branches, and terminated in stiff, nylon brush-style mud flaps commonly seen on trucks. These brushes were cut to a few inches in length to span the distance between the side of the shroud and the ground. This would create a “seal” to prevent spray from escaping, maintaining some degree of contact with uneven ground.

    2016_Asparagus_Herb_Shroud_1

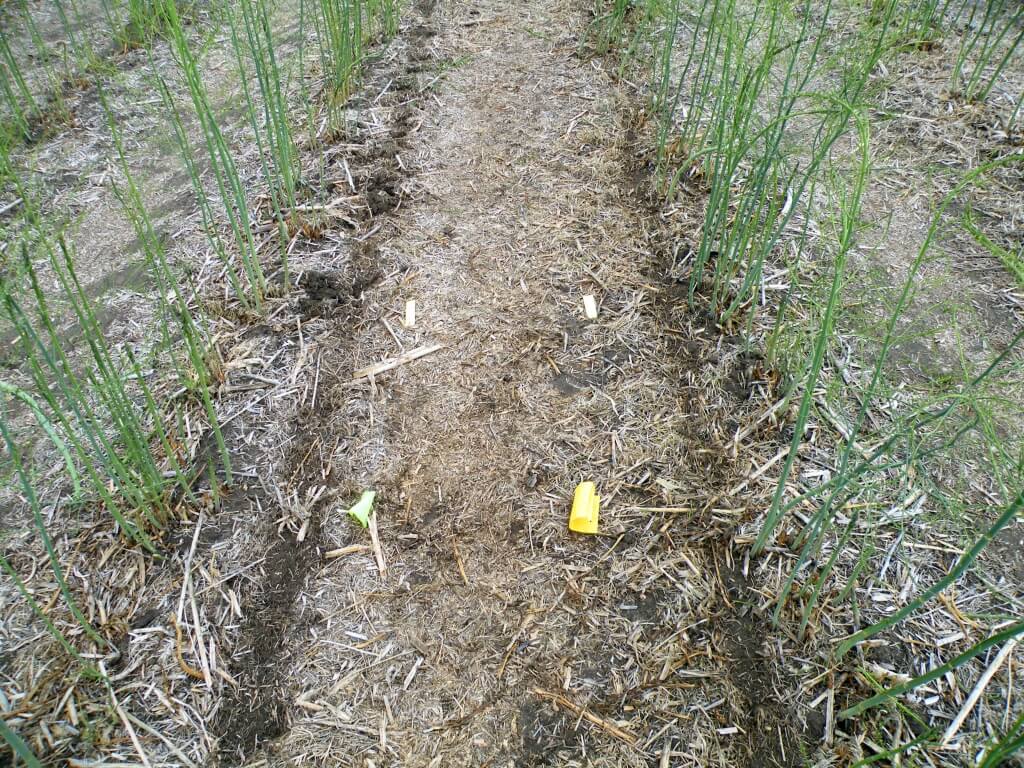
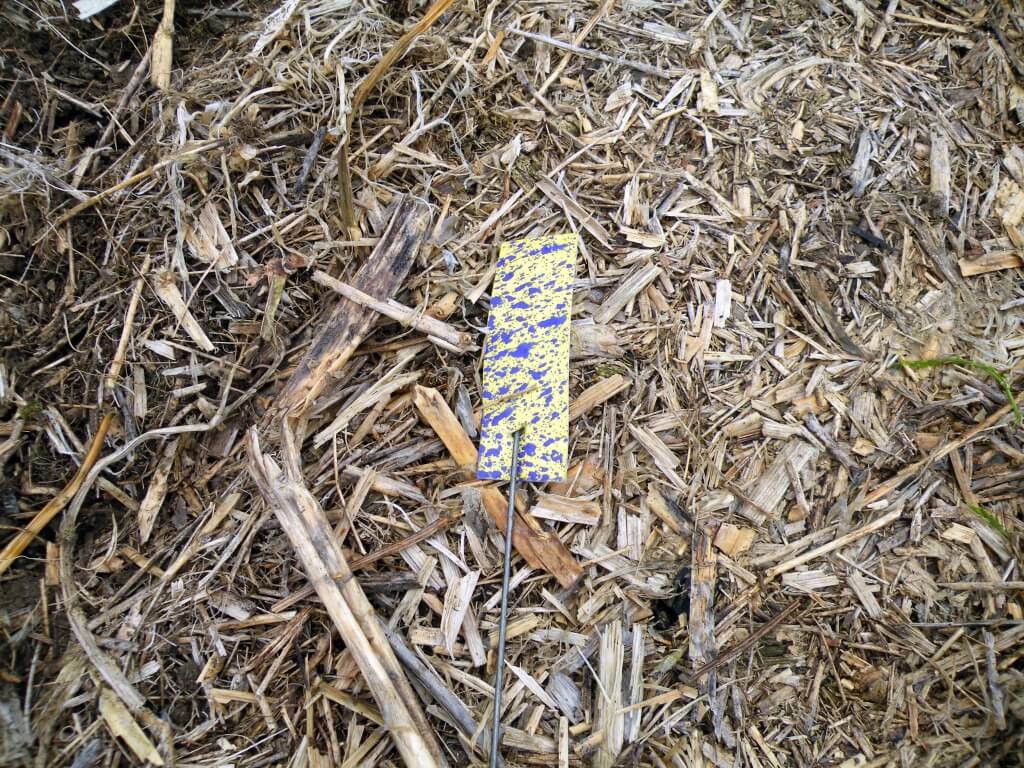
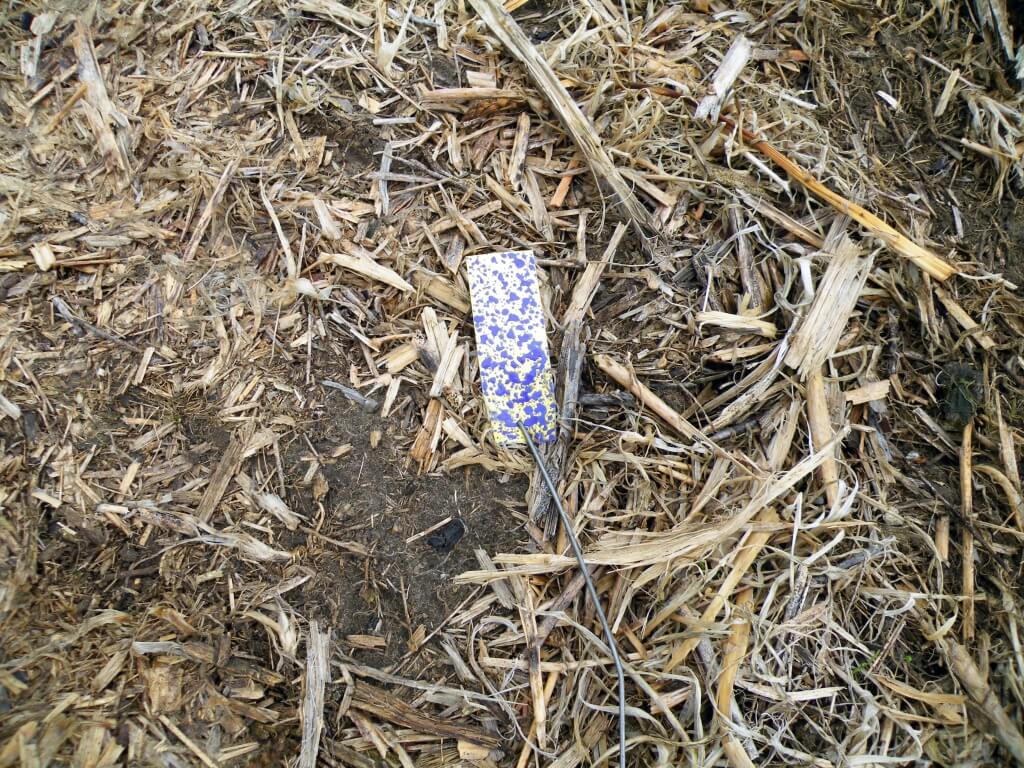
    We tested the first version by placing water sensitive paper in two positions on the ground, just inside the reach of the brushes. We had to be careful not to run them over with the centre wheel of the sprayer. We also adhered two papers to the angled inner walls to see how much, if any, spray was hitting the inside of the shroud.

    Our first pass on June 16th was at 9:00 am, 19.1 ºC (66.4 ºF) with a cross wind of 5 to 7 km/h (3.1 – 4.3 mph). relative humidity was high at 85% and travel speed was slow at 3.2 km/h (2 mph). We started with the .06 AI tip at 50 psi, but we drenched all the targets with excessive coverage because we were travelling so slow. We also found the stiff brushes were creating furrows in the soil, as shown below.

    DSCF3360

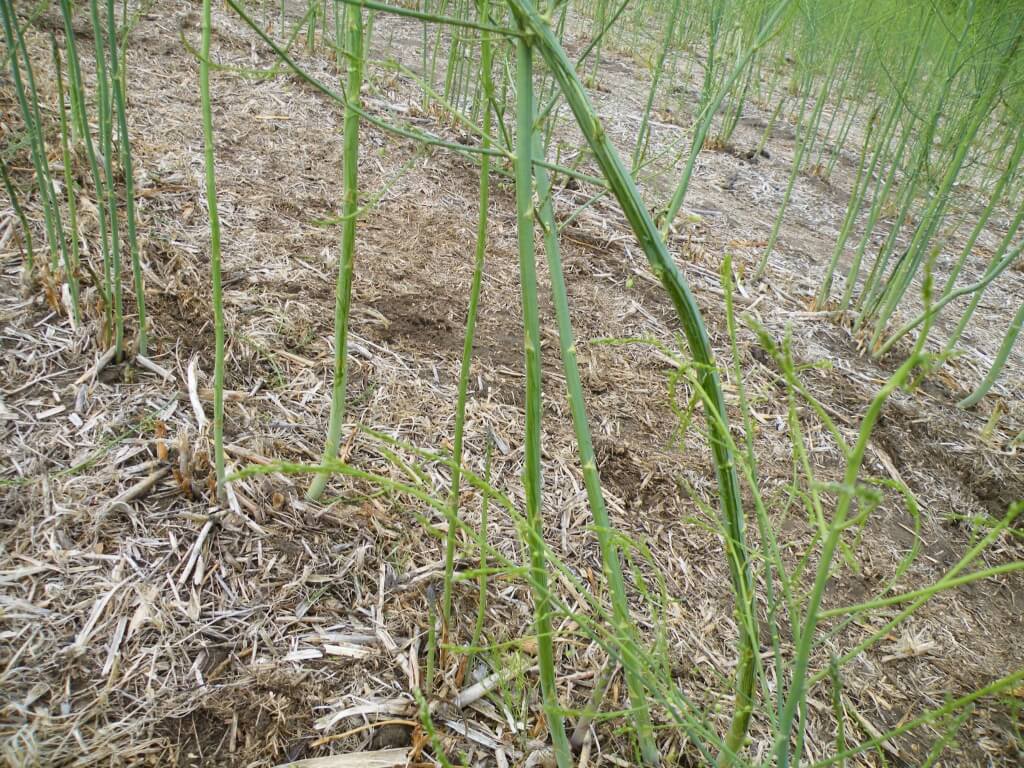
    For our second pass, we tried the .04 tip and raised the shroud while dropping the tip to keep it suspended 15 inches over the ground. We were still drenching the targets and noticed the shroud was hitting the asparagus spears, causing physical damage. The damage is shown below – note the dark green on the bent spear.

    DSCF3359

    This led to a decision to flare the side walls more aggressively, bringing them further into the centre of the alley and away from the spears (shown later in the article). This had the added benefit of angling the brushes as well to get a maximum span for weed control in the alley. For the final coverage pass we used the AI .03 tip, which gave more than 45% coverage on the ground, with even distribution, and there was no indication of spray on the papers adhered to the inside of the shroud. This coverage is more than is likely required, and the operator should be able to spray up to 6.5 km/h (4 mph) without compromising coverage.

    DSCF3364
    DSCF3365

    Since the coverage tests, the grower added additional sheet metal fenders to the the existing fenders, encasing the wheels and creating a smooth transition for the shroud to gently deflect the asparagus. The fenders were needed because the grower found the asparagus was being pushed out by the wheel fender only to bounce back in front of the shroud, which snagged the fern and damaged it. The additional fenders keep the fern spread and prevent it getting caught in front of the shrouds.

    2016_Asparagus_Hood_v2_3
    2016_Asparagus_Hood_v2_1
    2016_Asparagus_Hood_v2_2

    The grower was very happy with the sprayer’s performance and planed to build another. Why be satisfied with the status quo when you can tap into your creative side and be innovative? If you don’t think you’re imaginative enough to try upgrading equipment on your farm, here’s a simple test to prove that it’s in you. It’s easy to see the bird in the image below, but with a little concentration you’ll be rewarded with a ski-jumping rabbit.

    2016_Rabbit_Bird

    Thanks to TeeJet for donating the nozzles and water-sensitive paper and to Ray and Brad Vogel of Lingwood Farms for inviting me to participate.

    Learn more about spraying asparagus here.

  • If I had a Low Drift Nozzle – Parody

    If I had a Low Drift Nozzle – Parody

    Sung to the tune of “If I had a Rocket Launcher” by Bruce Cockburn

    Here comes the John Deere sprayer — second time today;

    All the insects scatter and hope it goes away;

    How many larvae murdered only Dow can say;

    If I had a low drift nozzle… I’d make somebody spray.

    I don’t believe in modes of action and I don’t believe in rates;

    I don’t believe in agronomists or their shiny steely spades;

    And when I talk with the survivors of that crappy bran bait;

    If I had a low drift nozzle… I would calibrate.

    On canola field margins one hundred thousand wait;

    Smash through truck radiators — or some less humane fate;

    Cry for bertha armyworm, sprayed with organophosphate;

    If I had a low drift nozzle… I would not hesitate.

    I want to raise every chirp — at least I’ve got to try;

    Every time I see them munching, with my compound eyes;

    Situation desperate, echoes of the hoppers cry;

    If I had a low drift nozzle… Some CCA would die.

  • Three Manageable Factors that Affect Spray Drift

    Three Manageable Factors that Affect Spray Drift

    In 2014 one of our OMAFRA summer students designed a short-and-gritty demonstration using a backpack sprayer, a variable-speed fan and some water-sensitive paper positioned downwind at 1.5 metre intervals. The intent was to illustrate how sprayer operators could reduce the potential for off-target drift by recognizing and accounting for three factors:

    • Apparent wind speed (i.e. the sum of wind speed and travel speed)
    • Boom height (i.e. release height)
    • Droplet size (i.e. nozzle spray quality)

    Apparent Wind Speed

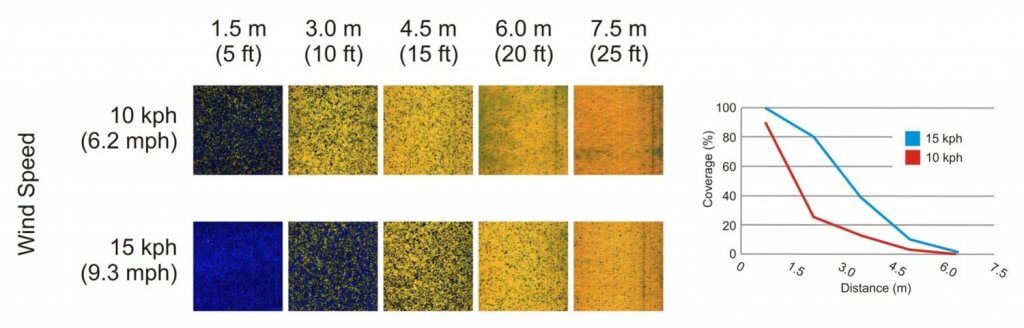
    Spray operators know they should not spray when the air is calm or when the wind is too high, but they often forget that the nozzles experience “apparent wind speed” which means driving 10 km/h into a 10 km/h headwind is essentially spraying in a 20 km/h wind.

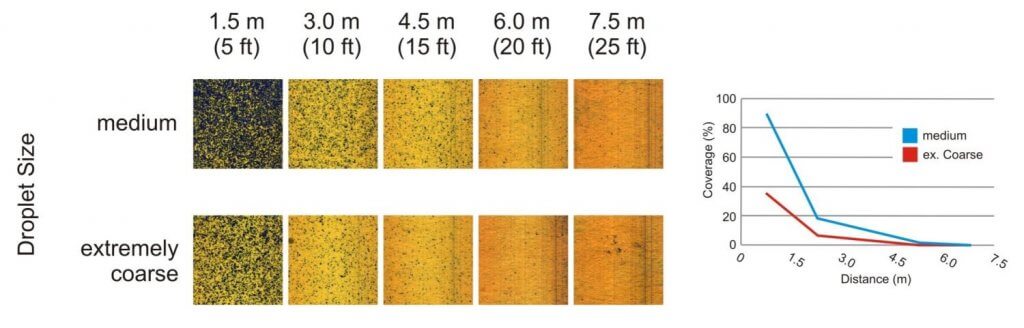
    The result of spraying with a Medium spray quality in 10 km/h and 15 km/h wind: water-sensitive papers indicated that there is more downwind drift in higher winds.

    Boom Height

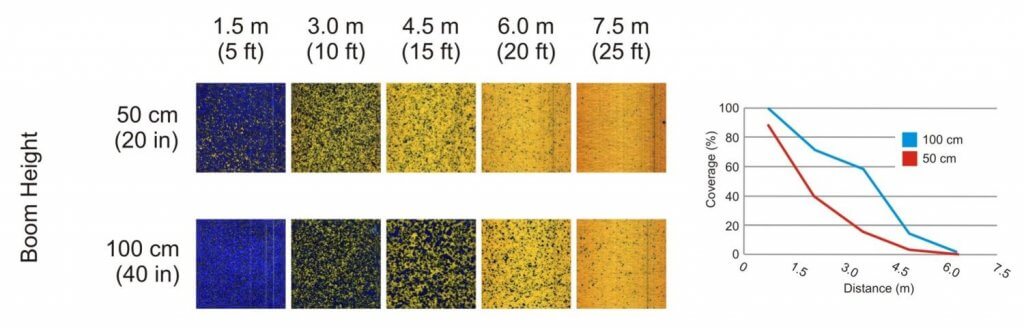
    Spray operators raise their booms to ensure their nozzles clear the crops, but this contributes to off target drift and greatly reduces coverage – particularly when using twin-fan style tips. Dr. Tom Wolf explains how to set your boom height here, or you could watch one of our Exploding Sprayer Myths videos on the subject.

    The result of spraying with a Medium spray quality in a 10 km/h wind at 50 cm and 100 cm from the ground: water-sensitive papers indicated that downwind drift increases as the boom gets higher.

    Droplet Size

    The coarser the spray quality, the less likely the spray will drift off target. Remember, for a given volume, shifting to larger droplets means fewer droplets. Application volumes may have to increase to compensate for potentially reduced coverage.

    The result of spraying with a Medium spray quality versus spraying with an Extremely Coarse spray quality: water-sensitive papers indicated that there is more downwind drift from smaller droplets.

    Take-Home

    This demo used percent coverage as a metric, which is convenient but greatly underestimates drift. So even when the spray window is small and the spray has to go on, take a moment to drop the boom, use a coarser droplet size and if it’s too windy, just don’t spray.

    WUR Drift Calculator

    There are many drift calculators available for home use. Some require more expertise than others to get a reliable result. This free downloadable calculator from Wageningen University & Research was made available in 2021. It can quantify spray drift deposits onto surface waters and non-target terrestrial areas near a sprayed field or orchard

    The calculator uses statistically obtained regression curves to calculate spray deposition next to the sprayed field. The spray drift curves are based on the latest experimental data for field crops, fruit orchards and avenue tree nurseries.

    Download your copy here.


  • Riparian vegetation or low-drift nozzles for water protection?

    Riparian vegetation or low-drift nozzles for water protection?

    Authors: T M Wolf, B C Caldwell and J L Pederson. Originally published in Aspects of Applied Biology 71, 2004, in expanded form.

    Abstract

    Spray drift deposition into water bodies may pose environmental and health hazards, and buffer zones have been suggested as a means of mitigating water contamination.  Field trials were conducted to determine the effect of nozzle type and riparian vegetation on spray drift deposition into wetlands.  Three riparian vegetative types, minimal vegetation (grass), low vegetation (willow shrubs), and high vegetation (aspen trees) were compared with open field conditions.  Spray was released upwind of wetlands with these riparian characteristics with conventional and air-induced low-drift nozzles.  Low-drift nozzles reduced drift deposits by about 75% in the absence of any vegetation, and by 88 to 99% when vegetation was present.  Dense willow shrubs resulted in anomalous downwind deposits, possibly because of air turbulence caused by low porosity characteristics.  By considering vegetation effects, a 15-m buffer zone could be reduced to 5 to 7 m for conventional, and 1 to 4 m for low-drift nozzles without increasing deposits at the edge of the sensitive habitat.  Both variables should be considered by regulatory bodies in their risk assessment procedures.

    Introduction

    Airborne transport is an important vector for movement of pesticides from agricultural land to receiving waters.  In an effort to maintain low pesticide levels in water bodies in accordance with risk assessment protocols, the Pest Management Regulatory Agency (PMRA) is mandating minimum setback distances (buffer zones) from water bodies during a spray operation.  Several additional variables can complement buffer zones in preventing spray drift, including low-drift sprays and riparian vegetation.  Germany and the United Kingdom already account for these characteristics in their buffer zone regulations (Kappel and Taylor, 2002). 

    Vegetation has been shown to be effective at mitigating droplet spray drift in several recent studies and reviews (Richardson et al., 2002, Hewitt, 2001, Ucar and Hall, 2001) by reducing wind velocities and intercepting spray. The documented magnitude of the spray drift deposit reduction in these studies ranges from 50 to >95%, dependent on variables that include vegetation height, porosity and orientation relative to wind direction, and wind speed. 

    We studied the integrated effect of buffer zones, vegetative barriers, and low-drift sprays to determine the overall impact of spray drift deposition onto downwind water bodies.

    Materials and Methods

    Overview and Site Description

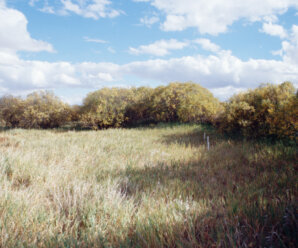
    The study was conducted in 2001 on a farm field near Aberdeen, SK. Sprays were applied upwind of a water body, and drift deposits were collected on petri-plates placed near ground level.  Experimental sites were chosen to represent different vegetation heights and types around the water body in question: low (uncut grass), intermediate (willow shrubs), and tall (aspen trees).  These were compared to nearby open-field conditions.  Two sprayer nozzle types were used in the study: conventional flat fan nozzles and venturi-type low-drift nozzles.

    The grass barrier was comprised of a mix of grasses dominated by bromegrass (Bromus spp.) growing to a height of 75 cm.  Willows (Salix spp.) were approximately 3 m tall with a density of about 0.15 m-2 and presented a fully foliated barrier for their full height.  Willows extended for a width of about 7 m toward the edge of the water body.  Trembling aspen (Populus tremuloides Michx.) were approximately 8 m tall, with foliation beginning 1.5 m above ground.  Trees were present at a density of about 0.25 m-2 and extended for 8 m toward the water edge. 

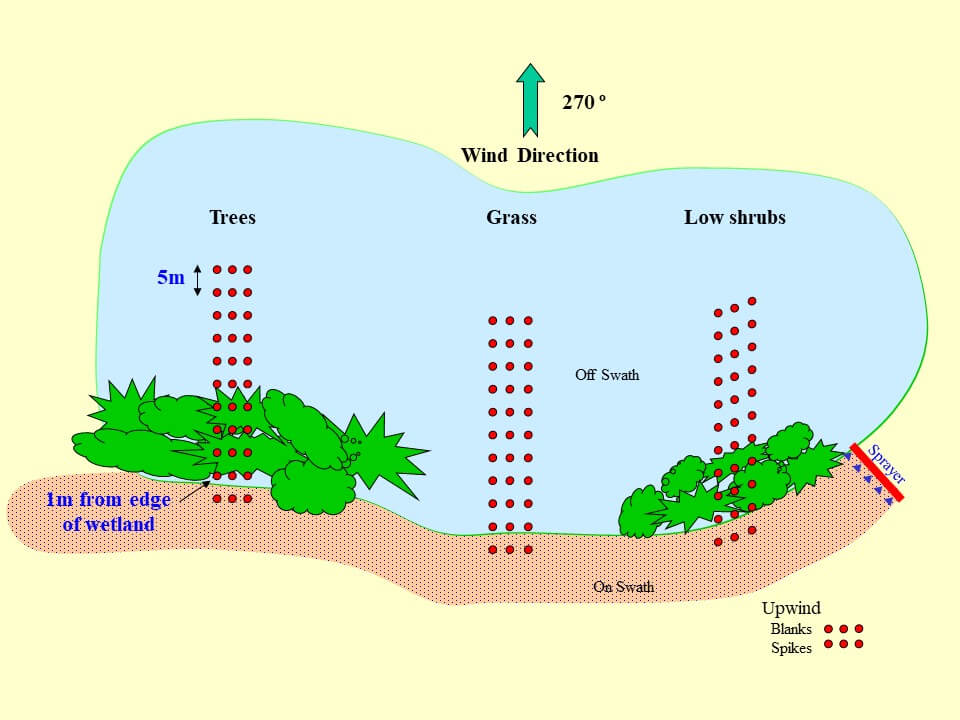
    Figure 1: Site and sampler layout

    Spray Equipment and Application Method

    A Melroe Spra-Coupe 220 was used to make the applications.  This sprayer was equipped with conventional flat fan nozzles (XR8003) and air-induced low-drift nozzles (TD11003) at 275 kPa, producing ASABE Fine and Coarse sprays, respectively.  The spray boom was 10 m wide and nozzles were 75 cm above ground.  Sprayer travel speed was 12.9 km h-1, at which the application volume was 100 L ha-1.

    The sprayer tank contained a mixture of 2,4-D amine4 (4 g L-1) and Rhodamine WT5 (2 mL L-1), a fluorescent tracer dye which would be used to quantify the deposits.  2,4‑D acted to photostabilize the dye, and also provided a spray formulation with physico-chemical properties representative of agricultural pesticides.

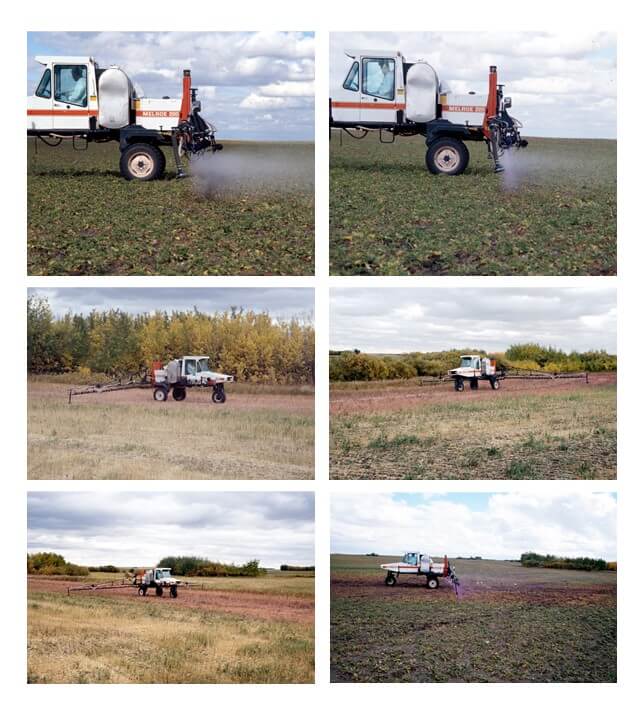
    Top row: Fine and Coarse sprays used in study
    Middle row: Tall and medium vegetation
    Bottom row: Short vegetation and open field

    Application was made in a direction approximately perpendicular to the prevailing wind, with the downwind edge of the spray boom at the edge of the wetland’s riparian vegetation.  This was usually about 15 m upwind of the edge of the water body (due to severe drought conditions, the wetland did not contain any water at the time of the trials).  Three consecutive passes were made along the same swath in a 10-min period to obtain average meteorological conditions for all three vegetation types.  Wind speed and direction, temperature and relative humidity were monitored during application using a portable micrometeorological station. 

    Sampler Layout

    Downwind of the spray swath there were 3 parallel lines of eleven 15-cm diameter glass petri-plate samplers starting underneath the sprayer boom and extending 46 m downwind from the edge of the spray swath (Figure 1).  Samplers were separated by 5 m within the line, and lines were about 2 m apart. 

    The deposition profile was also assessed under open field conditions, using the same sampler layout but on crop land with no riparian vegetation.  These are referred to as ‘bare soil, or ‘reference’ samplers in this report and served as a baseline to determine the impact of the riparian vegetation. 

    Sample Collection and Analysis

    Sample collection began 5 minutes after spray application was complete (See Table 2 for trial times).  Beginning with the furthest downwind locations, petri-plates were covered with a plastic lid, and placed into dark boxes.  Spray deposits on the samplers were washed off in the laboratory using 95% ethanol in three 15-mL washes.  Final samples were made up to 50 mL. and two 20-mL sub-samples were collected in borosilicate vials and stored in the dark. 

    Within 24 h, subsamples were analyzed using a fluorescence spectrophotometer with excitation and emission wavelengths of 545 and 570 nm, respectively (Shimadzu Model RF-1501 spectrofluorometer equipped with Model ASC-5 auto-sampler).  Instrument readings were converted to µg L-1 using standard curves and expressed as a percent of the applied dosage under the field sprayer. 

    The fluorescence spectrophotometer data were averaged over the three replicate sampling lines, adjusted for photolysis, and expressed as a percentage of the amount applied on-swath.  Relationships of spray drift deposits with downwind distance were first visualized by plotting all data points, and then mathematically related through appropriate regression techniques.

    Results

    Meteorological Conditions

    Weather conditions were favourable during the trials.  Wind speed and direction were appropriate for the sampler layout and the experimental objectives.  Mean wind direction varied by up to 44º from the ideal (270º) in 6 out of 12 trials, and was within 30º for the remaining 6 trials (Table 1).  Mean wind velocities were consistently between about 17 and 21 km h-1 in all but one trial.  Air temperature and relative humidity fluctuated between 14 to 22º C and 31 to 80%, respectively, on the trial dates.

    Deposition Profiles

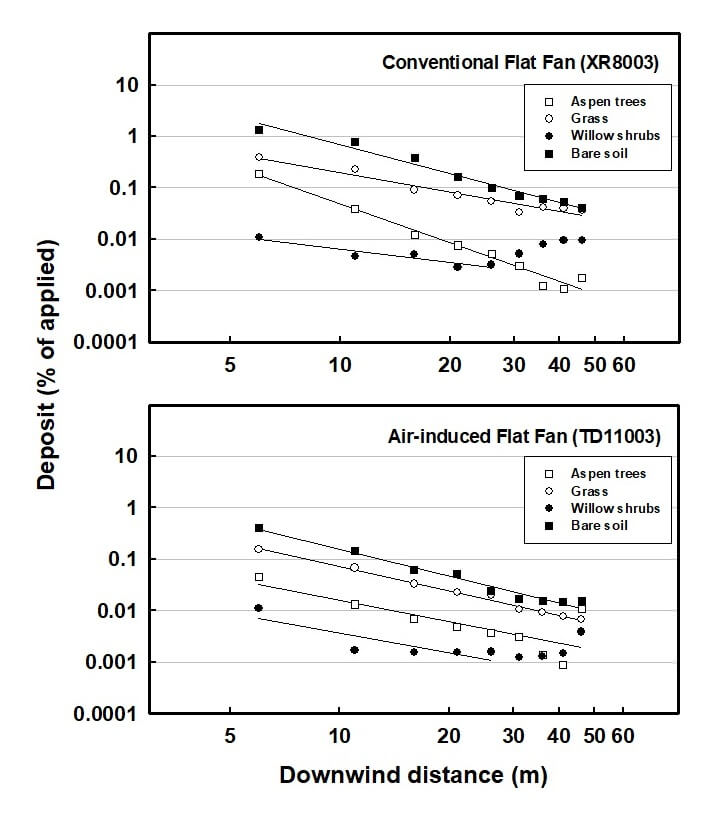
    A visual review of the raw data suggested that a linear regression of the log of deposit amount and log of downwind distance would be appropriate.  It was noted that for willow, the deposit profile tailed upwards after the 26 m mark.  Based on a survey of the site, it was concluded that this tail was probably caused by the length of the spray pass exceeding the length of protection offered by vegetation.  In other words, beyond the 26 m sample, drift had not been attenuated by a vegetative barrier.  It is also possible that the airflow was deflected up over the low, non-porous barrier and returned to ground level beyond the 26 m distance (Carter et al., 2001).

    Figure 2: Spray deposit profiles from Fine (top) and Coarse (bottom) sprays.
    The deposition data for the willow were regressed from 6 to 26 m, all others were taken to 46 m (see text for explanation).

    As a result of the questionable data for this vegetation type, it was decided that it would be misleading to include the furthest downwind data points.  Implications of this observation will be discussed later in the manuscript.  All regressions were statistically significant, explaining between 61 and 99% of the observed variation.  In 5 of 8 trials, more than 90% of variation was explained. 

    Drift Mitigation by Riparian Vegetation and Application Method

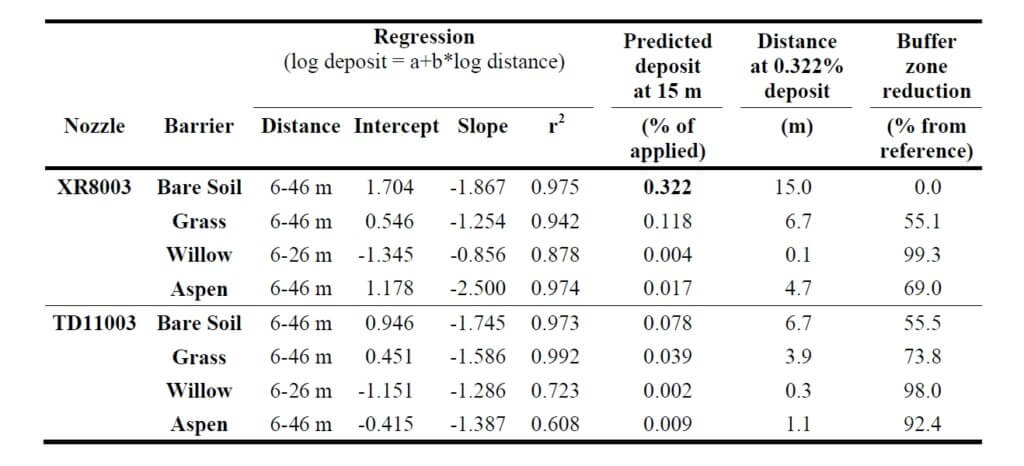
    The predicted drift deposit at 15 m was calculated for all trials based on the regression parameters (Table 3).  For the conventional sprayer on bare soil, the deposit amount was 0.322% of the applied dose.  The distance at which this specific deposit amount would be achieved was then calculated for all other trials.  This value is the buffer zone distance at which equivalent protection to the reference system was offered.  Buffer zones could therefore be reduced by 55% (grass), 99% (willow) and 69% (aspen) using the conventional nozzle and 56% (bare soil), 74% (grass), 98% (willow) and 92% (aspen) for the low-drift nozzle. 

    Table 1: Buffer zone distances based on observed drift, calculated from regression.

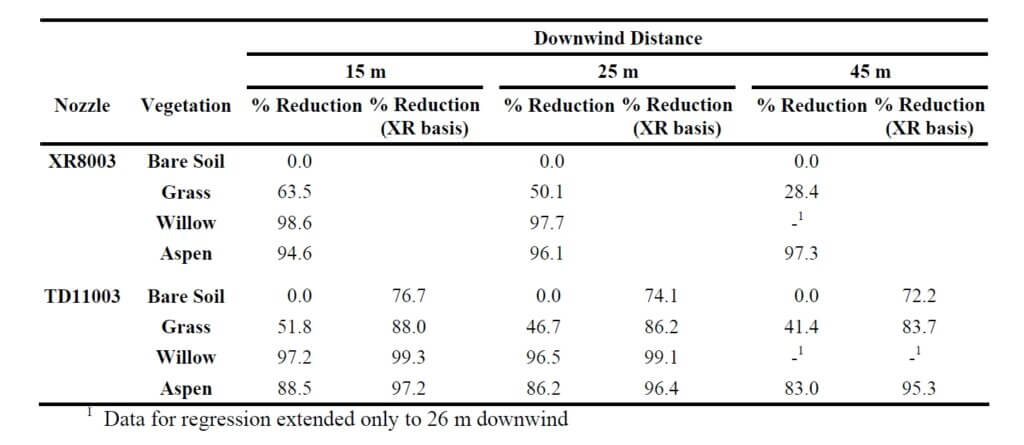
    The calculated buffer zone reductions were not equivalent to the observed drift reductions due to the unique regression slopes of each deposition line.  For example, expected drift deposits at 15 m downwind on bare soil were reduced by 77% when the air-induced low-drift nozzles were used (Table 4), whereas buffer zone distances could only be reduced by 56% (Table 3).  Furthermore, the effectiveness of the grass vegetation diminished with distance, reducing drift by 64, 50, and 28% at distances of 15, 25, and 45 m, respectively.  Therefore, a complete deposition profile will be required for each vegetation scenario to accurately adjust buffer zones.   

    Table 2: Drift deposits expressed as a percent of the reference deposition line for two application methods, four vegetation types, and three downwind distances.  All numbers are the mean of three separate experiments on the same location. 

    Riparian vegetation was typically more effective than low-drift nozzles in protecting water bodies from drift deposition.  While grass reduced deposition by 28 to 64% from the conventional nozzle (depending on the downwind distance), willow and aspen reduced deposition by between 95 and 99% (Table 4).  The willow was not considered at further distances since the data used for the regression were truncated at 26 m.  Low-drift sprays provided some additional protection in all cases except for trees at the 45 m distance, where deposits increased slightly relative to the conventional spray. 

    Discussion

    The aerodynamics of vegetative barriers are a complex phenomenon.  Wind, upon reaching a solid barrier, is diverted up and over giving strongly turbulent conditions on the leeward side and a rapid return to free wind speed.  For a permeable barrier like a hedge, the return to free wind speed is more gradual since some air filters through, reducing the pressure differential and allowing for less turbulence (Davis et al., 1994).  Wind speed reduction is most pronounced for a distance of 5 H upwind and 30 H downwind at the 1 H height, where H is the height of the barrier (Rider, 1951). Nonetheless, there may still be an upward diversion of air (and spray drift) which may simply delay, not eliminate, sedimentation (Hewitt, 2001, Ucar and Hall, 2001), particularly for dense hedges (Carter et al., 2001).  Richardson et al. (2002) did not, however, notice such a deflection up to 10 m height. 

    The reduction in drift deposition by riparian vegetation in this study is clearly significant, but is subject to some interpretation.  These data were generated at a single site, and while this site was carefully selected to be representative and trials were repeated three times, it does not necessarily constitute an average result.  There are clearly any number of possible arrangements of trees, shrubs and grass, plus any additional vegetative or landscape features which would influence drift deposition behaviour.  However, due to the consistent nature of the data of this study, some confidence is attained in that the numbers are at least reliable for the given set of conditions.  In this study, three spray passes were made along the same swath at the edge of the water body.  Results could have been different had adjacent spray swaths been used, owing to the possible change in contribution of upwind swaths with the altered airflows under vegetated conditions. 

    Since the water body was dry, additional grass vegetation which had grown up could have made an effective collector of spray drift, possibly reducing deposit values beyond those that would have occurred in a water body.  It is recommended that efforts be made to repeat these studies when water is present at normal values. 

    The mitigating effect of vegetation depends on the aerodynamic features of the vegetation, as well as the collection efficiency of their leaves, twigs, etc.  This poses some difficulties because there are no absolute measures of these features.  Permeability, for example, varies with wind speed owing to the movement of leaves, and winds speed itself varies with height (Davis et al., 1994).  Collection efficiency of the vegetation varies similarly with target size, its movement, wind speed, and droplet size spectrum (Hewitt, 2001).  However, there are opportunities for improved characterization with specialized equipment, such as that used by Richardson et al. (2002).  Their LIDAR instrument was able to help calculate tree height and width, mean area index and mean area density. Work to further characterize vegetation will prove useful in future efforts to understand its mitigating potential. 

    Low vegetation such as grass has not received the recent attention of hedges and trees but has also been documented to reduce spray drift significantly.  A study by Miller et al. (2000) documented significant reductions in airborne drift concentrations above uncut grass canopies, even at low plant densities.  Bache (1980) documented similar reductions in spray drift when sprays were applied over a mature wheat crop compared to bare soil.  Therefore the filtering effects of “low” canopies may be very significant and should be the subject of further study. 

    Riparian areas are regions of high biological activity and diversity, not only protecting adjacent water from outside influence, but also providing food and shelter for many species of wildlife.  These areas must themselves be protected from harmful effects, which can include pesticides.  Their efficient capture of sprays suggests some risk from pesticides capable of controlling perennial vegetation.  Likewise, pesticide residues in this vegetation have the potential to be ingested by wildlife or be washed off with precipitation, resulting in movement into the water body.  These effects must be considered when using vegetation to mitigate airborne drift. 

    Conclusions and Recommendations

    • Vegetative barriers reduced spray drift deposition from conventional or low-drift nozzles into water bodies by 24 to 99%.
    • Low-drift sprays reduced deposition by about 75%.
    • Of the vegetation types, shrubs and trees had similar effects, reducing deposition from open-field conditions by an average of more than 95%.  Low-drift sprays improved on this reduction. 
    • Calculated buffer zone reductions were less than drift deposit reductions. Accurate determination of buffer zone distances requires that the entire deposition profile be characterized. 
    • It is suggested that both riparian vegetation and sprayer technologies are important components of water body protection.  Both should be considered in BMP and regulation development whenever the impact of pesticide applications near water bodies is to be estimated or mitigated. 

    Acknowledgements

    The technical assistance of Glenda Howarth, Jill Clark, Rachel Buhler, Murray Nelson, Trevor Linford, and Pam Reynolds is greatly appreciated.  Financial assistance was provided by the Rural Quality Program of the Agri-Food Innovation Fund, administered by the PFRA.  The authors wish to thank Darrell Corkal and Clint Hilliard of PFRA for their enthusiasm, support and guidance directed towards this project, and Raymond Malko for making his land available for the trials. 

    Citations

    Bache, D. H.  1980.  Transport and capture processes within plant canopies.  Spraying Systems for the 1980’s.  BCPC Monograph No. 24, 127-132.

    Carter, M. H., R. B. Brown, K. A. Bennett, M. Leunissen, V. S. Kallidumbil, and G. R. Stephenson. 2000. Methods for reducing buffer zone requirements for pesticide spraying adjacent to wetland environments. Sainte-Anne-de-Bellevue, Quebec: Proc. 2000 National Meeting, Expert Committee on Weeds / Comité d’experts en malherbologie [on-line:  http://www.cwss-scm.ca/pdf/ECW2000Proceedings.pdf].

    Davis, B. N. K, M. J. Brown, A. J. Frost, T. J. Yates, and R. A. Plant. 1994.  The effects of hedges on spray deposition and on the biological impact of pesticide spray drift.  Ecotoxicology and Environmental Safety 27:281-293.

    Hewitt, A. J.  2001.  Drift Filtration by natural and artificial collectors:  a literature review.  Special publication by Spray Drift Task Force, 12 pp.  [on-line:  http://www.agdrift.com]

    Kappel, D. and W. A. Taylor. 2002.  Buffer zones and “low drift” equipment.  Hardi International Discussuion Paper, available from Hardi International A/S Helgeshøj Allé 38 DK-2630 Taastrup.

    Miller, P. C. H, A. G. Lane, P. J. Walklate, and G. M. Richardson. 2000.  The effect of plant structure on the drift of pesticides at field boundaries.  Aspects of Applied Biology 57:75-82. 

    Richardson, G. M., P. J. Walklate, and D. E. Baker. 2002.  Drift reduction characteristics of windbreaks. Aspects of Applied Biology 66:201-208. 

    Rider, N. E.  1951.  The effect of a hedge on the flow of air.  Quarterly Journal of the Royal Meteorological Society 78:97-101. 

    Ucar, T. and F. R. Hall. 2001.  Windbreaks as a pesticide drift mitigation strategy:  a review.  Pest Management Science 57:663-675.

    Wolf, T. M.  2000.  Low-drift nozzle efficacy with respect to herbicide mode of action.  Aspects of Applied Biology 57:29-34.