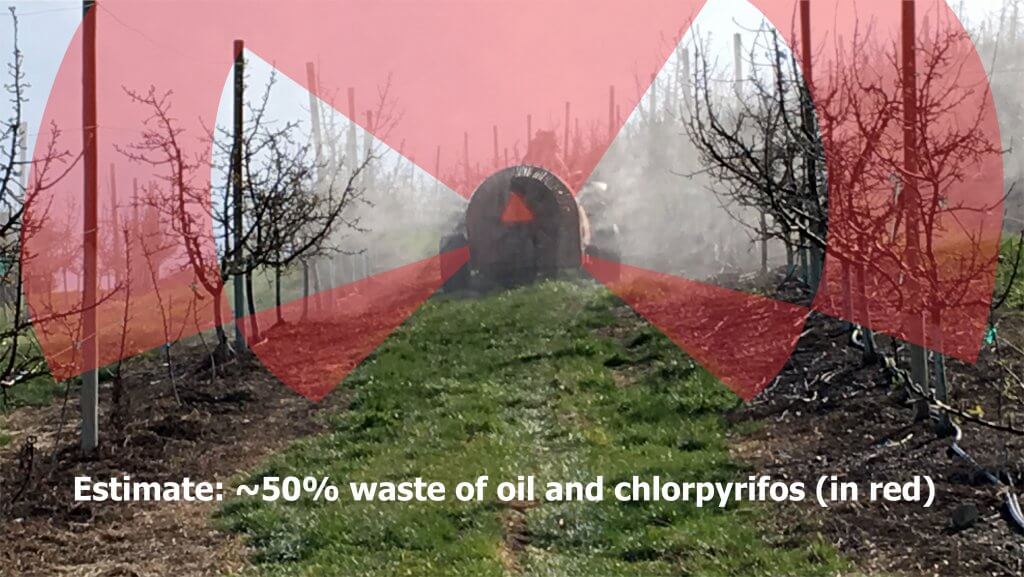
Spray that is not directed at the target is wasted spray. Many pesticide labels specifically require the operator to restrict spray to the target canopy. Spray that escapes above the canopy is a significant source of off-target drift. Foliar applications that extend below the canopy are not efficacious and represent waste and lost productivity.
A spring application or oil and chloropyfiros. Estimate of 50% waste (in red).
Air carries spray droplets, so the first step in any adjustment should be to perform a ribbon test to ensure the air outlets are oriented correctly. This is achieved by adjusting deflectors (e.g. low profile axial), the air outlets on a tower, or the entire head on a wrap-around design with individual fan/nozzle combinations.
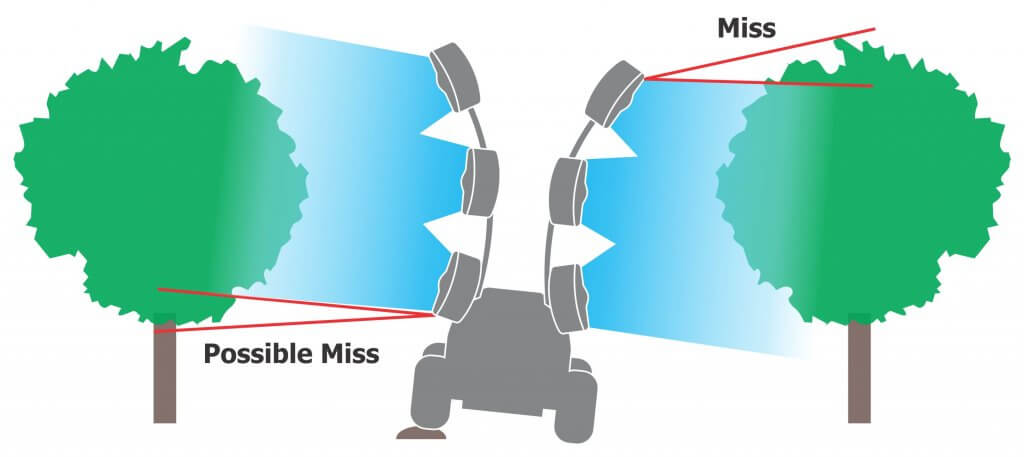
Spray height should always exceed the canopy height by a small degree. This compensates for the increase in wind speed with elevation, the potential loss of spray height with faster travel speeds, and uneven alleys that cause the sprayer to rock, which changes the spray angle.
Spray angles change as a sprayer rocks on uneven alleys. It is more important that spray is directed at the top of a canopy than at the bottom.
It is less critical that spray align with the lower portion of the canopy. As air energy wanes, or as droplets begin to lose momentum, finer droplets will slowly fall, depositing on random surfaces. Coarser droplets will quickly fall towards the bottom of the canopy, settling primarily on upward-facing surfaces. This secondary deposition can also occur from the cumulative impact of blow-through from upwind rows.
Once the air is aligned, park the sprayer in an alley. Stand behind the sprayer and extrapolate a direct line from each nozzle to target canopy. Nozzles that point at the canopy should be left on. Nozzles that point above or below can be blocked, or turned off via valves or rotating roll-overs. Some roll-over nozzle bodies can be swiveled up or down 15 degrees to fine tune the spray angle. An alternative would be to permanently rotate the nozzle body fitting in the boom line. When aiming nozzles using a roll-over nozzle body, be careful not to swivel them too far or the valve will partially close and compromise the spray pattern.
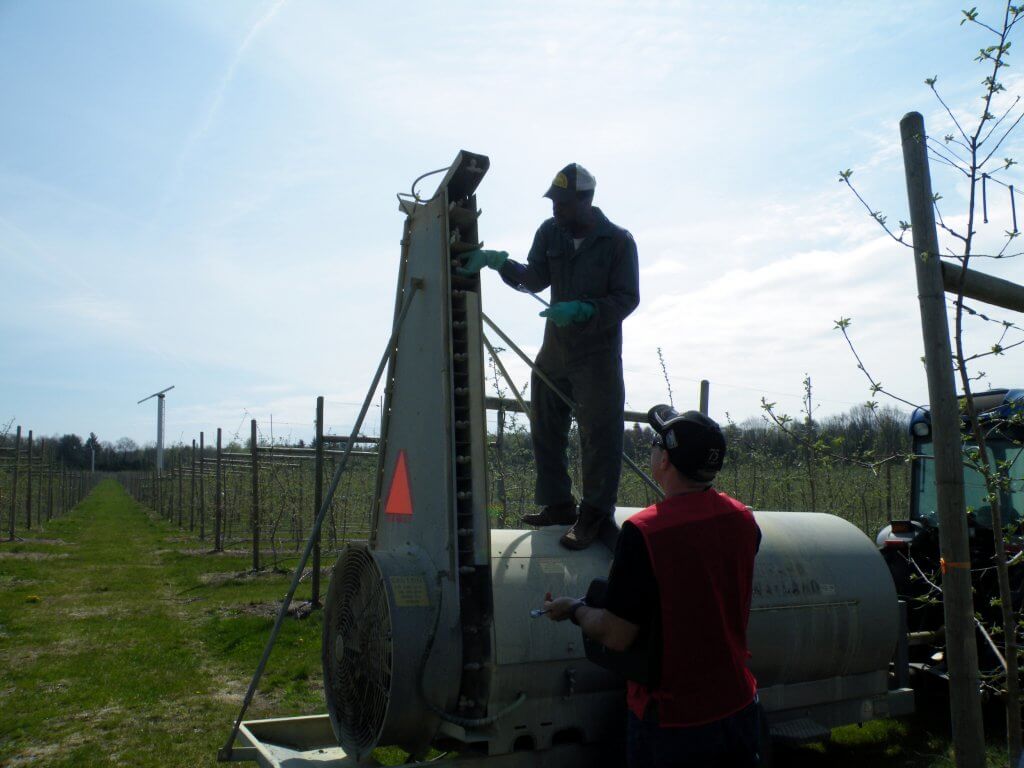
Use a ladder when adjusting nozzles on a tower sprayer. Some sprayer chassis and tanks are designed to accept a climber, but even so they can be slippery. Please be careful.
When extrapolating, remember that the centre of a nozzle only indicates the centre of the spray pattern. Cone and fan angles can span 60 to 110 degrees, depending on the influence of air. Therefore, even though the centre of the lower-most nozzle intersects the bottom of the target canopy, you may still be able to turn it off because the nozzle above has that portion covered.
Adjust spray distribution across the boom at the beginning and roughly mid-way through the spray season to ensure the sprayer will uniformly cover the target with the optimal volume. These adjustments should account for both canopy growth and fruit set.
For example, as the season progresses in an orchard, fruit may cause limbs to hang lower and warrant a new spray distribution. Turning on the bottom nozzle position will help, but it doesn’t account any increase in density throughout the canopy. You may need more volume distributed across the entire boom. Another example: as grape bunches begin to close, sprayer operators may direct fungicides exclusively at the fruit zone and not the entire canopy.
Remember to always check coverage using water sensitive paper. It’s not worth saving a bit of spray if you’re missing a bit of your target.
This article isn’t about best practices, or social contracts, or innovative new technologies. It’s just a fascinating bit of history. If it has any moral at all, perhaps it’s to remember where we came from. I wonder where we’ll be tomorrow?
Let’s be clear – the practices described in this article are anachronistic and while I shouldn’t judge from my 2020 high-horse, they’re flat-out terrible. Don’t see them through nostalgic eyes. Instead, be thankful that sprayers and practices have evolved.
Here’s the background. A colleague of mine, a grower and well-respected pesticide safety / sprayer expert, recently held a farm auction in Innerkip, Ontario. He sent me a photo of his family sprayer, used in Oxford county in the 50s and 60s. I fell in love with it.
It was used to control broad leaf weeds in cereal crops. He recollected that thistle was a particularly painful issue. Especially when you had to grab hold of the grain sheaves and stook them. I confess I had to look up the term “stook“. They also sprayed a few cereal acres for neighbours, but never too far from home.
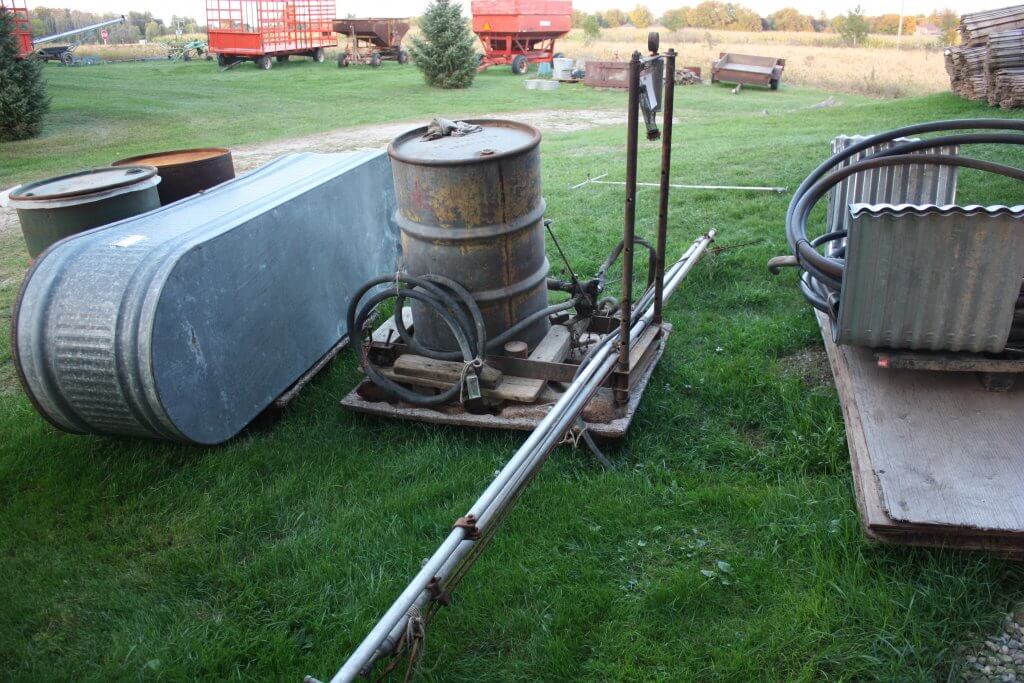
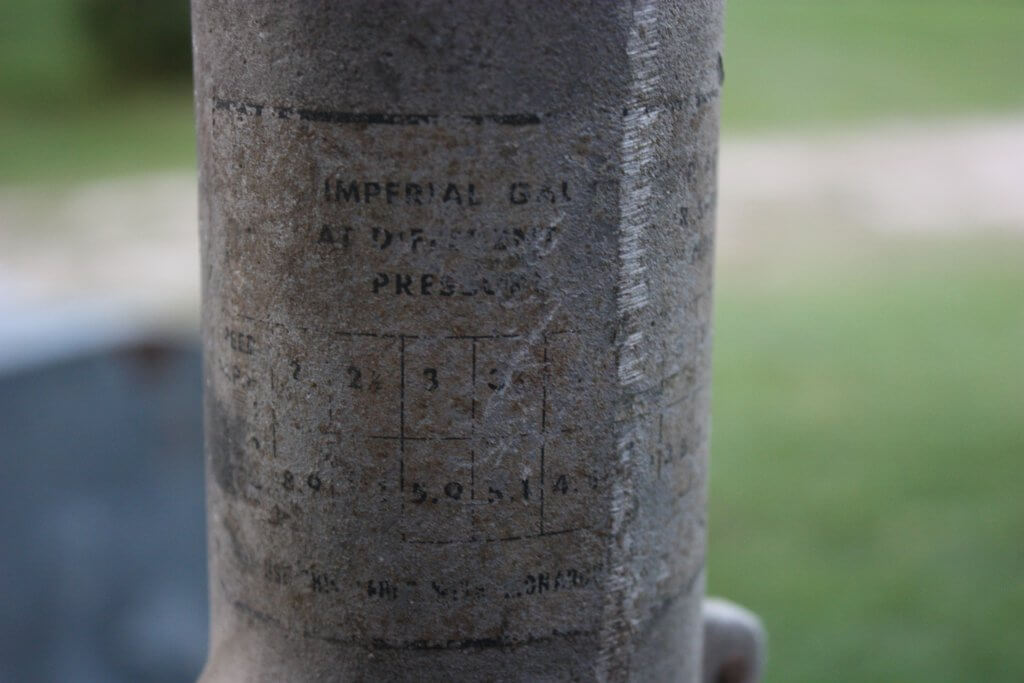
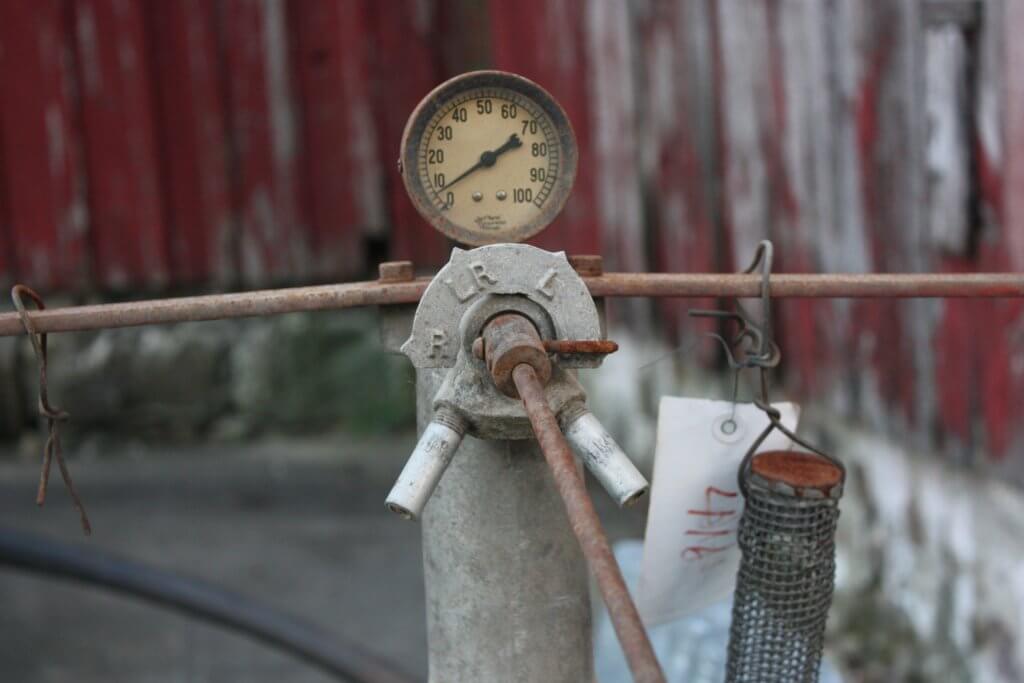
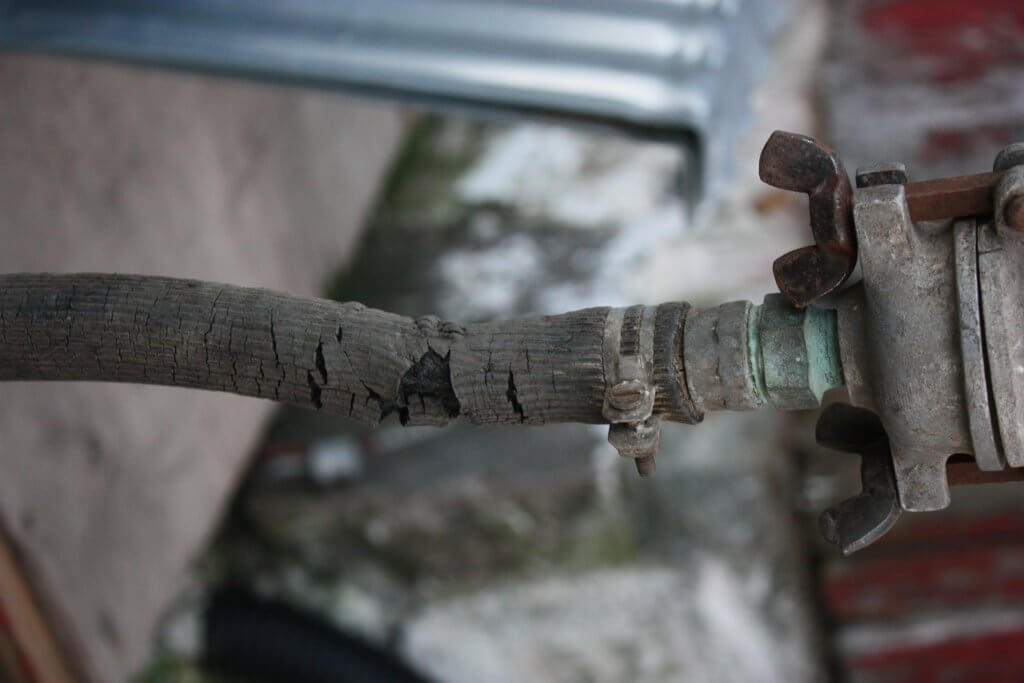
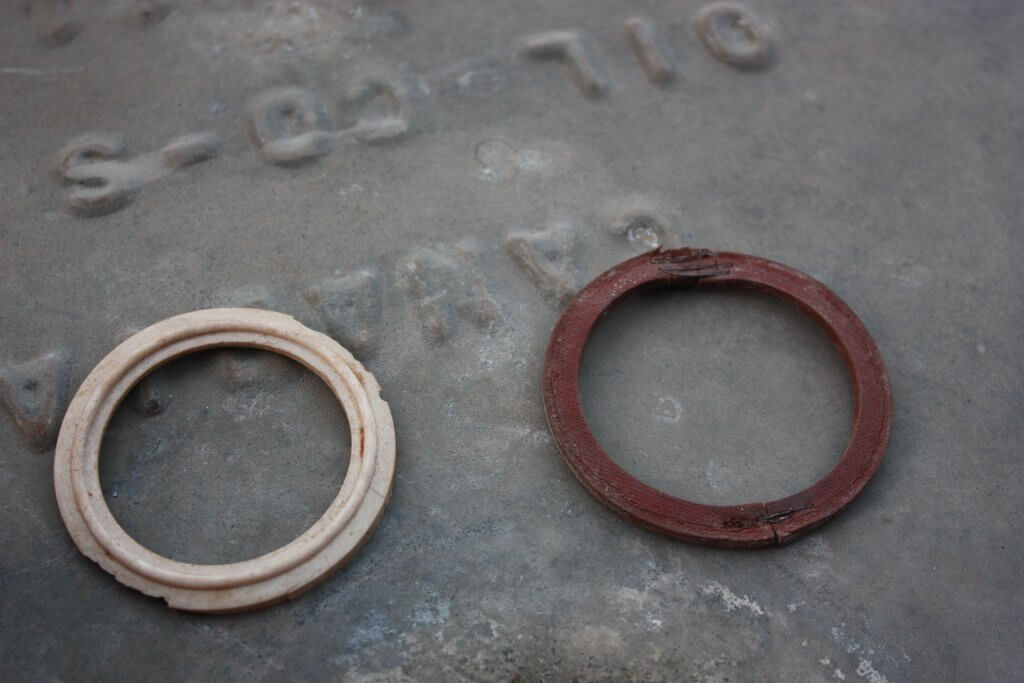
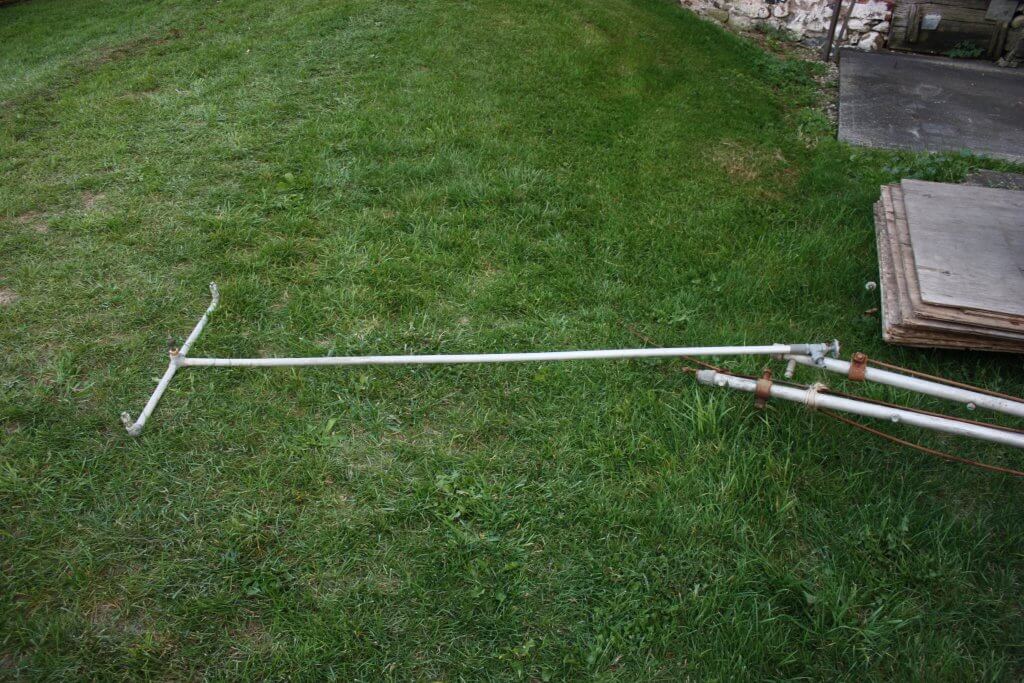
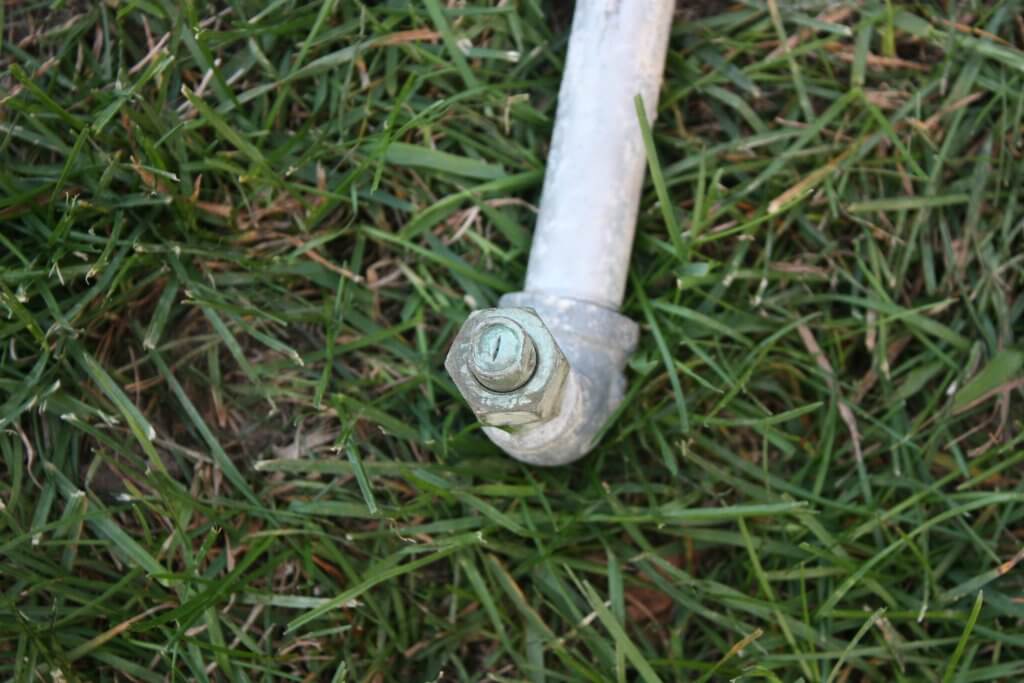
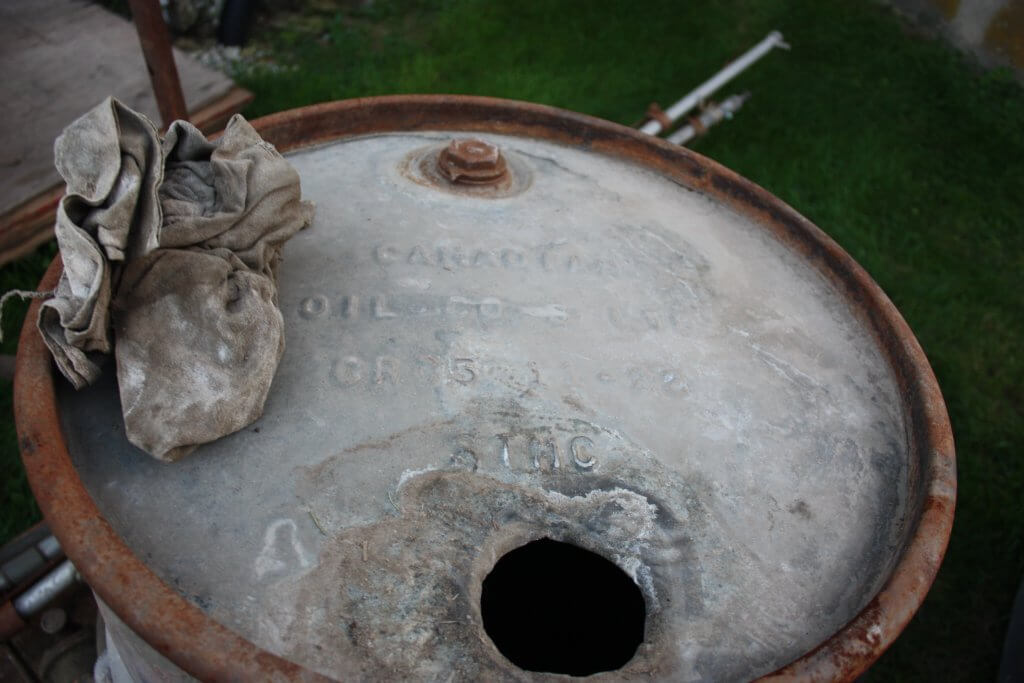
A 1950s barrel sprayer. The frame would be attached to the front of a Massey Harris 44, suspending the 21 foot wet aluminum booms. The drum was supported on the tractor tongue. When you shut down, you picked up the booms and hung them on the fenders. The booms then leaked all over until they were empty.Fortunately, there was clear guidance for the operator. The speed and rate was written on the distribution head. Still somewhat legible.A rod would extend from distribution head to the tractor, supported on the steering column. The driver could select the boom: left, right, both or off. The distribution/filter head/pressure gauge (shown here) was supported on front of tractor. On the up side, there was no need for the driver to do a shoulder check. Here the distribution selector is set to ‘off’. The filter, shown here as well, was a metal screen wrapped in a cotton cloth (typically a flour bag).This is the line from the pressure side of the pump, entering the distribution unit. The butterfly screws made a tight connection… using canning jar rings as gaskets!Both the cotton bag on the filter and the pressure line were sealed with canning jar rings.When the broadcast work was done, they would set up a hand boom and spray the fence posts. Bare hands were the order of the day.Spraying the fence posts was a two-person job, with a driver in the tractor and a kid aiming the boom. Here’s a close-up of a flat fan nozzle on the hand boom.Here is the supply drum with opening for suction hose and screen. It served double-duty as pesticide tank and seat for the person holding the hand boom. Pesticide swished out onto the person sitting on the drum. Getting their butt wet as a matter of course. The drum was filled with a 1/2 inch hose right from the well.
When the long season was through, it was over-wintered (with whatever spray liquid remained) in the cellar.
This short article is a thought exercise designed to give some perspective on chemical rates, carrier volumes and the foliar area we expect them to protect.
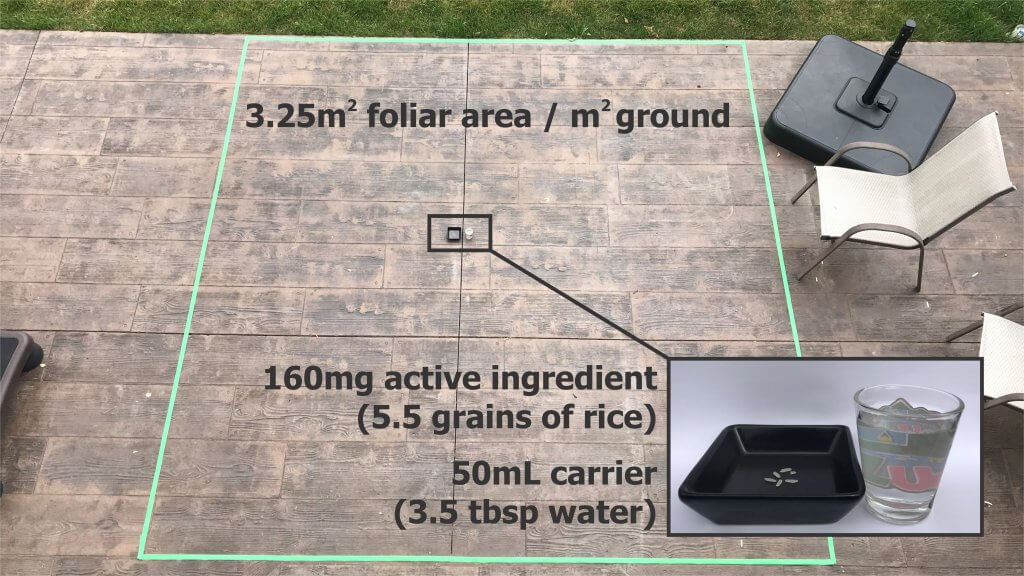
Imagine we are spraying the fungicide Captan on highbush blueberry. In Canada, the label rate is to apply 2kg/ha (28.5oz/ac) of planted area. Captan is 80% active ingredient, so a quick unit conversion tells us our objective is to apply 160mg of active ingredient per m2 of planted area. Let us suppose we will use 500L of carrier per hectare (53.5 gal/ac), which converts to 50mL/m2.
Now let’s say the blueberry patch is mature and well pruned. Each plant has a footprint of 1.2m by 1.2m (4ft by 4ft) and is 1.5m (5ft) high. The Leaf Area Index (LAI) is the one-sided green leaf area per unit ground surface area (LAI = leaf area / ground area) in broadleaf canopies. Assuming a conservative LAI of 2, that’s 2.88m2 (65ft2) of leaf surface area per plant. We double that figure since we want to spray both sides of the leaves, and then assuming the bushes are planted on 3m (10ft) alleys we arrive at a total foliar surface area per planted area of 3.25m2/m2 (3.25ft2/ft2).
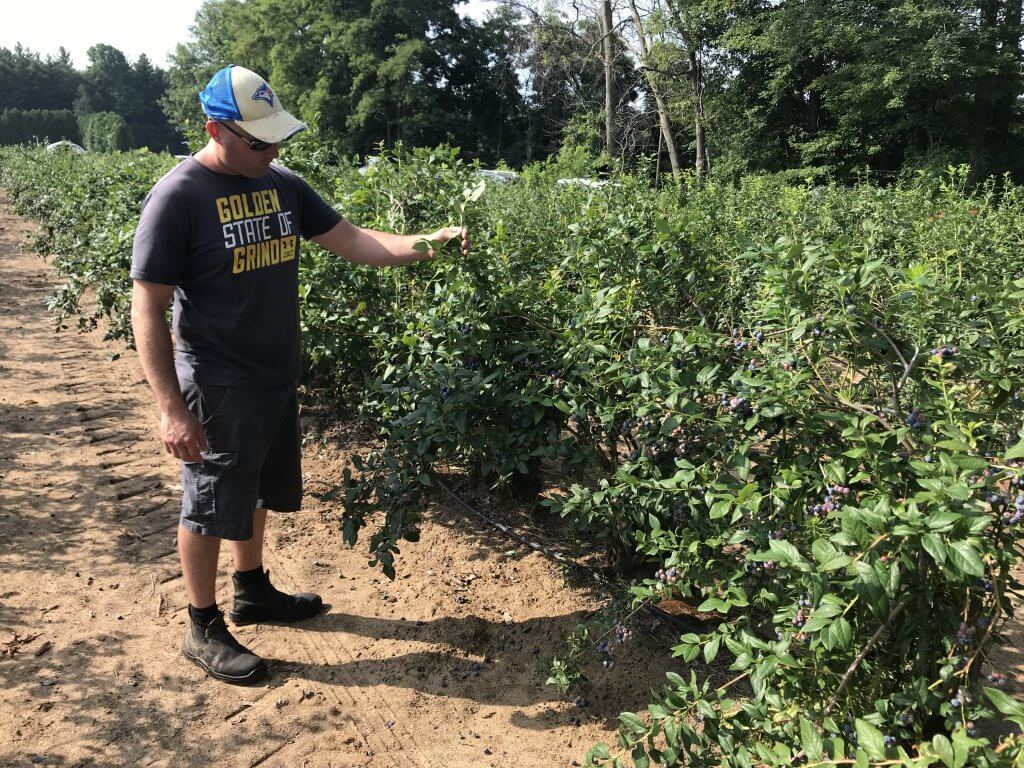
A grower with his mature, well-pruned blueberries. 4′ x 4′ on 10′ alleys.
Let’s take these figures and convert them to something we can picture. An average grain of rice weighs 29mg and there are 15mL in a single tablespoon. What this means is that a sprayer operator’s goal is to dissolve active ingredient with a weight equivalent to 5.5 grains of rice in 3.5 tbsp of water and distribute it evenly over 3.25m2 (35ft2) of surface area!
Now that’s perspective.
This photo shows how much foliar surface area exists in a square meter of mature highbush blueberry. In the centre is the typical amount of active ingredient and water that must be distributed over that area. It’s amazing what we ask of an air-assist sprayer.
This short article is a reminder for sprayer operators to respect the possibility of tipping a sprayer. Every spring I catch wind of someone tipping over. When I can ask the operator questions I start with “Is everyone alright?” and “Was the sprayer full?“. Hopefully the answers are “Yes” and No“, but not always.
The following factors are always involved:
Driving too fast. Usually entering a field at road speed.
Entering the field on a downhill slope and/or catching a pothole or soft shoulder.
Turning in a tight radius, usually 180 degrees. This is made worse when the sprayer is towed.
Sprayer is not completely full and “slosh” changes the centre of gravity.
Narrow tires and a narrow base.
Fortunately the sprayer wasn’t damaged and the spill was minor.A tight turn at high speed coupled with a depression in the entryway and tank slosh was enough to tip the unit. They had it righted and hauled out soon after. No one was hurt.
I’ve heard as many cases involving seasoned operators as new operators. The next few pictures are of a veteran operator’s sprayer carrying 28%/ATS. Just like the images above, a tight turn at high speed sloshed the load just as a deep pot hole caught the outside front wheel. This sent the sprayer into a lane of traffic before it tipped back and over into the field. No one was hurt.
Fortunately for the operator, the spill was contained in their field (not the road or ditches). The 90′ boom had to be cut off before the sprayer could be towed back to the yard to be sold off as parts. While the operator has looked at the bright side (an opportunity to upgrade) it has left them relying on a custom operator for spring spraying and making a hasty in-season equipment purchase.
Lost a tire during the tow back to the yard.Crumpled boom after having to be cut from the sprayer.Not the way anyone wants to see their sprayer.
Major Spill
What follows are generic steps for what to do if there is a major spill. Always defer to the process outlined by your regional authority.
If you do tip the sprayer, first protect yourself, then others, then animals in that order.
Stop any exposure by removing clothing and washing as best you can.
Stop people from entering the area.
If it is safe to do so, try to prevent the spill from spreading.
Contact your local spill centre. In Ontario, the Spills Action Centre will receive calls 24 hours a day at 1-800-268-6060. Consult with your municipality for their spill reporting contact numbers.
Take home
Of course we’d rather avoid this problem altogether. Be sure to slow down before turning into a field. Take the turn as gradually as possible. Remember that soft spring ground and new pot holes can become serious obstacles – consider scouting the entry before the first spray or at minimum getting out of the cab and checking before entering.
In April 2014, NDSU extension published an excellent factsheet explaining what thermal inversions are, how to detect them and how they affect pesticide spray drift. That factsheet inspired this article.
The Atmosphere
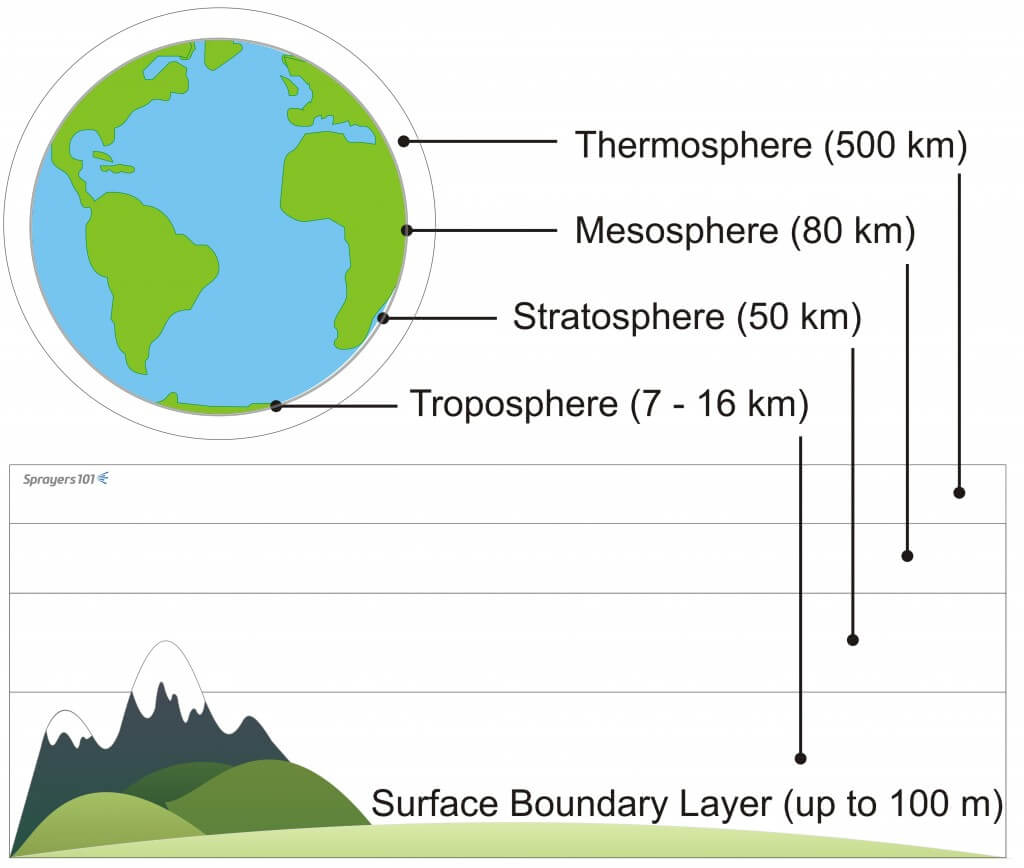
The Earth is surrounded by a layer of air called the atmosphere. Think of it as a sheet of liquid percolating and flowing over the Earth’s surface. Seems a bit precarious, doesn’t it?
We define “layers” of atmosphere based on their distance from the Earth’s surface (see image below). We’ll focus on the lowest part of the Earth’s atmosphere: the Surface Boundary Layer. As it drags along the Earth’s surface it experiences rapid changes in wind speed, temperature and humidity (on a time scale of an hour or less).
The Earth’s Atmosphere. The illustration of the Earth is to scale, but obviously the landscape is not. Our focus in on the Surface Boundary Layer.
Atmospheric temperature
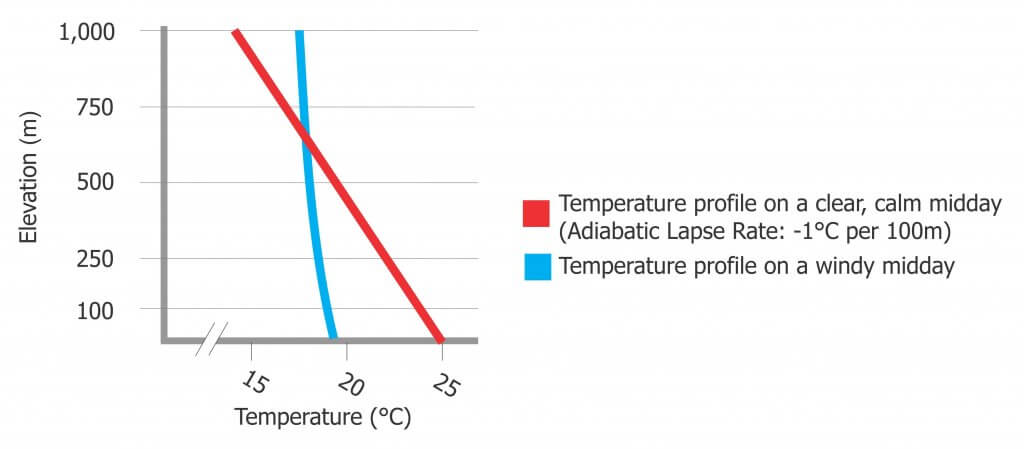
In relatively calm, clear and dry conditions (e.g. a nice afternoon), air cools with elevation at a rate of about 1°C per 100m. This change is called the Adiabatic Lapse Rate and it’s caused by pressure changing with elevation. If your ears have popped when driving down a steep hill, you’ve experienced pressure change with elevation; there is more atmosphere overhead and the weight pushes down.
With higher elevation, there is less atmosphere overhead. Less weight means less pressure and this gives air room to expand. Expansion takes work and work costs energy, which creates a cooling effect. See how simple thermodynamics are?
In the graph below, the red line shows the Adiabatic Lapse Rate of air cooling with elevation. The blue line indicates wind stirring and homogenizing the atmosphere, reducing the degree of temperature change with elevation (more on that later).
Day and night
When we add the effect of daytime solar heating and nighttime cooling, the rate of temperature change is affected. Let’s consider how this works on a clear, relatively calm day:
Early morning
The morning sun emits short wave radiation, which is absorbed by the Earth’s surface. The surface conducts some of this energy deeper into the ground and also heats the air near the surface. This creates a temperature gradient wherein the surface is warmest and the air gets relatively cooler with elevation (remember the red line in the graph above).
As the air near the surface warms, that energy causes air molecules to vibrate and push away from one another. Parcels of air become less dense and rise just like the gloop in a lava lamp. The cooler air around it falls to fill in the space left behind, and air begins to circulate in a Convection Cell. The rising parcel of air will eventually cool and shrink as it rises through the relatively cooler air above it.
These convection cells create Thermal Turbulence, which is a very effective way for airborne particles, such as pesticide vapour, to be rapidly diluted. This is also how the atmosphere disperses pollution. More on the process of dispersion, later.
Mid to late afternoon
As the sun passes over and the wind starts to rise, the convection cells get disrupted by the wind and experience mechanical turbulence (remember the blue line in the graph above). So, mechanical turbulence also mixes warmer air near the ground with cooler air above it, but suppresses thermal turbulence.
Mid-afternoon to night
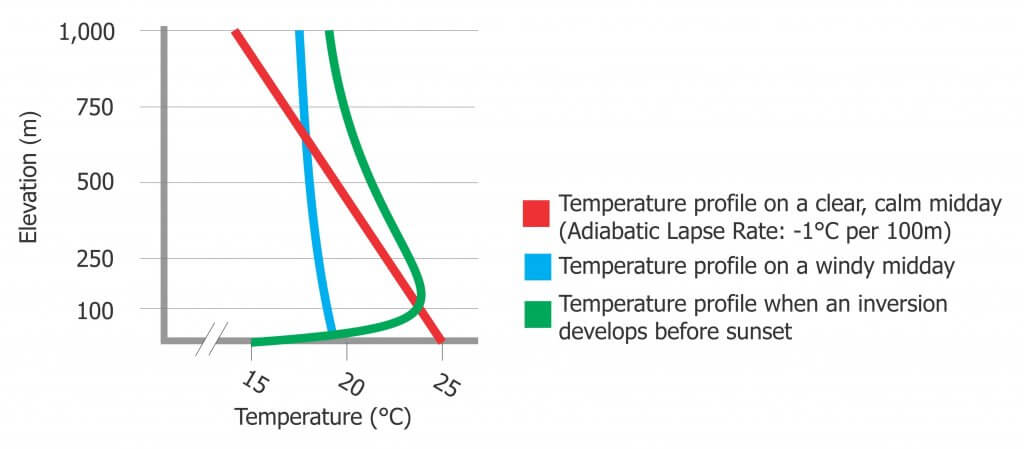
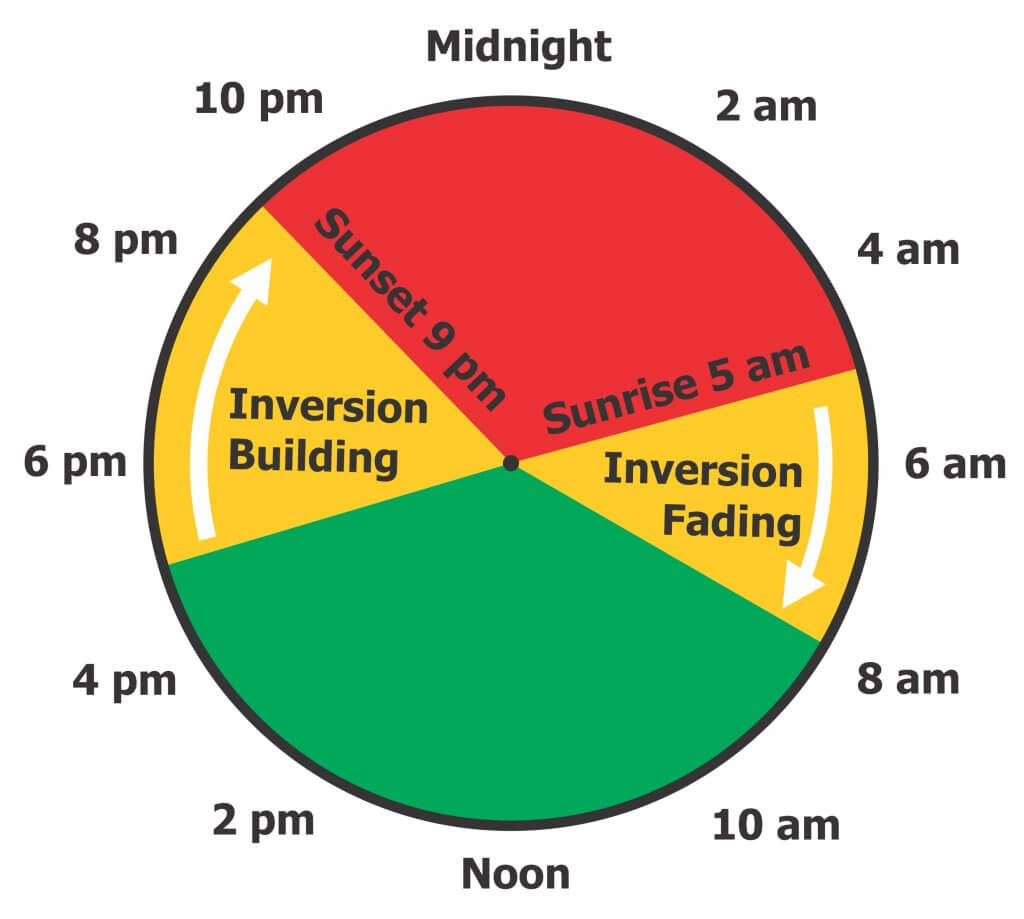
As the energy from the sun lessens, the soil begins to cool and so does the air next to it. Once the air cools enough to be colder than the air above it, we have the beginning of a Radiation Inversion, which is a specific kind of Thermal Inversion (see the green line in the graph below). It is called that because we now have the reverse of the typical day-time temperature profile. The height of the inversion (the ceiling) grows with time, and can reach a maximum of about 100m by sunrise. Within the inversion layer (before the green line bends back at 100m), turbulence is suppressed. We have a stable air mass. More on that below.
How inversions affect dispersion
The rising portion of a convection cell carries whatever particles are in the air with it. Suspended particles become much less concentrated at ground level thanks to the thermal turbulence.
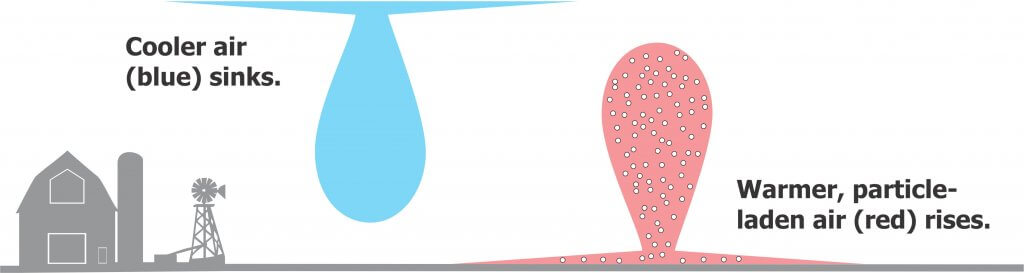
Thermal Turbulence allows particle-laden warm air to rise and clean cool air to fall. This disperses air-borne particles like dust or pollution.
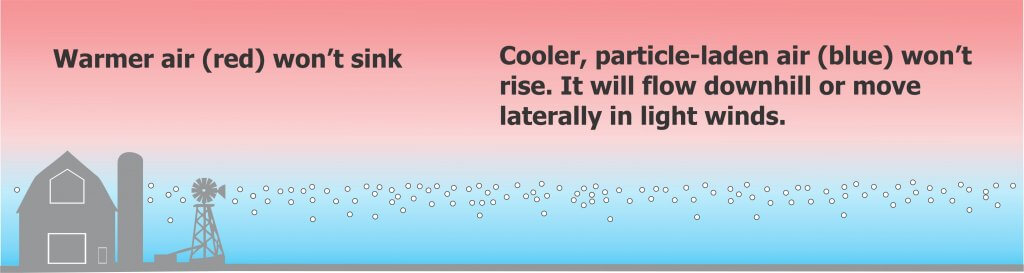
Now let’s imagine we are in a thermal inversion. The cooler, particle laden air near the ground cannot rise and the cleaner air above, which is now relatively warmer, cannot sink. Thermal turbulence is suppressed, and so is any vertical dispersion.
Thermal Turbulence is suppressed during a Temperature Inversion. Particle-laden cool air at the surface cannot rise, and warm, clean air cannot fall. No dispersion occurs, and the concentrated, particle-laden air tends to move downhill or laterally with light winds.
When spraying, the smallest spray droplets fall slowest, staying airborne for long periods of time. If spraying occurs during an inversion, those particles accumulate beneath the inversion layer. Remember we said our atmosphere behaves like a liquid? The colder, denser (pesticide-laden) air drains downhill into low-lying areas. It can also move laterally over great distances, in unpredictable directions, when light winds begin.
Clouds
If the morning were overcast instead of clear, the clouds would intercept much of the sun’s short-wave radiation, absorbing or reflecting it back into space. The Earth’s surface would still warm, but more slowly, suppressing thermal turbulence. As an aside, if clouds form in the evening, they reflect long-wave radiation from the Earth’s surface back down. This Greenhouse Effect is why overcast nights are warmer than clear ones.
Therefore, extended periods of mostly clear skies in the evening or night means a high probability of strong temperature inversions. Conversely, cloud cover usually means a near-neutral atmosphere, so no strong inversion.
Wind
Inversions are only mildly affected by light wind (e.g. 6 to 8 km/h), but as the wind increases and mechanical turbulence mixes the air, the strength of the inversion will be reduced and the atmosphere will approach a neutral condition (see the blue line). In this condition, airborne particles are not dispersed by thermal turbulence, but some mixing will occur. So, there may not be a thermal inversion, but spraying would still be inadvisable if the wind got too high.
Humidity
Inversions form more rapidly when there is less water vapour in the air to absorb radiation. Once humid air has cooled to the dew point, water condensation gives off energy and warms the air a little. This slows the formation of the inversion. Be aware that inversion conditions can exist long before fog, dew or frost forms, so they are not a good indicator for the beginning of an inversion – you’re already in one!
If you see fog, dew or frost, you’re already in an inversion. The air has become cold enough to condense or even freeze water.
Soil conditions and topography
This is a complex issue, but soil conditions that make inversions more intense include low soil moisture, freshly tilled soils, coarse soils, heavy residue and closed crop canopies. Topography matters, too. We’re discussing radiation inversions in arable regions, and the kind that form on mountains or deep valleys. Nevertheless, inversions in shaded areas (e.g., behind windbreaks) start sooner, and last longer. See the NDSU factsheet for more detail.
Spray timing
Inversions, once formed, persist until the sun rises and warms the Earth’s surface, or until winds increase and mix the stationary layers of air together, re-establishing a more neutral temperature profile.
Sunset is not a good indicator of the beginning of an inversion – it can start a few hours before. Therefore, evening spraying may be just as risky as night spraying. Very early mornings (e.g. around sunrise) are not much better. Remember, at sunrise, the inversion will be at its maximum height.
The rising sun will warm the earth and create turbulent conditions, starting near its surface (e.g. a few metres). Most inversions will have dissipated two hours after sunrise, which may be the best choice for spraying.
Detecting an inversion
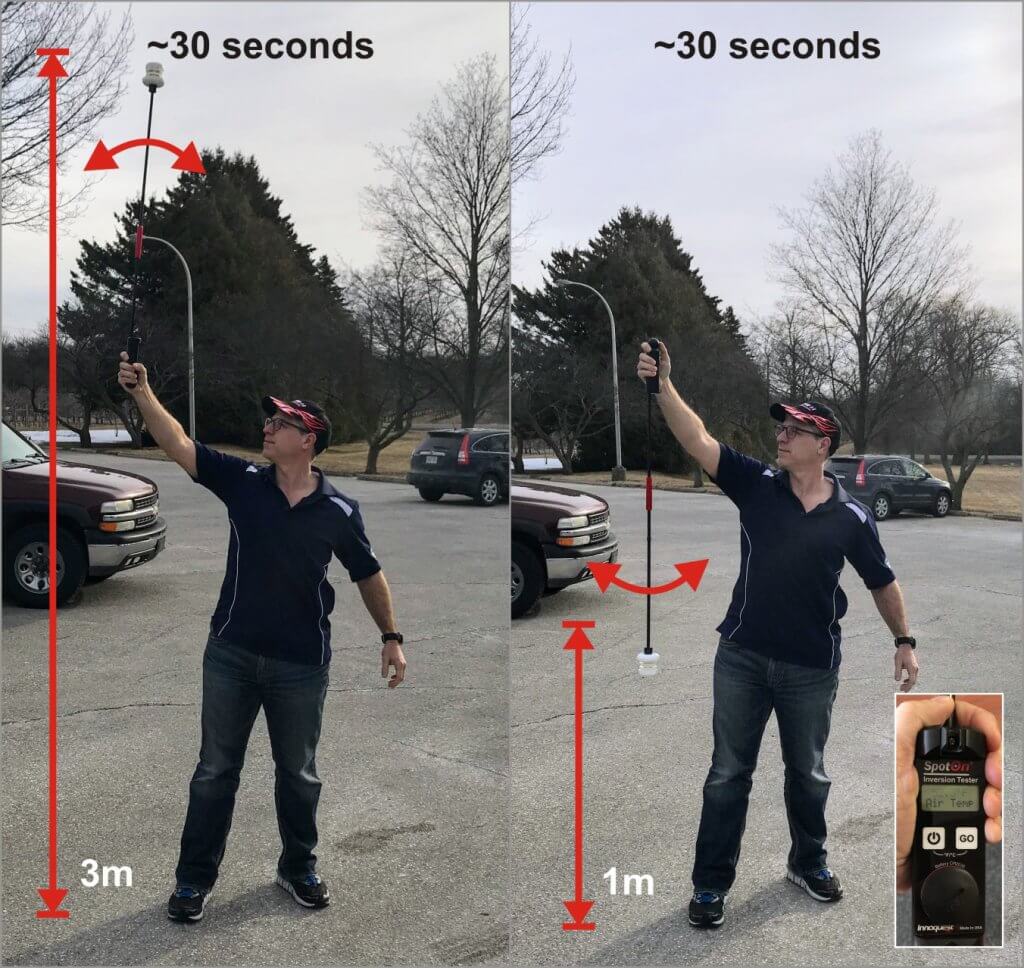
The only sure way to know if you are in an inversion is to take two air temperature readings: one near the ground and one about three metres higher. If the surface air temperature is cooler, you are in an inversion. The magnitude of the difference indicates how strong the inversion is.
Accurate measurements are difficult to manage with conventional thermometers, but SpotOn now makes a hand-held detection unit. If you have one, be sure to let it acclimate before you use it. Leaving it in a hot, or cold, truck or sprayer cab prior to use means it may give a false reading.
Inversion forecasting is getting better, but it’s still location-specific and not entirely reliable. Sprayer operators should learn to watch for the following environmental cues:
Large temperature swings between daytime and the previous night.
Calm (e.g. less than 3 km/h wind) and clear conditions when the sun is low.
Intense high pressure systems (usually associated with clear skies) and low humidity where you intend to spray.
Dew or frost indicating cooler air near the ground (fog may be too late).
Smoke or dust hanging in the air or moving laterally.
Odours travelling large distances and seeming more intense.
Daytime cumulus clouds collapse toward the evening.
Overnight cloud cover is 25% or less.
Note: If you suspect a temperature inversion, don’t spray.
For more information on how weather affects drift, download this pamphlet from the Australian Government Bureau of Meteorology.