Tag: calculator

  • How to Calibrate a Drone – Swath Width Calculation

    How to Calibrate a Drone – Swath Width Calculation

    Calibration is a fundamental step in any spray application. To apply the correct product rate, we need to know how much liquid per unit land area is deposited under the sprayer.

    To conduct the calculations, either manually or through the drone software, we need to know the width of the spray swath. This task requires the operation of the sprayer under typical conditions, some kind of sampler capture the spray deposit, and a means of quantifying that deposit so the spray pattern becomes apparent. Here’s how we do it:

    1. Confirm the accuracy of the flow meter

    Drones don’t typically report the spray pressure of the spray mix. Instead, they report the flow rate using a built-in flow meter. The drone maintains the desired application rate by using the flow rate to adjust pump speed and engage nozzles over a range of travel speeds. Because everything depends on the flow meter, its accuracy needs to be verified.

    • Fill the spray tank with clean water and flush all the lines.
    • Install nozzles required for task, ensuring all nozzles are identical and in good working order.
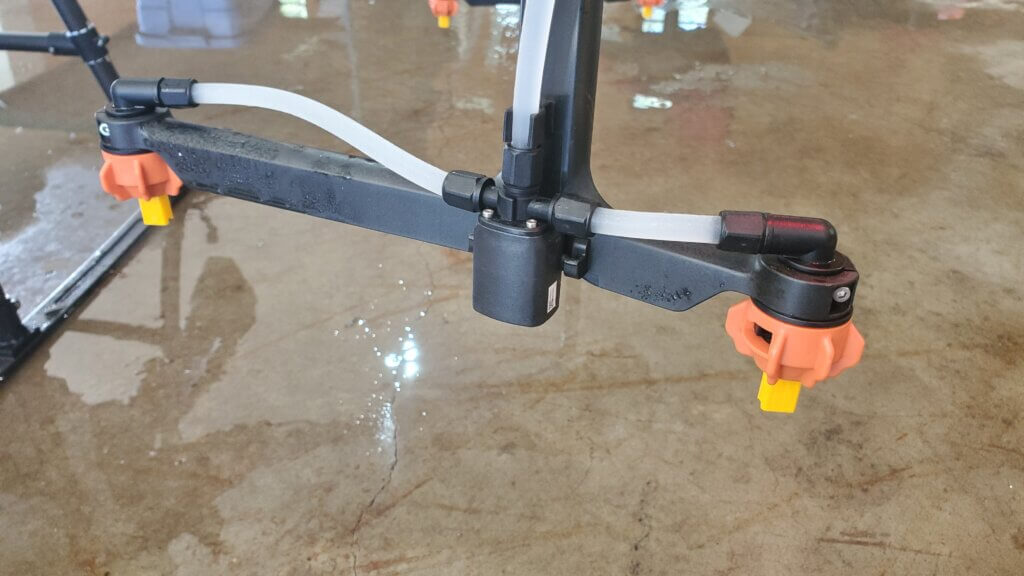
    Nozzles installed on DJI T20 drone.
    • Select the nozzle size you installed on the spray monitor.
    • Purge the air from the system.
    • Activate the spray and wait for the flow rate to stabilize on the spray monitor. This may take a few moments.
    • With the nozzles flowing, place collectors under each nozzle and collect the spray liquid for a fixed time, say one minute.
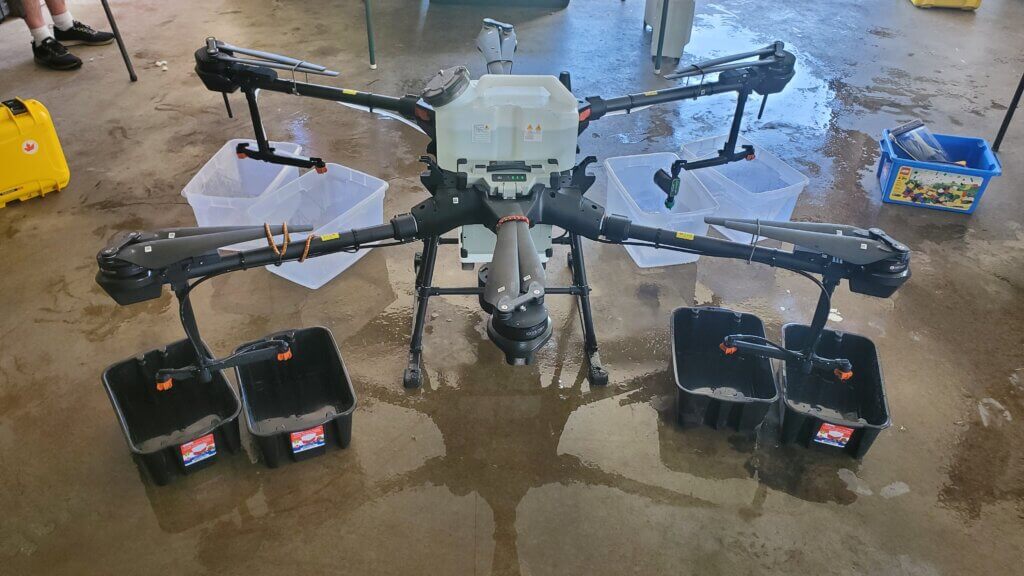
    Capturing spray during flow meter calibration.
    • Ensure the collector catches all the spray. Buckets often create turbulence. Rotary atomizers make this more difficult.
    • When the time elapses, remove the collectors and then shut off the spray.
    • Unless the shutoff is very fast and positive, leaving the collectors in place during shutoff can introduce error as the flow diminishes.
    • Confirm that the volume collected from each nozzle was identical, and that the flow rate reported by the drone flow meter is accurate.
    • Repeat to ensure consistency.
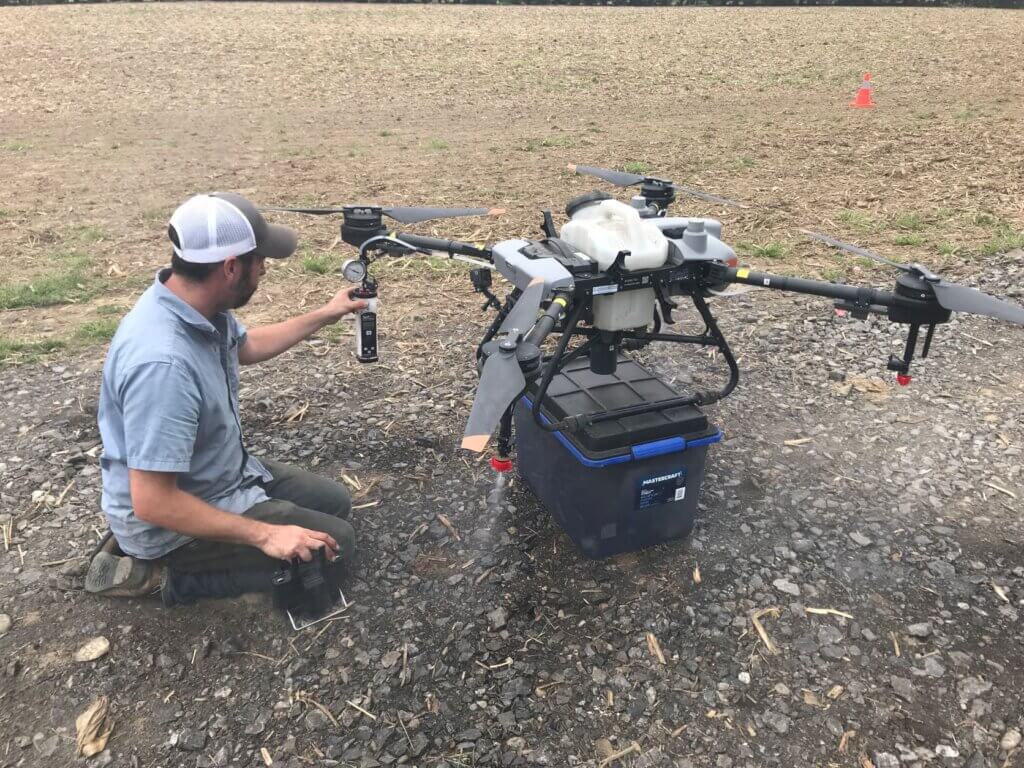
    Use of a Spot-On digital calibrating cup ensures that all spray is captured and it also reports the volume instantly.

    2. Measure the swath width

    Spray swath width is variable. For a measurement to be relevant we must evaluate spray deposition under environmental conditions that are similar to the planned spray operation, as well as use the same operational settings such as altitude, travel speed, nozzle choice, and application volume.

    Spray samplers are positioned along the ground, perpendicular to the flight path. We use water-sensitive paper (WSP) because it’s readily available, fast and easy to use, and the deposits can be analyzed visually or using simple apps that calculate coverage. We create a sampling line of WSP positioned a 1 m intervals (or maybe 0.5 m for narrow swaths). The samplers should extend to twice the expected swath width to account for any swath displacement from sidewinds.

    • Choose a day with light, consistent winds.
    • Find an open space free of obstruction in the direction of the prevailing wind.
    • Install a weather station to document conditions during flight.
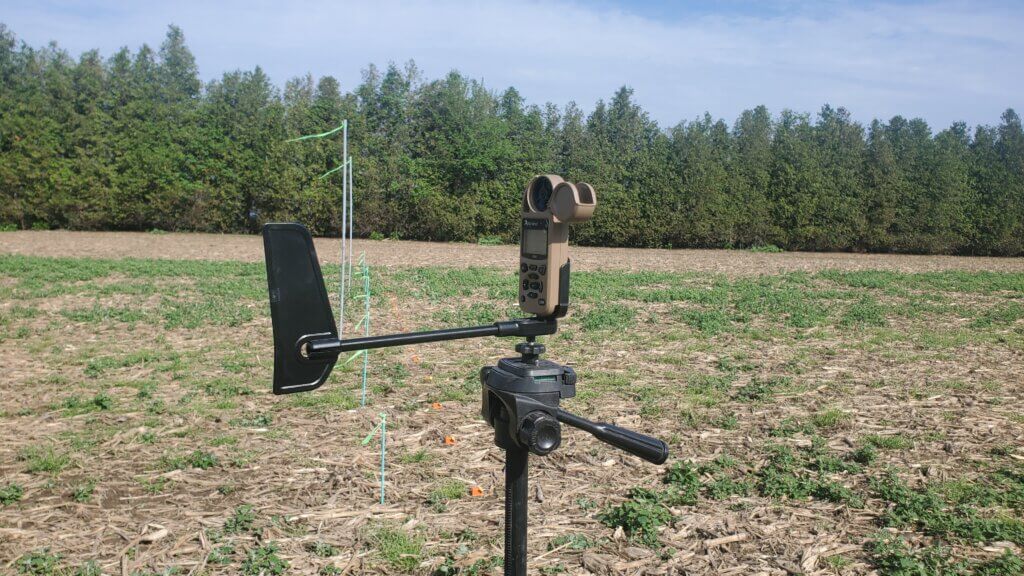
    A Kestrel 3550AG or 5550AG wind meter can record weather data and download to a phone via Bluetooth.
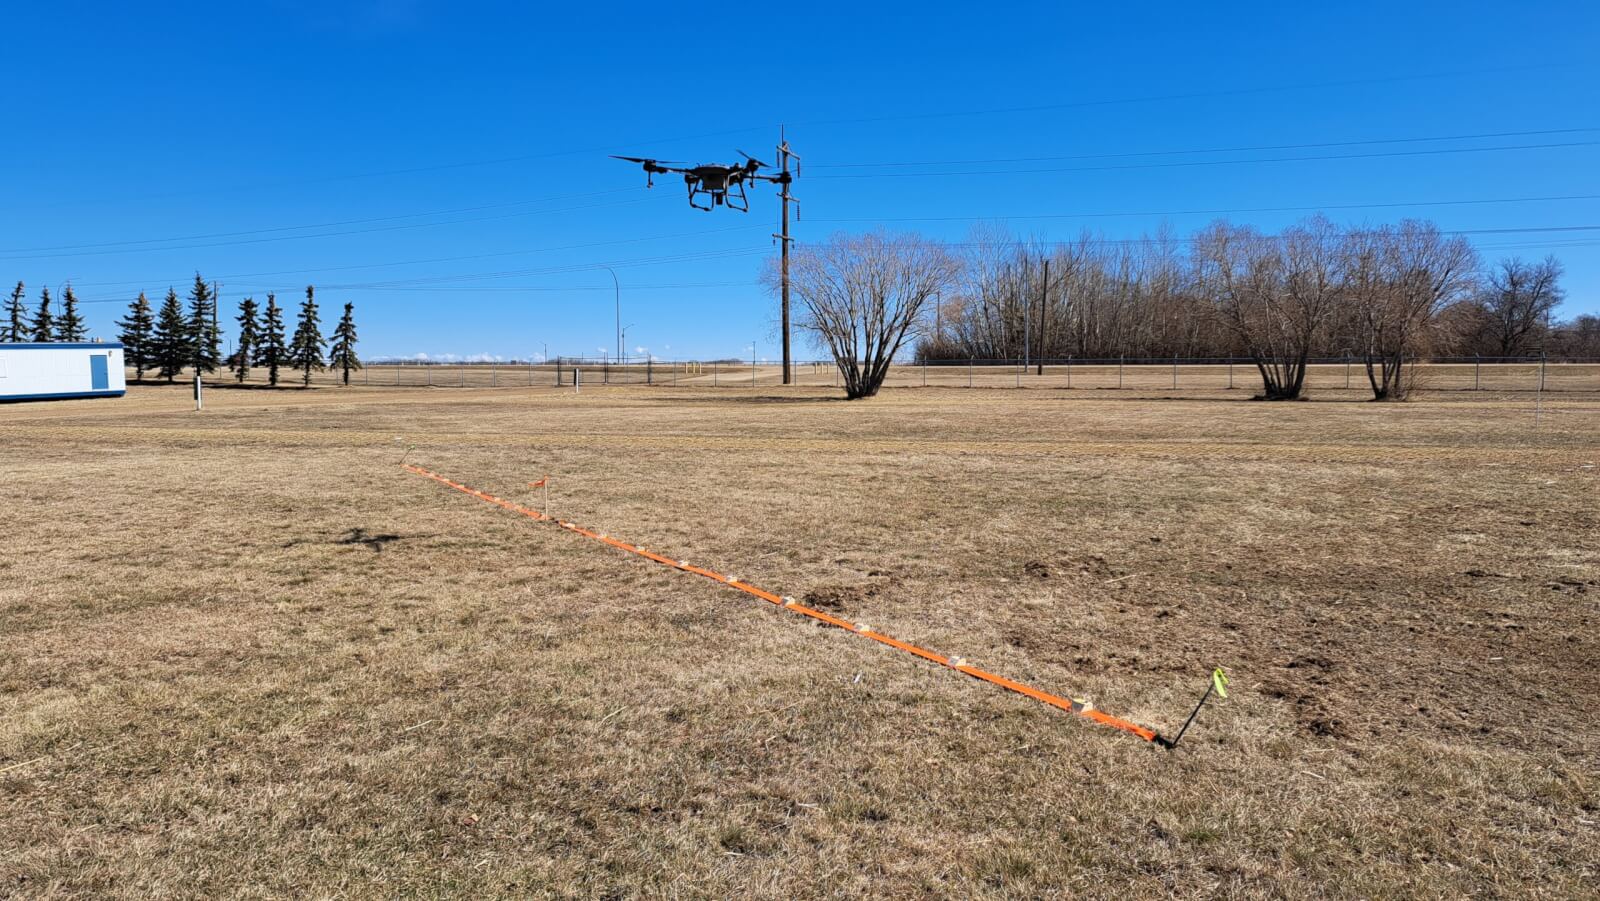
    • Mark an approximately 200 m long flight line into the prevailing wind direction by placing wire flags every 50 m.
    • At the 150 m mark, use wire flags to centre a sampler line perpendicular to the flight path. Sampler line length should be about twice the expected swath width.
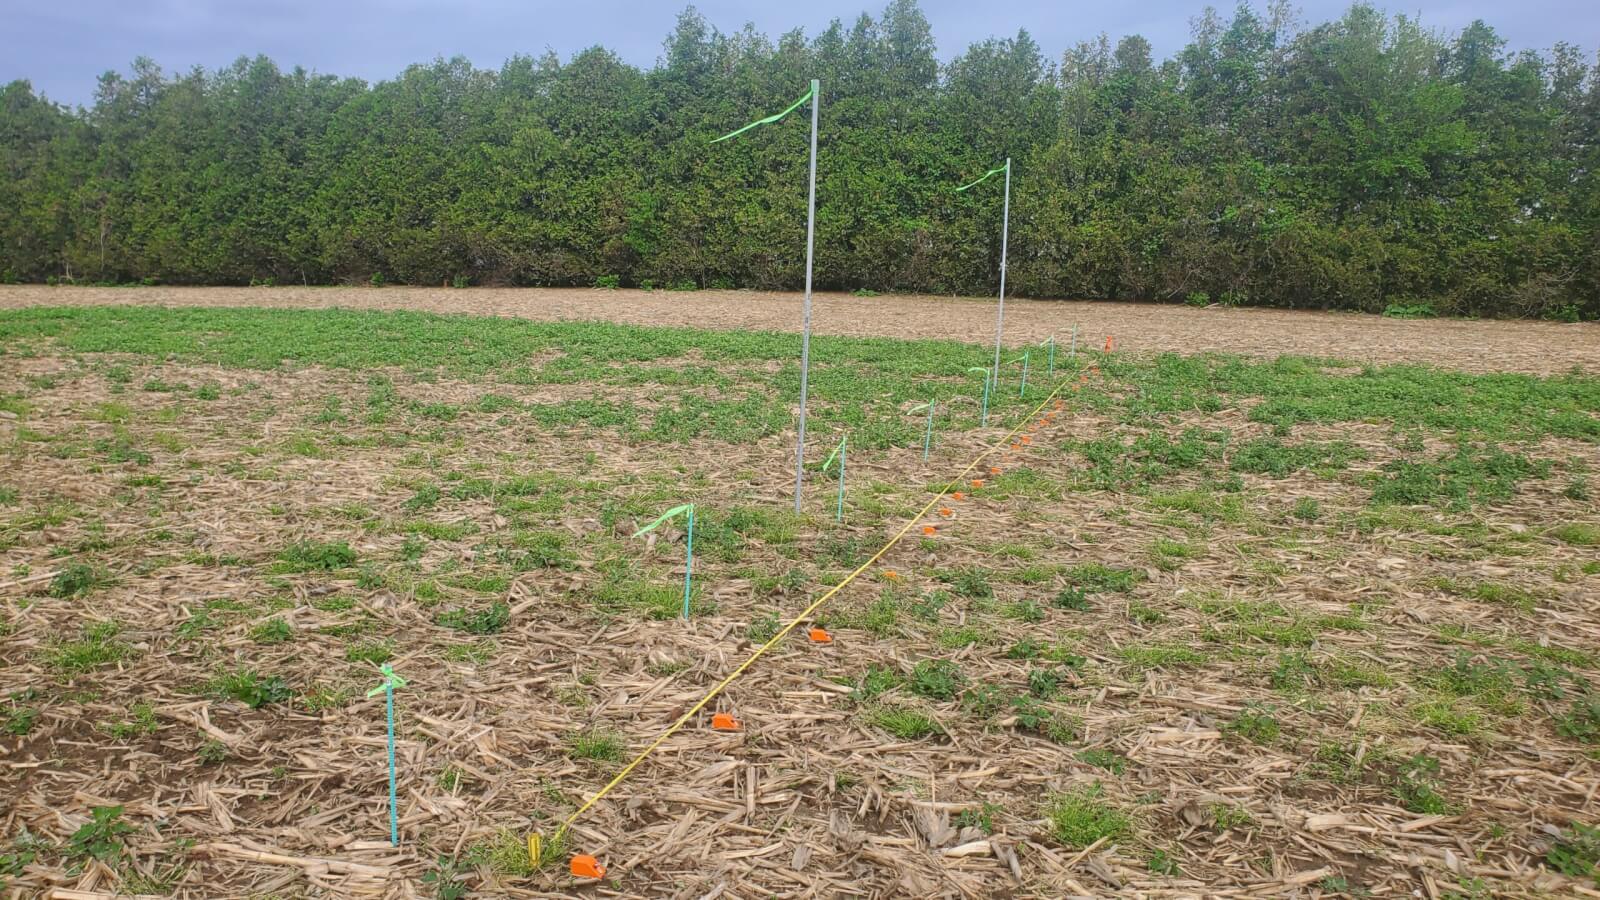
    Swath sampling line
    • Wooden blocks with paper clips can be used to secure WSP at regular intervals along the sampler line.
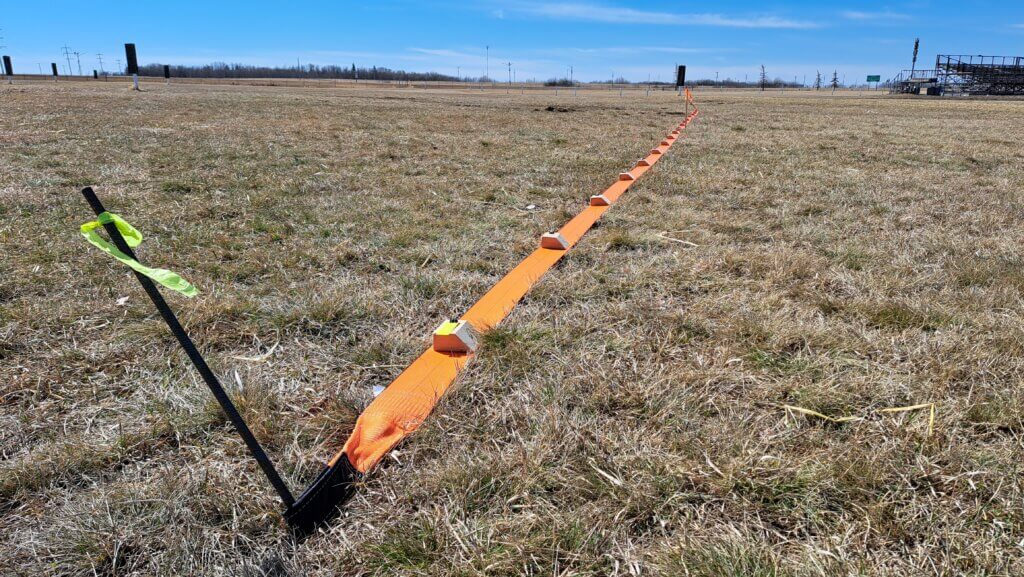
    Wooden blocks attached to a 4″ tow strap allows for easy setup and movement of sampling line.
    • Fill the drone 1/2 full.
    • Manually fly the drone along the entire flight line. The spray pressure, flow rate and altitude of the drone should be stable before it reaches the sampler line. This may take 25 meters or more depending on drone model, flight speed and drone weight.
    • Fly 50 m past the sampling line without any drone maneuvering to avoid affecting the deposit.
    • Land the drone and walk along the sampler line.
    • Note the deposits in the central region. Walk along line as the deposits taper off, looking for deposits that are approximately 50% of the average central deposits.
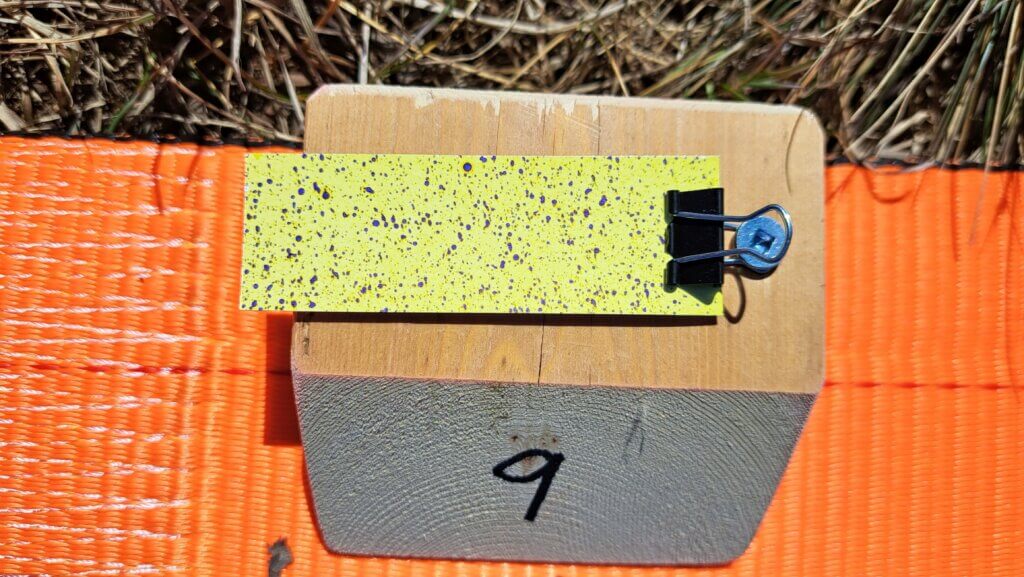
    Water-sensitive paper following a drone application.
    • Estimate the distance between these deposits on both edges of the swath. This is the estimated swath width that can be entered for the second flight.
    • Replace the WSP with a fresh set, refill the drone to 1/2 full, and repeat the flight two more times.

    Other methods perform a more advanced assessment by analyzing the entire swath, and not just intervals. These methods use dyes and dedicated hardware to quantify the deposits along strings or paper samplers.
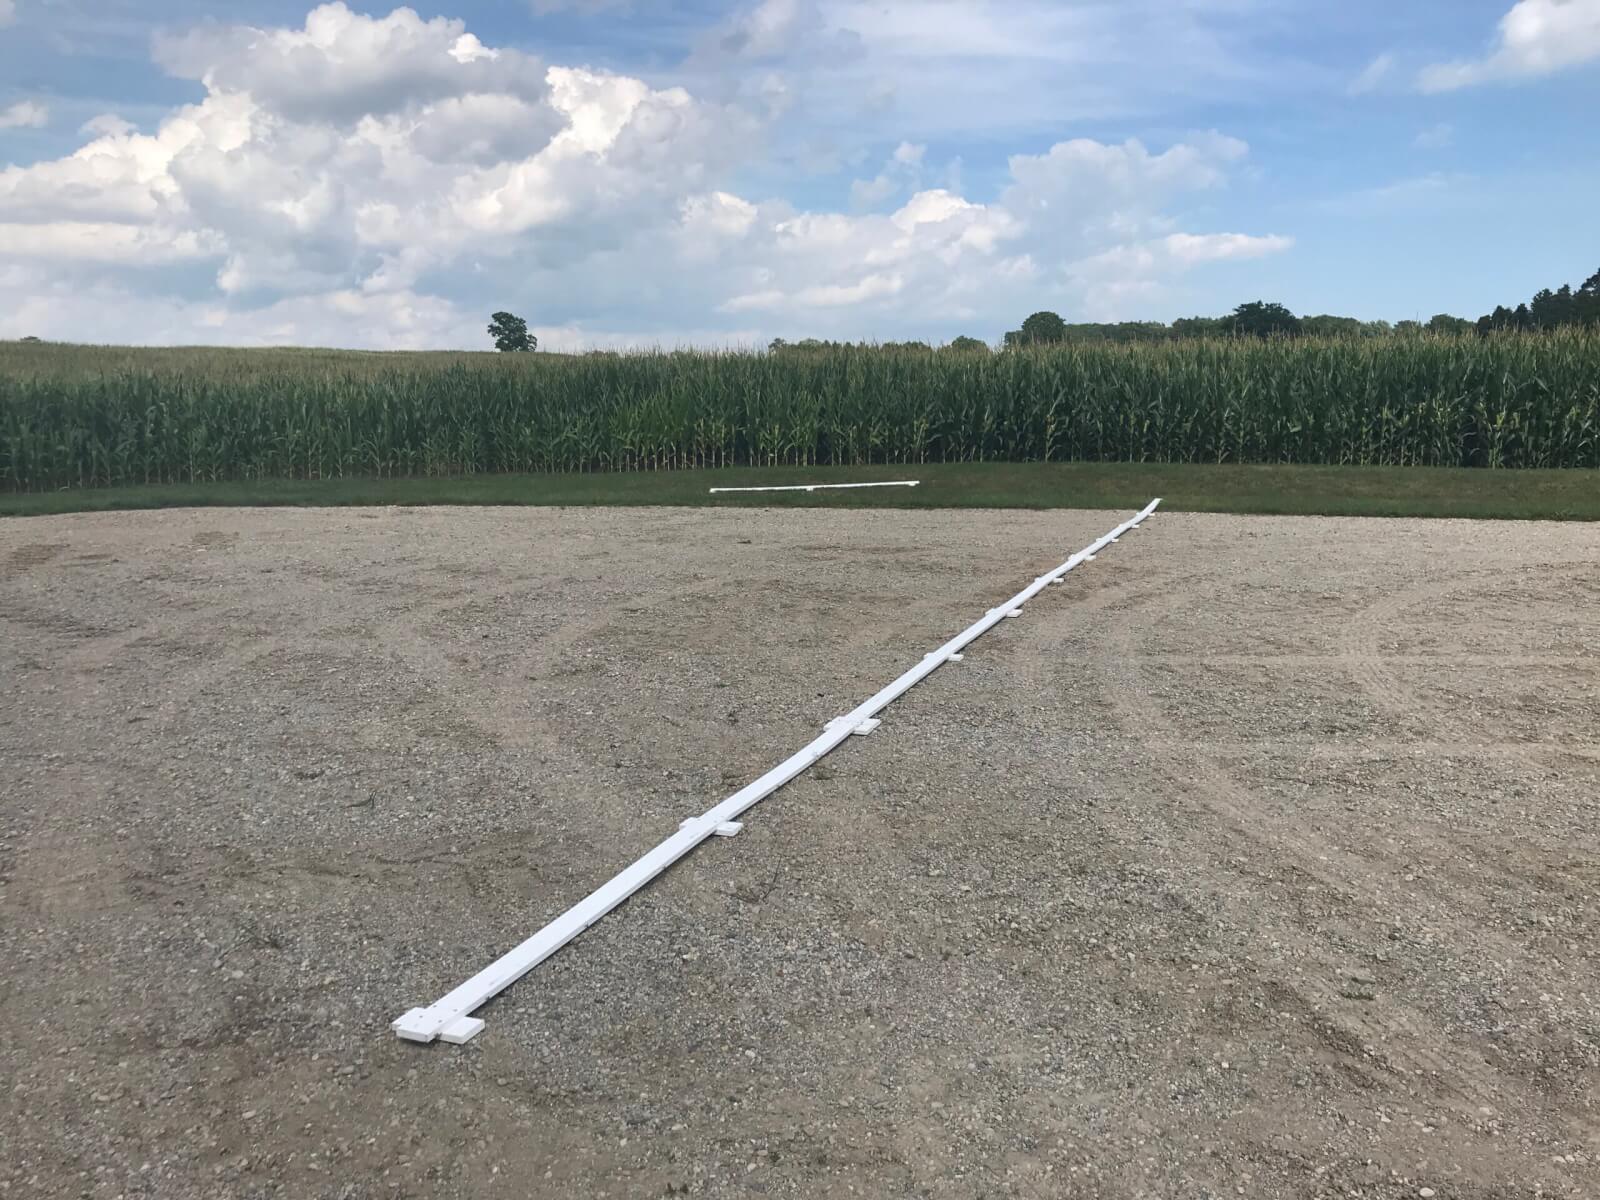
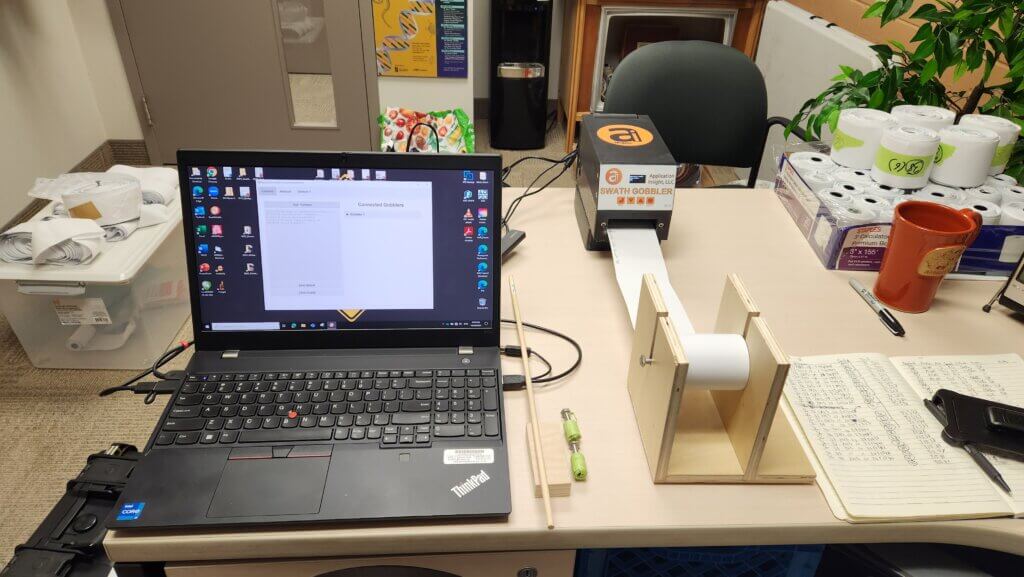
    The Swath Gobbler documents swaths at high resolution using lengths of 3″ bonded receipt paper, food grade dye, and a digital scanner.
    The Application Insight LLC Swath Gobbler scanner in action.

    3. Analyze the Pattern

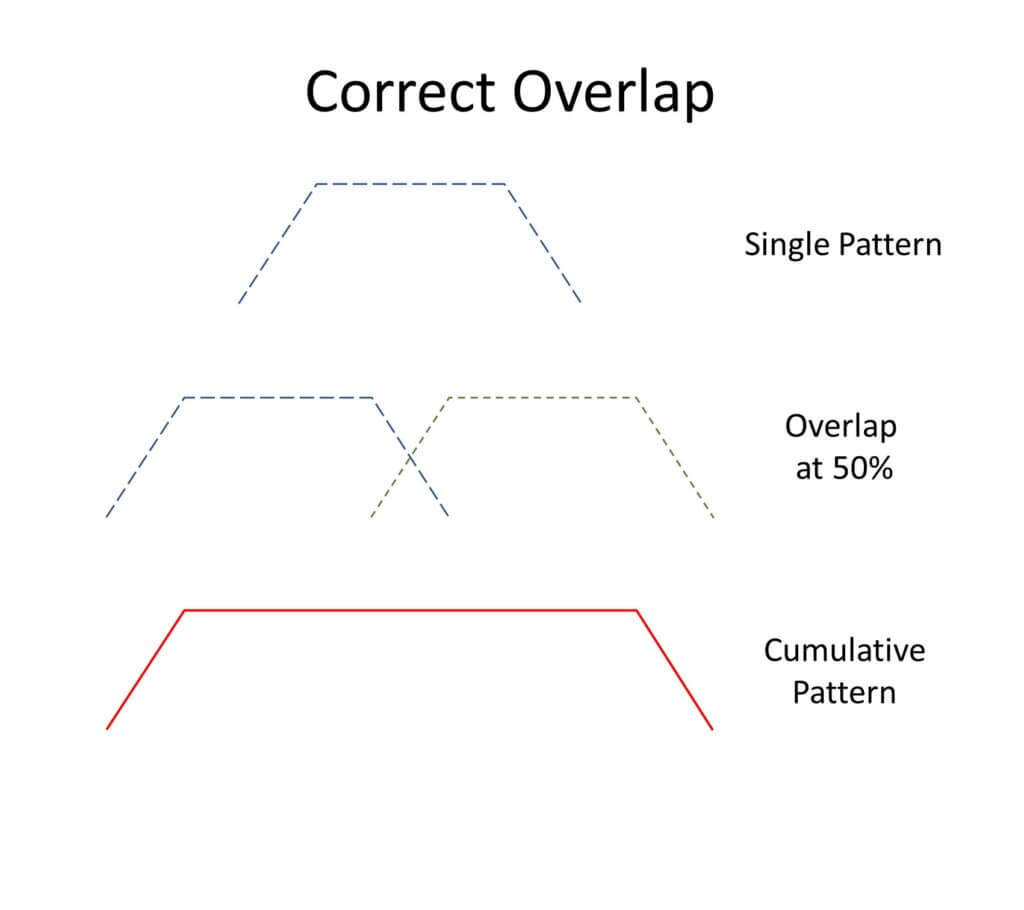
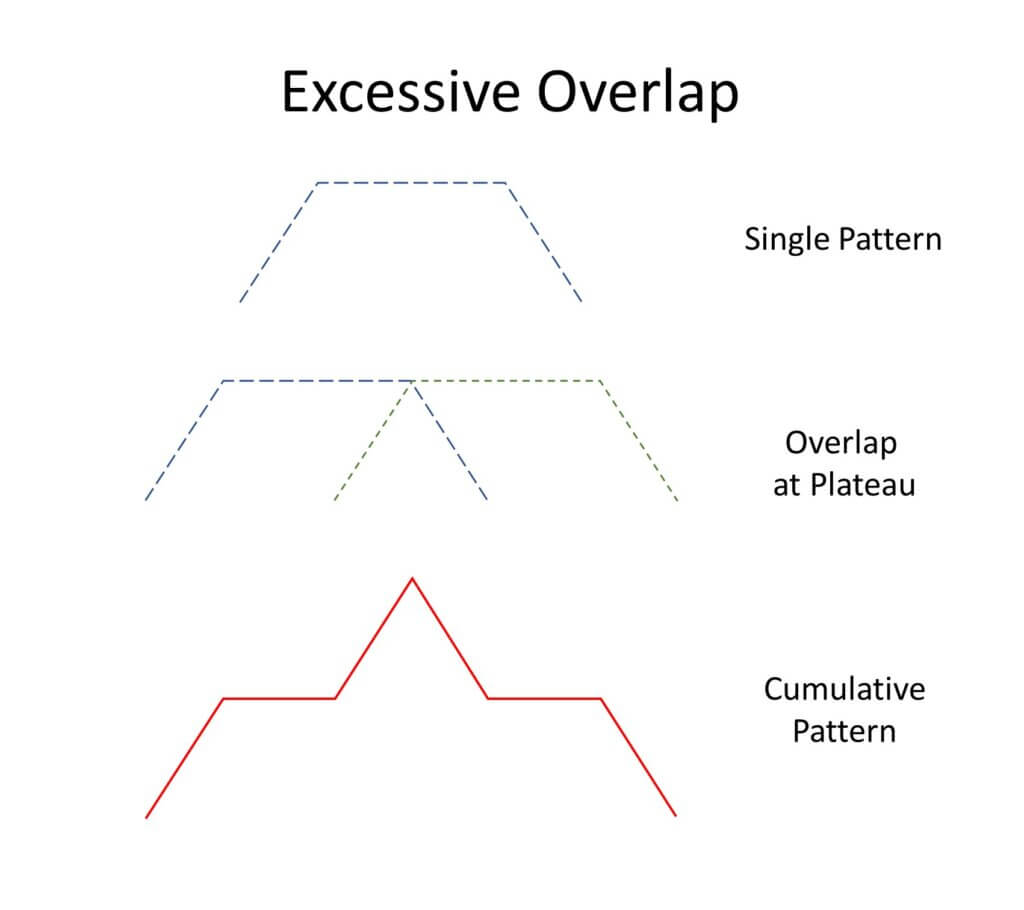
    The nearest approximation for drone swathing is that of a manned aircraft. The spray pattern of an aircraft is tapered, meaning the highest deposition is near the centre of the swath, and the edges of the swath fade to zero deposit. In order to achieve consistent coverage, we need the edges of the spray swath to overlap so the cumulative coverage at the edges is closer to that in the centre. Too little overlap leaves gaps and too much overlap results in excessive deposit.
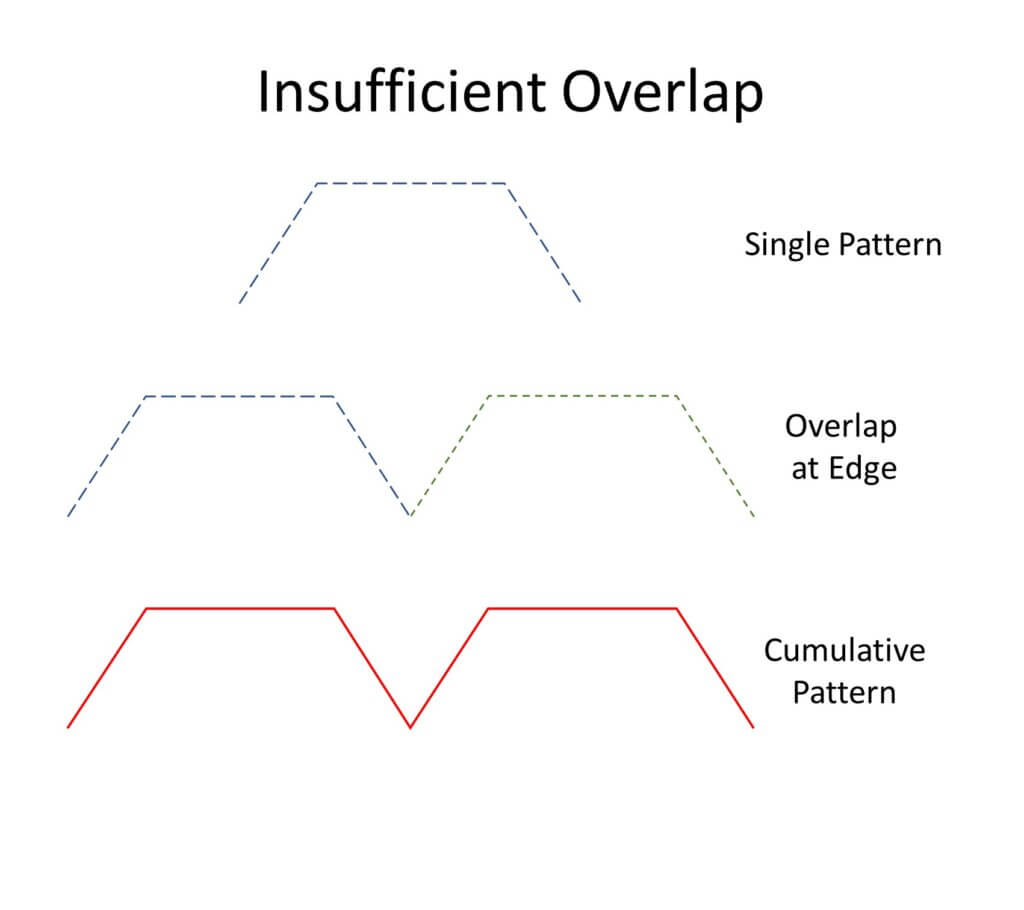
    Insufficient overlap creates gaps in coverage
    Excessive overlap results in over-dosing and waste
    Correct overlap is necessary for efficient and effective application.

    Deposits from drones can be highly variable. The challenge is to find an overlap distance that minimizes this variability, minimizes both over- and under-application, and maximizes swath width. Download a copy of an app we’ve developed to help you with this process.

    The first step is to estimate a reasonable average deposit, called “Threshold”. The app graphs the deposits from each sampler, and the user estimates a point on the Y axis (Relative Deposition) that represents the average maximum deposit. This could be the maximum value of the plateau, or a midpoint between the maximum and a nearby dip. The app assumes a value that is 90% of the maximum, to start.

    We then take 50% of this estimated average deposit, and find the two distances on the X axis (Sampler Locations) that intersect the curve at these points. The distance between these two points is our first estimate of the swath width. If two adjacent swaths are spaced so the edge of one overlaps 50% with the next, the overall cumulative deposit should be relatively even.
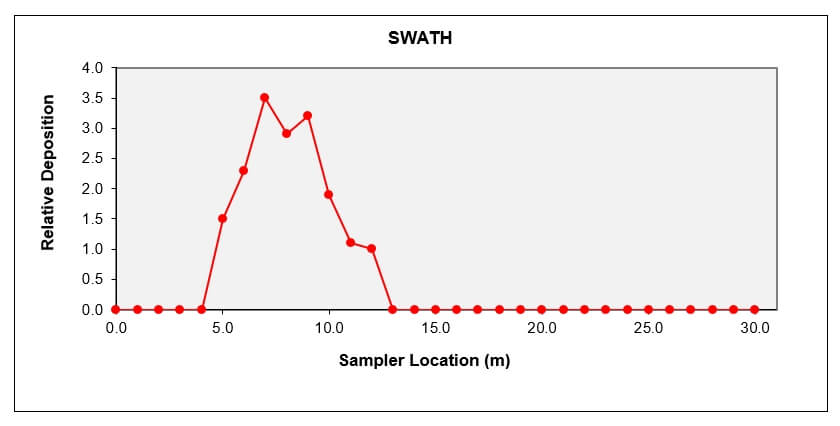
    The coverage information from each sampler location is graphed to create a deposit pattern.

    We can alter the amount of overlap to improve the apparent uniformity, but be cautious. For example, even though we can often improve the uniformity by narrowing the swath width, this can add deposit to the area under the drone and raise the overall deposit amount. That would be waste. Plus, the narrower swath also lowers the productivity of the drone. Use the app to establish a swath width that has the lowest variability (Coefficient of Variability or CV) AND results in a balance between over- and under-dosing. The app has an “Optimize” button that can do this for you.

    It’s possible to select a racetrack or a back and forth pattern. We’ve been using the racetrack pattern even though in real life the drone will frly back and forth, for the following reason: We expect a field to be sprayed in a sidewind. The tail of the deposit will always be on the same side of the pattern even with a back and forth flight path. In essence, the wwind creates a racetrack pattern for us.
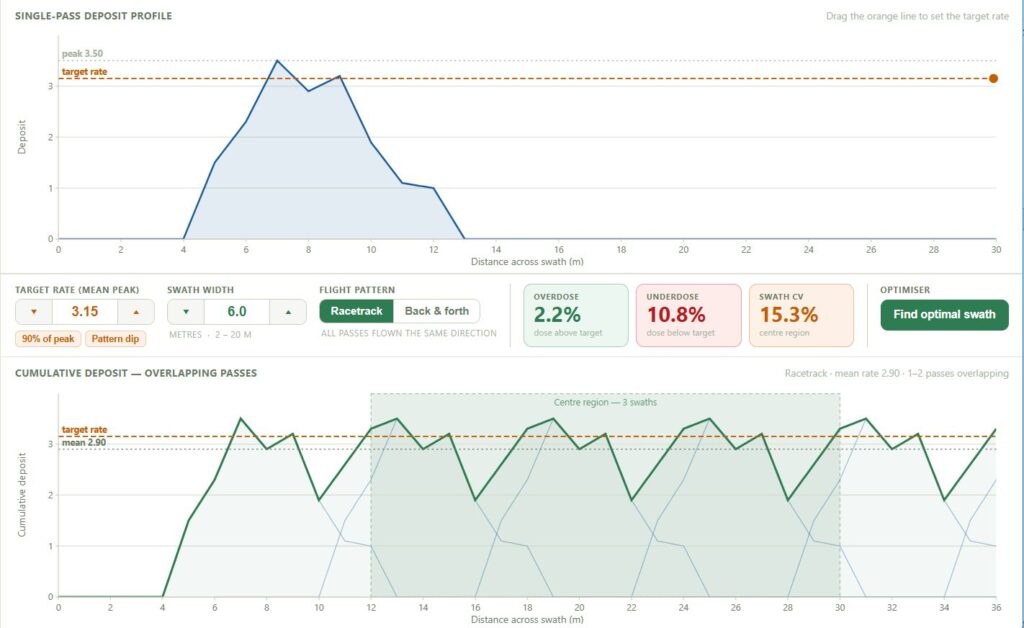
    The amount of overlap is adjusted to minimize variability (CV) and both equalize and minimize over- and under-dosing.

    The app allows you to import your data using an Excel file. If the file has multiple data column, the user can select the column to be analyzed. From that point, other columns can be selected as the analysis proceeds. Each analysis can be saved and exported as a pdf file.

    4. Recognize the factors that influence swath width

    Operational use case affects swath width

    Swath width is affected by altitude, speed, water volume and spray quality. Generally, higher altitudes, lower volumes, and finer sprays will result in a wider swath. Unfortunately, the same configuration also results in greater drift. It is recommended that swath widths be determined for each spray volume and nozzle arrangement that will be used.

    Drones will be applying low water volumes and this requires a critical assessment of coverage to ensure the deposit density is sufficient to achieve the desired result. A low volume will require a finer spray for minimum coverage to be realized. Coarser sprays that reduce drift and evaporation will need higher water volumes and result in narrower swaths. Significant time may need to be invested to understand the effects of operational settings and environmental conditions on spray deposit uniformity and swath width.

    Effective Swath Width and the Agronomic Use Case

    The relatively sparse coverage at the extremes of the measured swath width may be insufficient to elicit the desired biological result. The Effective Swath Width (ESW) represents the segment of the total swath width that results in pesticide efficacy. In some use cases, the two widths can be similar, but typically the ESW is only a fraction.

    The difference is influenced by the “Agronomic Use Case” which includes factors such as:

    • Spray mix rheology (i.e. the interaction of spray mix viscosity and atomizer design on droplet size)
    • Minimum effective dose: This is a complex relationship between coverage, spray mix concentration and pesticide mode-of-action that results in an effective result while minimizing the environmental impact.
    • Target location (e.g. a pest within a dense canopy or a weed on relatively bare ground)

    Taken collectively, research has shown a 20-30% reduction in ESW for corn, wheat and soybean fungicide applications compared to swaths measured on open ground. Conversely, herbicides sprayed on bare earth or sparse vegetation can produce an efficacious response 20% wider than the measured swath width. The impact of agronomic use case on ESW must be considered during mission planning.

    Additional pointers

    Here are a few tips and tricks to help you be successful when calibrating your drone.

    • Drone patterns will have deposit peaks and valleys in the central region. Repeated runs are needed to confirm that these are real and persistent. If so, then adjustments in flying height, spray quality, or water volume may be needed to eliminate them.
    • The absence of pressure gauges on drones can be corrected by installing an analog gauge in-line with one of the spray nozzles. If may be necessary to mount an auxiliary camera on the drone to record this gauge. We have observed strong fluctuations in spray pressure, particularly on starting a spray swath, that were not reflected in the reported flow rate.
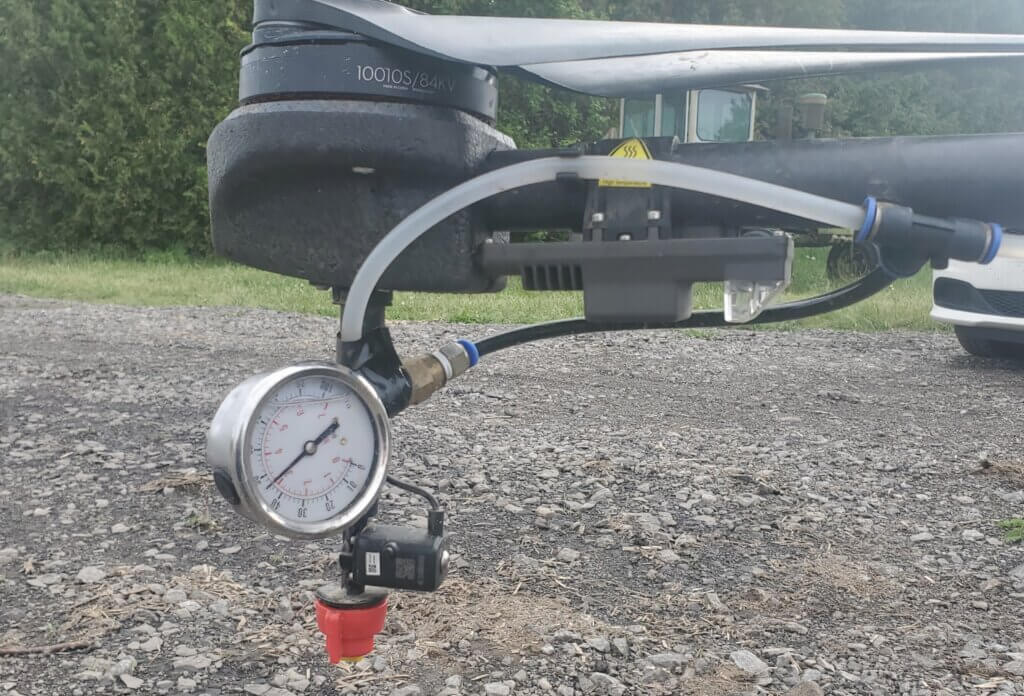
    A pressure gauge can be plumbed into a drone without affecting flight behaviour. A camera is trained on it to read pressure during a flight.
    • Many drones have the option of recording the flight screen during a mission. This will provide a record of the performance of the drone, and can be valuable should performance problems arise.
    • Although swath width calibration is done by flying into a headwind, the actual spray application should be done with a side wind. Start at the downwind edge of the field and turn into the wind. The drone is symmetrical and the tapered spray patterns should equalize the deposits. Alternately, flying into a headwind and returning with a tailwind can alter the aerodynamics of the spray deposition process, alternating between a wider and more narrow swath width, respectively.

    Drone spraying will walk a razor’s edge of sorts – there is little room for error when using scant water and fine droplets. Getting the basics right has never been more important.

  • Sprayer Productivity for Smaller Scales

    Sprayer Productivity for Smaller Scales

    Travel is an amazing teacher. It exposes assumptions and replaces them with real life experiences.

    On a recent trip to New Zealand, I learned a valuable lesson in sprayer productivity. I had long talked about wider booms being a key factor, being an easy change that allowed more area to be covered per pass. I had assumed large fields, large tanks, and fast fills as part of that system, and validated it with calculations and observations.

    During that trip, I learned that things look really different when the landscape dictates certain limitations. In places like New Zealand, fields tend to be smaller, as expected, with the longest run averaging 300 m or so. Sprayers are also smaller capacity, with trailed sprayers typically fitted with a 24 m boom and a 3000 L tank. Mounted sprayers, commonplace on the North Island, may have smaller tanks and booms, with 2000 L and 18 m width a reasonable average. Self propelled sprayers are not common on farms, but custom applicators use them.

    Tender systems (called bowsers) are also rare. Most applicators return to the farm yard, or another nearby water source, to fill. A single filled sprayer can often do that entire field, so moving to a new field and re-filling are part of the same workflow.

    Some very interesting things happened when such a scenario was analyzed.

    We used a newly re-vamped Productivity Calculator (below) to make the calculations.

    Some basic configurations were assumed. All sprayers travelled 15 km/h when spraying, and turned in one headland at 8 km/h. The tank remainder that necessitated a re-fill was set at 5% of tank volume. Tank cleaning was assumed to be required every four tanks, taking 60 minutes. Sprayers were typically refilled in the farm yard or a nearby water source, requiring a ferry (transport) time of 15 minutes each way.

    The first scenario was the base configuration, from which one factor was changed in each iteration to examine the magnitude of the change. With the 24 m boom, 3000 L tank, 200 L/ha application volume, a field length of 300 m, a loading time of 30 minutes, and a loading location that required a 30 minute round trip, net productivity was 8.0 ha/h. 22% of engine hours were spent spraying, the remainder was lost to turning at the end of a run, driving to the loading location, loading the sprayer, and cleaning it. We will call that the spraying efficiency.

    Because wider booms are successful in improving productivity in western Canada, we examined the practice for smaller farms. Increasing the boom width from an average 24 m to 36 m yielded the first surprise. Productivity only increased to 8.5 ha/h (7%), and spraying efficiency was reduced to 16%.  The problem appeared to be that the wider boom dispensed with the tank contents faster, requiring more frequent filling. And that of course was the big time user, accounting for 60% of the engine hours. 

    The next step was to examine a larger tank (5000 L), keeping the original 24 m boom. This change yielded big results, with productivity jumping to 11.1 ha/h, a 33% increase from the base condition. The larger tank reduced the frequency of filling, and that reduced its drag. Spraying efficiency jumped to 31%.

    Another way to achieve a lower filling frequency is to lower the amount of water applied. This is a bit risky, as water volume is likely to most important variable that ensures good spray success, especially when dealing with dense, high yielding crop canopies. In cases where canopy penetration isn’t an issue, and systemic products can be used, less water may be an option. A modest decrease from 200 to 150 L/ha was tested.

    Again, a large jump in productivity was observed, from the base of 8.0 ha/h to 9.7 ha/h, about 21%, resulting in 27% spraying efficiency.

    What if fields were merged, or shelterbelts removed, resulting in longer spray passes? These would reduce the time lost to turning, which had been 8% of engine hours for the 300 m pass.  We decided to test a 600 m pass. But while it reduced the proportion of time spent turning to 4%, overall productivity barely nudged to 8.3 ha/h.  That’s a 4% improvement, not worth removing any trees over.

    One of the biggest game-changers in sprayer productivity has been the 3” transfer pump and efficient product induction systems. Reducing fill time from 30 to 15 minutes did have a large effect here too, increasing productivity to 9.3 ha/h, a 16% increase from the base. There remain inefficiencies in the system, such as the time spent with partial jugs that require measuring. A faster pump doesn’t address these. But perhaps a closed transfer system can.

    With the travel time associated with a home fill being such a large time consumer, introducing a field-based tendering system was expected to have a large impact. We combined this with a fast fill because a proper tender unit would have the larger pump. And the results were impressive, a jump to 13.7 ha/h. That’s a 72% increase from the base scenarios, boosting spray efficiency to 38%. 

    The final scenario involves two large changes. A new, larger sprayer with a 5000 L tank and 36 m boom, combined with a fast fill tendering system. And the results were equally large, boosting productivity to 19.8 ha/h, more than doubling the performance of the base condition (a 148% improvement). Spraying efficiency did not increase further from the fast-filling tendering system alone, because the faster filling was accompanied by the faster emptying of the wider boom.

    What is the value of this study? For one thing, we learned that a change that works in one geographic area may not work in another. For these smaller field scenarios, the benefit of a wider boom was undermined by the long downtime during fills. And obtaining a tender system when a single sprayer fill can cover a whole field wasn’t a slam dunk like it is elsewhere, where a field often requires several fills.

    Does a producer actually need to spray everything faster? The answer will depend on each farm. A general observation we’ve made is that the windows of opportunity for spraying are getting narrower. Restrictions on wind speed or temperature leave fewer hours in a day to get the spraying done. The risk of falling behind is lurking. And that means that application may not get done when they’re most effective. Disease may have progressed. Weeds will have grown. Crop safety may be challenged. Being even a little more productive can help mitigate all those risks.

    If nothing else, it’s critical for an applicator to know where the time goes. Use the calculator. Only then can you be strategic about correcting a problem. 

  • How Much Pesticide in the Tank?

    How Much Pesticide in the Tank?

    Sprayer math can be intimidating, but the effort gives solid value. When combined with a calibrated sprayer you reap the following benefits:

    • Determine how much spray mix is required to apply the intended rate.
    • Estimate how much crop protection product must be ordered for the season.
    • Populate spray records which allow you to review practices, respond to enquiries and satisfy traceability requirements.

    There are many ways to perform sprayer math, and you need only look to local pesticide safety courses, industrial catalogues, and extension resource centres for examples. If you’re already comfortable with your current method, don’t mix and match with others. Sprayer math is a series of related calculations that employ constants to keep the units straight. It’s all or none.

    Walkthrough

    Let’s start with the classic, US Imperial formula for calculating the sprayer output. We’ll weave in Metric, later. This base formula can be adjusted to allow you to solve for any factor, as long as you’re only missing one piece of information. Turns out your high school teacher was right – you DO need algebra.

    GPM = [GPA x MPH x W] ÷ 5,940

    In this case, you can determine an output rate (GPM – gallons per minute). You’ll need to know your target volume (GPA – gallons per acre), your average travel speed (MPH – miles per hour) and your nozzle spacing (W – which is width in inches). The number “5,940” is a constant that handles all the unit conversions. If you divide the GPM by the number of nozzles on your sprayer (assuming they are all the same rate), you can hone in on the ideal nozzle size.

    But, as we noted earlier, you can do a lot more with sprayer math than just pick the ideal nozzle size. The rest of this article includes examples of both Metric and US Imperial formulae, but watch out for unit conversions. If at any time you don’t see the units you’re looking for, you can consult our unit conversion tool.

    Grab your calculator – it’s math time!

    Don’t be intimidated. With a little practice, sprayer math gets easier and it’s always worthwhile. The real trick is navigating unit conversions.

    Step 1 – How large is the area you need to spray?

    Multiply the length of the area you plan to spray times the width. If you are using metres, then divide the product by 10,000, which is the number of m2 in a hectare (ha). For feet and acres, divide by 43,560 which is the number of ft2 in an acre (ac):

    Step 2 – How much product is needed to spray the area?

    Consult the rate(s) shown on the label. In Canada, rates are often based on planted area (E.g. hectares). In Australia and New Zealand, they may be based on row length (not covered in this article). If you measure your area in acres, you’ll have to convert the rate by multiplying by a constant: 0.4.

    product-per-area

    Now multiply the area you want to spray (step 1) by the rate (step 2).

    product-per-area2

    Step 3 – How far can you go on a full tank?

    You know your sprayer output (determined through calibration) so you divide that into your tank size. Watch your units:

    full-tank-distance

    Step 4 – How much pesticide per tank? 

    Multiply the area that can be sprayed per tank (Step 3) by the pesticide rate (Step 2). Again, watch your units:

    pesticide-per-tank

    Step 5 – How much area is left to spray?

    Just subtract what you’ve already sprayed from the total area.

    area-left-to-spray

    Step 6 – How much pesticide in the last, partially-full tank?

    Multiply the area you have left to spray (Step 5) by the pesticide rate (Step 2). Yes, watch your units:

    pesticide-partially-full-tank

    Step 7 – How much spray mix will I need for the partial tank to finish spraying the total area?

    Multiply the area you have left to spray (Step 5) by the sprayer output (determined through calibration). Guess what? Watch your units:

    spray-mix-for-total-area

    Sample problems

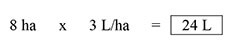
    Time to test your knowledge. Let’s suppose you want to apply a product rate of 3 L/ha to your blueberries. You calibrate your sprayer and determine your output to be 50 L/ha. Your tank holds 400 L of spray mix. Your planting is 500 m long and 200 m wide.

    Q1 – How large is the area you need to spray?

    area-to-spray

    Q2 – How much product is needed to spray the area?

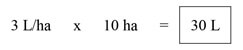
    product-to-spray-the-area

    Q3- How much area can be sprayed on one tank?

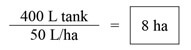
    area-on-full-tank

    Q4 – How much product should be added to a full tank?

    product-needed-full-tank

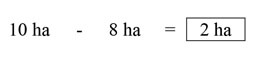
    Q5 – After the tank is empty, how much area is left to spray?

    area-left

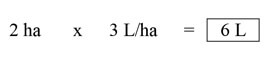
    Q6 – How much product to add to the last, partially full tank?

    product-partially-full-tank

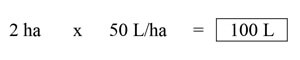
    Q7 – How much spray mix will be needed to finish spraying?

    spray-mix-to-finish-spraying

    Tank mix calculator

    You might feel we buried the lead by adding this calculator to the end of the article. It’s important for a sprayer operator to understand the math required to interpret labels and calculate tank mixes, so hopefully you read and understood the process before you got here. And now that you have, this is a very helpful tool. Try it online, or download a standalone version.

    Notable exceptions

    Certain situations aren’t covered in this article. If you are spraying a greenhouse, the math is different. If you are performing a banded application, the math is different. And, if you’re an airblast operator trying to reconcile why a pesticide label uses planted area rather than canopy volume for its rates, you’re in for some additional reading.

  • The Ultimate Sprayer Calibration and Unit Conversion Tool

    The Ultimate Sprayer Calibration and Unit Conversion Tool

    Canada, like most of the world, is officially Metric. America operates using the US Imperial system. It sounds very cut and dried, doesn’t it?

    However, anyone that’s tried to calibrate a sprayer in Canada quickly discovers that we’re really an amalgam of the two systems. We like to call it “Mock-tric“. By way of evidence, some operators still adhere to the dreaded L/ac. You know who you are. To be fair, some of our sprayers and nozzles originate from the states, meaning nozzle tables and rarely, sprayer indicators, can be in US Imperial.

    This leads to mind-bending questions such as:

    I drive 12 mph, spraying 150 L/ha and my pressure is about 40 psi. How many ml/min should my 72 nozzles emit for a product that wants a 6 oz/acre acid equivalent?

    Cue the quiet sobbing…

    Frustrated back in 2017, we created a set of conversion tables to help operators with almost any Imperial/Metric emergency. Admittedly, they were in 4-point font and therefore too cumbersome for practical use. We’ll keep one here for posterity.

    The good old days of “look-up tables”. RIP.

    Happily time has marched on and we now have a better way. Explore our new Sprayer Calibration and Unit Conversion Tool, below. While it doesn’t do it all, it certainly does a lot! You can:

    • Convert between common (and some uncommon) agriculturally-relevant units.
    • Calibrate a field sprayer for both broad acre or banded applications.
    • Calibrate an airblast sprayer for almost every traffic pattern and swath width.
    • Calibrate a plot sprayer, either for a handheld boom (any number of nozzles) or for a backpack sprayer mist/wand in 3D rows.
    • Calibrate a fogger for common closed environment structures

    To use this suite of calculators correctly, the user needs some agronomic understanding of what these variables mean and how to obtain them. In order to provide context, and reduce the friction, we’ve added a link to relevant articles at the top of each calculator.

    Grab an offline version here, or try it out below. We’ve tried to validate every path, but if you find a bug, please let us know. Once you know your calibration settings, go here to determine how much goes in the sprayer tank.

  • Improve your Drone Spraying Productivity

    Improve your Drone Spraying Productivity

    Drone operational settings such as capacity, speed, and swath width are useful figures for calculating productivity, but they only describe the airborne portion of the job. A commercial application business must also transport water, mix product, charge batteries, and establish an efficient staging area that is both safe for operators and maintains drone connectivity. If any of these functions fall behind, productivity suffers.

    We used one Ontario operator’s experience to show why drone productivity is measured as a complete application system, and not just flight settings. Download our offline version of the calculator or try it online at the end of this article. It has been pre-populated with the metrics from a corn fungicide case study. Agronomic context matters when considering operational settings.

    How to use

    Adjust a single variable to see what effect it has on productivity. Return the variable to its original value, then change another. That way you can explore the relative influence of each variable on the overall job.

    Which factors matter most?

    The factors that have the biggest impact on productivity are situation-specific, but here are some generic observations:

    • While swath width and flight speed play a role, both are limited by the agronomic realities of the job, so there may not be much latitude to change these figures.
    • Water volume used has an impact on productivity, but once again there are agronomic considerations. Too low a volume can compromise product efficacy and contribute to off target drift, and quite often the minimum volume is stipulated on the product label.
    • The drone’s tank capacity depends on the model, but maxing it out may not be the best option. Some large drones suffer reduced battery life and slower acceleration when filled completely.
    • The ferrying distance between where the drone empties and the staging area is variable throughout the job. This is why the calculator asks for an estimated average. Minimizing this number is an important consideration, but it may not be subject to change because the staging area location is primarily a function of field access, drone connectivity and operator safety.
    • The time to fill the drone and swap batteries plays a large role in productivity, depending on how many cycles are involved. Small improvements here compound into big impacts.
    • Tender water tank capacity (and refills) play a big role as well. If the operator has to stop spraying to retrieve more water, the drone isn’t spraying.

    Enter the parameters from your own operation to see what happens. The drone settings get a lot of the attention, but it’s tendering efficiency that keeps it earning.

    Drone Productivity Calculator

    Estimate field productivity, application time and water-support requirements with live operational modelling.

    Step 1

    Field and flight inputs

    seconds
    passes
    Step 2

    Water and support logistics

    minutes
    min/stop
    Do water retrievals halt operations?
    Yes
    Step 3

    Advanced flight model

    %
    %
    Live productivity estimate
    0.0
    Total operation
    Spraying share
    Productivity time
    Water required
    Water tripsadditional retrievals

    Time by activity

    total minutes

    Operational balance

    Operation details
    Ready to share this scenario?

    Download a branded, print-ready report of the current results.