In this installment, Dr. Tom Wolf, intrepid reporter, braves the unforgiving wilds of Saskatoon as he investigates claims of mysterious devices popping up all over the city. Colloquially referred to as “nozzles” these items are imprinted with obscure codes that scientists are struggling to decipher. Be the first to learn how to read a nozzle and nozzle table in our newest installment.
When we consult a nozzle catalogue we are interested in the flow and droplet sizes produced at a given pressure. Perhaps we should also consider the effect of pressure on spray angle. We have several articles discussing the collective impact of spray overlap, nozzle spacing and boom height on coverage uniformity (Check here and here for example). However, we don’t really address the fact that fan angle is not a constant. This may be more relevant with the growing adoption of spot sprayers.
To illustrate the potential for fan angle variation, we assembled a collection of red, flat fan nozzles (‘04s) from several manufacturers. We plugged each nozzle into a spray pattern table, set the regulator at a given pressure, and photographed the spray angle and flow distribution. This process was repeated for each nozzle at seven different pressures within the manufacturer’s approved range of 20-80 psi. After digitizing the photos, we measured the spray angle using a digital protractor.
We anticipated a concomitant increase in spray angle as the pressure increased. This is not news. Anyone who has operated a sprayer has seen the spray pattern open up as the boom fills and pressurizes. Bear in mind this was only performed once (i.e. n=1), so while it illustrates trends it shouldn’t be mistaken for a rigorous scientific comparison. Further, this demonstrates a static situation and not a dynamic one where travel speed, wind conditions and the vortices from the sprayer it self will influence matters.
We saw similar trends with nozzles other than 110˚ fans, but let’s focus on 110˚s due to their current popularity.
Fan angles for five common 110 degree AI flat fans over their manufacturer-recommended pressure range
The spray angle for 110˚ nozzles ranged from 75˚ at 20 psi to approximately 143˚ at 80 psi. One nozzle failed to reach 110˚ at any pressure. Conversely, there was another that was over 110˚ at nearly all pressures. Ideally, spray nozzles should be operated around the middle of their manufacturer-recommended operating range. Three of the nozzles tested came close to 110˚ at that median pressure, but only the TeeJet AIC110-04 measured 110˚ at the middle of its recommended range (~50 psi).
Using that nozzle as an example, let’s look at the pressure, spray angle and subsequent distribution of flow along the swath at three different pressures. At 20 psi, the spray angle was 85˚. The yellow balls are floats that reflect flow as a series of cross sections of the swath. We see that aside from the tapered edges (which illustrate the need for 100% overlap between neighbouring nozzles) the distribution was fairly even. One of the priorities in nozzle design is to ensure a low coefficient of variability over the operating pressure range. In other words, the length of the swath may change, but the spray quality and uniformity in that swath is still within spec. At 50 psi the nozzle produced the expected 110˚ fan, and the spray distribution remained even. At 80 psi, the angle spread out to 125˚, spanning a greater distance, but it started to produce a less-even distribution.
Photographs of spray angle and distribution for the TeeJet AIC110-04 at the extreme low, middle and highest pressures of its recommended pressure range.
When fan angle changes with pressure, it can have significant implications. Nozzle spacing on a boom varies from sprayer to sprayer. Generally 50 cm (20 inch) centres are the standard in North America, but we’ve seen 15″ and even 10″. Nozzle spacing and boom height collectively determine the degree of spray overlap. Excessive overlap isn’t a problem, although additional nozzles do mean added expense, cleaning time and potential for plugging. Conversely, gaps in the pattern could lead to sub-lethal applications or flat-out misses. For example, in this soybean demo plot (below) we sprayed a contact herbicide at low pressure to collapse the spray pattern. You can see the alternating stripes of hits and misses that resulted from an incomplete overlap of spray.
Soybean demo plot sprayed with a contact herbicide using 110˚ air induction flat fans at 20 psi. The collapsed spray pattern did not overlap sufficiently to burn the entire crop down, leaving a striped pattern and demonstrating the poor coverage.
Nozzle manufacturers generally recommend a 100% spray overlap for flat fans. This creates sufficient overlap when the boom sways low to the ground. It also increases the degree of droplet size homogeneity under the boom as coarser and fewer droplets are generally found at the “horns” or edges of the pattern compared to the centre. In order to ensure this degree of overlap, sprayer operators should observe and consider changes in fan angle over their typical pressure range. Otherwise, the cost of poor deposit uniformity under the boom could be high.
Operate nozzles around the middle of the manufacturer-recommended pressure range. However, just because a nozzle is rated over a range of pressures does not mean the angle is constant.
Lower pressures are a greater concern than higher pressures. 30 psi is the absolute lowest pressure for operating a 110˚ air induction flat fan; the ideal operating range for these nozzles is 50-70 psi.
If nozzles are not maintaining the recommended 100% overlap at your preferred pressure range, then consider switching nozzle rates, and adjusting pressure and boom height.
This work was performed with Victoria Radaukas, 2015 OMAFRA application technology summer student.
If you’re a sprayer operator with some experience behind you, you may have applied mercury arsenate, nicotine, Paris green, or perhaps even DDT. All of these historical pesticides were effective, but they were also toxic to both the applicators and the environment. Fortunately, today’s agrochemical manufacturers produce pesticides that are effective while being far less hazardous.
One important aspect of modern synthetic pesticides that enhances their efficacy is their ability to redistribute. Pesticide redistribution is the movement of a pesticide from its initial point of deposition to a different spot on or in the plant. Pesticides that can redistribute can improve pest control compared to those that must contact the target pest but cannot innately redistribute. This is especially true when spraying hard-to-wet plant tissues, such as flower clusters or fruit. Even when the immediate coverage of these tissues is insufficient, the subsequent relocation beyond the initial spray deposit can result in a more effective protective barrier. When plants are rapidly growing, many of these products can translocate through the plant tissues to protect newly emerged tissue that did not receive a direct deposit.
Some of the most difficult and persistent pests are more effectively controlled by redistributing pesticides. Materials that move within the plant after application provide improved control of piercing-sucking insects such as aphids and psyllids, as well as pests that feed in difficult-to-spray areas such as under leaves. These products can absorb into plant tissue, increasing their resistance to wash-off by rain or irrigation.
Five Types of Pesticide Redistribution
There are five significant types of pesticide redistribution: translaminar, vapor, xylem, phloem and redistribution via precipitation
Translaminar Redistribution
Translaminar redistribution (Figure 1) in its most literal sense is a compound moving from the side of the leaf that received spray, to the unsprayed opposite side. This results in protection on both sides. However, translaminar redistribution also involves limited radial movement providing a “halo” of protection around the initial deposition. The extent of this area of influence is product-dependent.
Figure 1. Schematic of translaminar redistribution, with small round dots indicating deposition of pesticide, arrows indicating the direction of redistribution, and the shading indicating the area of the plant protected by the pesticide.
Vapor Redistribution
Vapor redistribution (Figure 2A) occurs when surface depositions volatilize and move laterally along a plant surface, re-adsorbing to the plant surface in new locations as they move. Again, the extent of vapor activity is product specific, but also condition specific requiring an optimal combination of temperature, relative humidity, wind, and solar radiation to facilitate volatilization. When pesticides are referred to as “locally systemic,” it often implies that they exhibit translaminar and/or vapor redistribution properties.
Figure 2. Pesticide redistribution type schematics (A) vapor, (B) xylem, (C) phloem. The small colored groups of dots indicate deposition of pesticide, while arrows indicate the direction of redistribution, with shading representing the area of the plant protected by the pesticide.
Xylem and Phloem Redistribution
Xylem redistribution (Figure 2B), also called xylem systemic, refers to the absorption of a pesticide and subsequent systemic movement of the pesticide through the xylem vessels of a plant. Xylem vessels move water and minerals in an upward and outward direction in plants. There is very little movement of water and nutrients downwards or backwards along branches or leaves in xylem vessels. Xylem redistribution can help protect growing tissues from damage by pests or diseases when the pesticide redistributes from the point of application to the newly developing tissues. Most systemic fungicides and insecticides redistribute via the xylem.
Phloem redistribution (Figure 2C), also called phloem systemic, is the bi-directional movement of pesticides in the phloem vessels of a plant. Phloem vessels transport sugars and other nutrients both to the roots of plants and upwards and outwards to shoots and fruits/seeds. Phloem systemic pesticides are sometimes called “true systemic,” because they can translocate throughout the entire plant.
Some pesticides that redistribute via the xylem or phloem can be applied to the soil substrate to be absorbed by the roots and redistributed throughout the plant. The process of plant nutrients or pesticides being transported from one place to another within the plant is called translocation.
Soil-Applied Systemics
Several factors affect a pesticide’s ability to redistribute. These factors affect the speed of uptake, the duration and extent of translocation, and the amount of accumulation in plant tissue relative to the initial dose. For pesticides labeled for soil application, their uptake by plant roots and redistribution via xylem or phloem can lead to long residual efficacy of the product; Up to eight weeks or more depending on the product, plant, and soil. This is in contrast to foliar-applied products, where good residual efficacy could be expected to last two to three weeks depending on the product. However, foliar-applied products tend to provide a more rapid kill of target pests and a more rapid absorption and translocation of active ingredients.
For soil-applied systemic pesticides, the composition of the soil substrate can affect the uptake of the pesticide by the plant. Growing media high in organic matter (>30% bark or peat moss) can bind pesticides, making it difficult for plants to absorb them through roots and subsequently translocate via the plants vascular system. Soil applications of systemic materials should take place one to six weeks prior to the onset of the insect pest or pathogen. This allows sufficient time for the pesticide to translocate to, and accumulate in, target tissues. The more water-soluble pesticides (e.g. Thiamethoxam) are taken up more rapidly than the less water-soluble pesticides (e.g. Imidacloprid).
Redistribution via Precipitation
In contrast to systemic pesticides, contact pesticides cannot redistribute on their own. However, rain or irrigation can spread the deposit to some degree, increasing coverage area. This effect should not be relied upon, as it depends on the product formulation, the intensity of the precipitation, and the interval following application. In the case of prolonged precipitation, the residual activity of contact products can be greatly reduced as they are diluted and washed off plant tissues.
Plant Morphology
The status of the plant to which they are being applied is a significant consideration when applying redistributing pesticides. Both soil-applied and foliar-applied pesticides are more rapidly absorbed and redistributed when applied to young plants or juvenile plant tissue. In general, when plants are actively growing, have a strong root system, or are actively transpiring, they tend to absorb and translocate pesticides more rapidly than when plants are growing slowly. In addition, plants with difficult to wet leaves or surfaces due to thick cuticles or waxy layers tend to not absorb pesticides as readily. Penetration into plants with difficult to wet surfaces can be improved by adding adjuvants such as surfactants to tank mixes.
Multiple Modes of Redistribution
The extent to which each product can redistribute can be thought of as a continuum. Generally, when a product exhibits some form of redistribution, it can also redistribute via a different method. A good example of this is xylem and translaminar redistribution. When a product can redistribute via the xylem it generally can move through the leaf via the translaminar pathway as well. Some products can redistribute via the xylem, translaminar, and vapor pathways all at the same time. Others, while technically able to redistribute via more than one mechanism, are only biologically effective via one mechanism.
Consult the Pesticide Label and Other Reputable Sources
The best way to determine how a pesticide product redistributes is to consult the manufacturer’s label, as well as technical information from reputable sources such as government or academia. If a manufacturer provides a technical information bulletin it is generally available on their website on the pesticide product page along with the label. However, because there are no standardized metrics to rate pesticide redistribution, there can be significant disparity between products. Some products that are advertised as being xylem systemic for example, are actually less systemic than products that are not even advertised as being systemic. Additional information on the efficacy and redistributing characteristics of specific products can be obtained from extension agents or crop consultants.
Conclusion
In summary, when selecting a pesticide remember to consider the four different pathways of redistribution (xylem, phloem, translaminar, and vapor) and how these methods may improve the efficacy of your application, allowing you to get more out of every drop.
We’ve often heard the adage “Coverage is King” but what does that mean, exactly? It means that in order for your spray application to yield acceptable results, a threshold amount of the active ingredient in your tank must end up on the target. But at what point have we achieved sufficient spray coverage without wastefully over-applying to the target? What does good coverage look like?
Let’s manage expectations right here at the beginning of the article: There is no single, definitive answer because it depends on the nature of the application. In other words, you have to understand which factors are relevant to your specific situation before you can understand what success looks like.
Let’s highlight some of those factors:
Transfer Efficiency, Catch Efficiency and Retention
This relates to the spray’s ability to span the distance from nozzle to target (transfer efficiency) get intercepted by that target (catch efficiency) and then deposit a biologically-active residue on the target surface (retention).
First, the spray must reach the the target location. This may be the soil, or it might be the underside of a leaf deep in a plant canopy. The degree of success will depend on the droplet size(s), distance to the target and the environmental conditions.
Then the droplets have to be retained by the target surface and not bounce or slide off. Difficult-to-wet surfaces such as fruit, stems and waxy vertical leaves may be more easily covered with finer droplets and/or formulations that include activator adjuvants (e.g. surfactants).
Then the deposit must stay wet long enough to be absorbed by the tissue, or leave a hardy residue on the surface that can withstand weathering (e.g. precipitation, sun, and even bacteria) long enough to encounter the pest. More on this below.
Mode of Action
This relates to where spray must deposit (or relocate to) in order for it accomplish it’s objective. Here are a few examples of how products might work. Read your pesticide label to determine your situation.
Some products require contact. Insects must touch them, either via a droplet landing on them or as they move through a deposit. Similarly, certain fungicides must contact fungal hyphae on the plant surface. A few products are designed to drench the target, as is the case with oil-based miticides.
Some insecticides must be ingested. That may be in the form of a surface deposit or in plant material that has absorbed the chemistry. Similarly, some fungicides are absorbed by plant tissue.
Many herbicides are mobile (i.e. systemic). They may be drawn up through the roots, or enter the cytoplasm via leaves and travel to the growing points on the plants, or move through the xylem. Others are contact, staying relatively close to the original deposit.
The sprayer operator should consider these factors when planning the application and when evaluating the resulting coverage. So how do we visualize coverage? Some operators look for the shine on leaves, or a cloudy residue once the spray has dried. That’s better than nothing, but we recommend water sensitive paper (WSP), which is still the most versatile and economical way to visualize coverage.
WSP can be purchased from most retailers that carry spray equipment. It is available in three sizes, of which the 1” x 3” size is the most common. It can be folded and clipped to a plant surface, or placed on the ground. We’ve written several articles on how to use it (such as here and here and in pretty much a third of the articles on Sprayers101).
There are two metrics that must be evaluated when assessing coverage on water sensitive paper:
the area of the target that has spray on it, and
the distribution of the droplets over that area.
Let’s use a metaphor to explain:
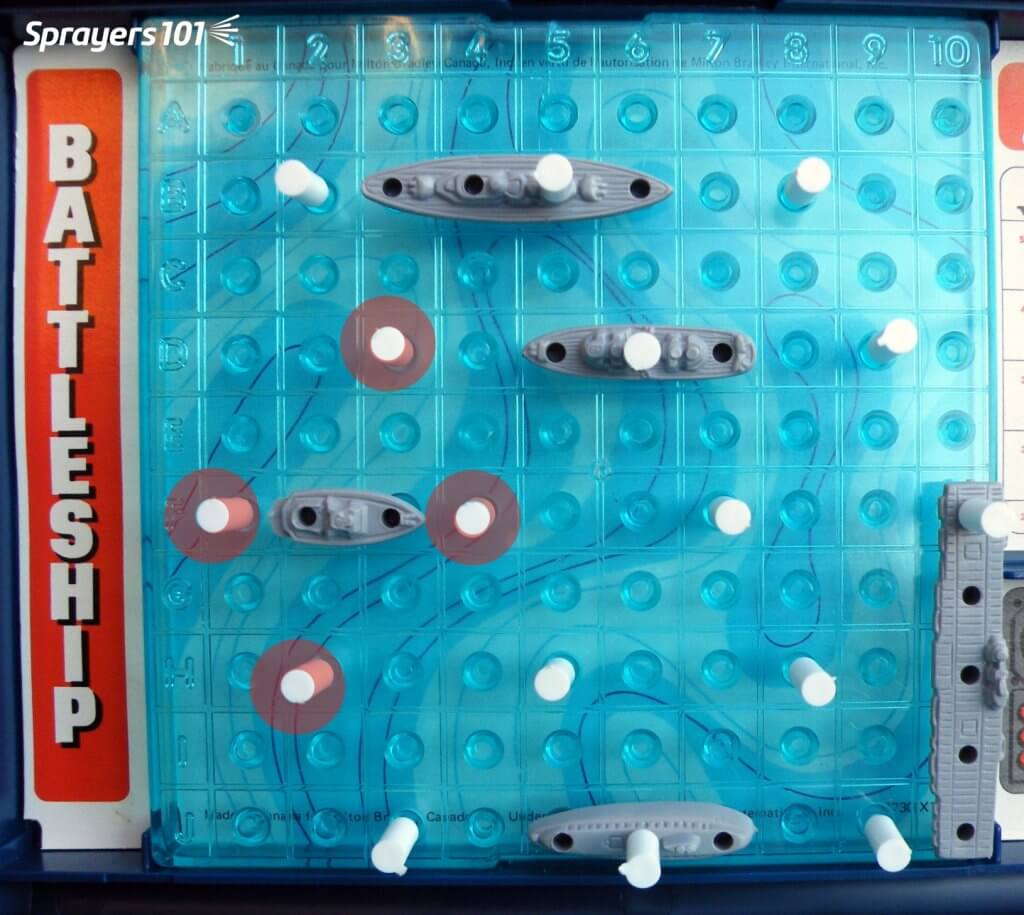
The Battleship® / Coverage Metaphor
Imagine the boats in this Battleship® game are the insect pests, and the board they’re on is a leaf. The white pegs represent the spray deposits. In this first image, we see 100% coverage and a very high deposit density. Sure, we got every boat, but this is literal and figurative overkill. There’s no need to completely drench the target in order to control most pests. When you spray a target past the point of run-off, you are not adding more pesticide to the target – you are displacing what was already there. The surface will not exceed the concentration of product you sprayed (with the possible exception of mixes that include certain adjuvants). While additional volume can improve coverage to a point, there is a diminishing return.
Unless the label specifically asks for a drench, this is too much coverage.
In this second image, we’ve covered about 15% of the target area, which is reasonable. However, note the lack of distribution. You can see that we’ve missed quite a bit of the leaf. If our pretend pests are sedentary and if this was a contact product, then we’ve missed. If this was WSP we would advise the sprayer operator to note how much space there is between the deposits. Could a pest such as an insect or small weed easily fit between the deposits?
15% coverage is good, but the distribution is bad.
In this third image, we are still covering about 15% of the target, but now the spray is distributed more evenly. Some of you are likely noticing that we missed a pest. That observation reminds me of one of my favourite exchanges from the movie “Christmas Vacation” where Clark finally got his house illuminated, but his father-in-law only sees the problems: “The little lights aren’t twinkling.” “I see that and thanks for noticing, Ed.”
15% coverage, distributed evenly. Deposits may have some pest activity beyond the edge of the residue (light red circles).
Yes, we still missed a pest, but spraying is playing a game of odds. You want enough spray to increase the odds of controlling a pest, but not so much to waste spray (and money and time). This image represents an ideal coverage situation. If this pest moves, or this pesticide redistributes even a little, it will affect the pest.
Plus, we should not discount the threshold of influence that lies around pesticide residue. Imagine a small circle around each droplet (illustrated here as light red haloes) where active ingredient may redistribute beyond the initial deposit to affect an adjacent pest. Perhaps even more importantly, deposits do not spread on WSP the way they do on actual plant tissue, so WSP always gives an underestimate of the potential coverage.
In this last image, we see that red deposits have been introduced. This represents a disease control program where an earlier (white) application retains some residual activity when next application (red) is applied. The second spray application almost never lands on top of the first, giving much more protection on the target. For those keeners out there, note that we got that last pest!
In the case of many disease management programs, subsequent sprays tend to fill in gaps left by previous sprays. If timing is prompt, residual activity will see you through.
If you Absolutely Need a Number…
So, what if you’ve read all this but still insist on a firm number to define adequate coverage? We’ll reiterate that there’s no universally-accepted threshold of deposit density or area covered. It would be nice if pesticide labels included this information, but they don’t.
We’ll stick out necks out and say that in general practice we see excellent results when we achieve 85 discrete deposits per cm2 as well as 10-15% surface coverage on at least 80% of the water sensitive papers in a spray application. If you can manage this, it should give satisfactory results in most situations.
Ontario Agriculture Conference – 2022
For a really in-depth conversation on the topic of coverage, check out our presentation from the 2022 Ontario Ag Conference. We tried to deliver a fun and memorable demo at the end of this presentation to show how different droplet sizes might contribute to coverage. Enjoy.
Harvest is mostly done and growers want to hear what we’ve learned and what’s coming next. Lecture season is upon us once again.
In 2021 we’re still finding our way through virtual conferences and hybrid models, but I like to think we’re slowly returning to the in-person format. Just last week I gave my first in-person talk in 20 months. It felt wonderful after having spoken into a dead-eyed camera for so long. Half-way through my lecture I remembered a lesson I learned a few years back and spontaneously decided to go off-script.
Let me explain.
In 2016 I was invited to present at the 40th annual Tomato Days conference in Southern Ontario. I knew what I wanted to say, but didn’t have a decent slide deck for that particular topic. I’d have to pull one together.
I work hard on my presentations. I employ lots of imagery (I create all my own illustrations). I get persnickety about fonts, white space and slide transitions. I try to tell a story that educates and hopefully, entertains. Prideful? Perhaps. But if you’re willing to sit on a hard chair for an hour, I’m going to do my best to make it worth your while.
I finished the slide deck, drove three hours to the conference, handed my USB data key to the organizers and sat down to wait my turn. It was a clear, bright winter morning and I saw that the pavilion we were in was more-or-less windows and a roof. It was so bright, in fact, that none of the 150 attendees could see the projector screen!
I watched sympathetically as the first speaker spent 30 minutes trying (and failing) to verbally describe his graphs. I cringed as the second speaker pantomimed her illustrations in some kind of brave, interpretive dance. Then it was my turn.
I decided I wasn’t going down that road.
When the moderator brought up my talk, I turned the useless projector off. I asked the squirming and disinterested audience:
Q. “What’s the most terrifying thing you can do to an academician?” A. “Take their Power Point away.”
For the next 30 minutes we had a discussion about spray coverage. No props. No slides. The audience slowly warmed up to the new format. They shared experiences. They debated. They asked questions. I became more facilitator than speaker.
When our time was up I think everyone was pleased. Sure, I missed a lot of my key points and never really addressed the subjects I thought I would, but who cares? Everyone learned something.
For me, I learned that speakers should abandon the script every now and again. It’s not always ideal since we’re there to teach and structured visuals are often required. But, the next time you’re asked to speak, consider the possibility of using your time to engage your audience and establish a dialogue… not just talk at them until the moderator gives you the 5-minute warning.
I have a colleague who does this masterfully. Whenever he is the last speaker on the agenda, and the previous speakers have discourteously gone over-time and whittled his time in half, he jumps straight to his take-home slide. He leads a quick discussion with the audience and becomes a hero. The moderators are now back on schedule and no one is late for lunch.
Since “Tomato Days”, I now try to do this once a year. I never know when the mood will take me, but when it does I give the audience a choice: They can hear my canned presentation or I can shut it down and we can have a conversation. To date, given the option, every audience has opted to go off script. It’s scary, it’s fun and like I said earlier, everyone learns something.
I challenge you to try it the next time you’re lucky enough to be in front of an audience in person.